For decades, astronomers have known that Supermassive Black Holes (SMBHs) reside at the center of most massive galaxies. These black holes, which range from being hundreds of thousands to billions of Solar masses, exert a powerful influence on surrounding matter and are believed to be the cause of Active Galactic Nuclei (AGN). For as long as astronomers have known about them, they have sought to understand how SMBHs form and evolve.
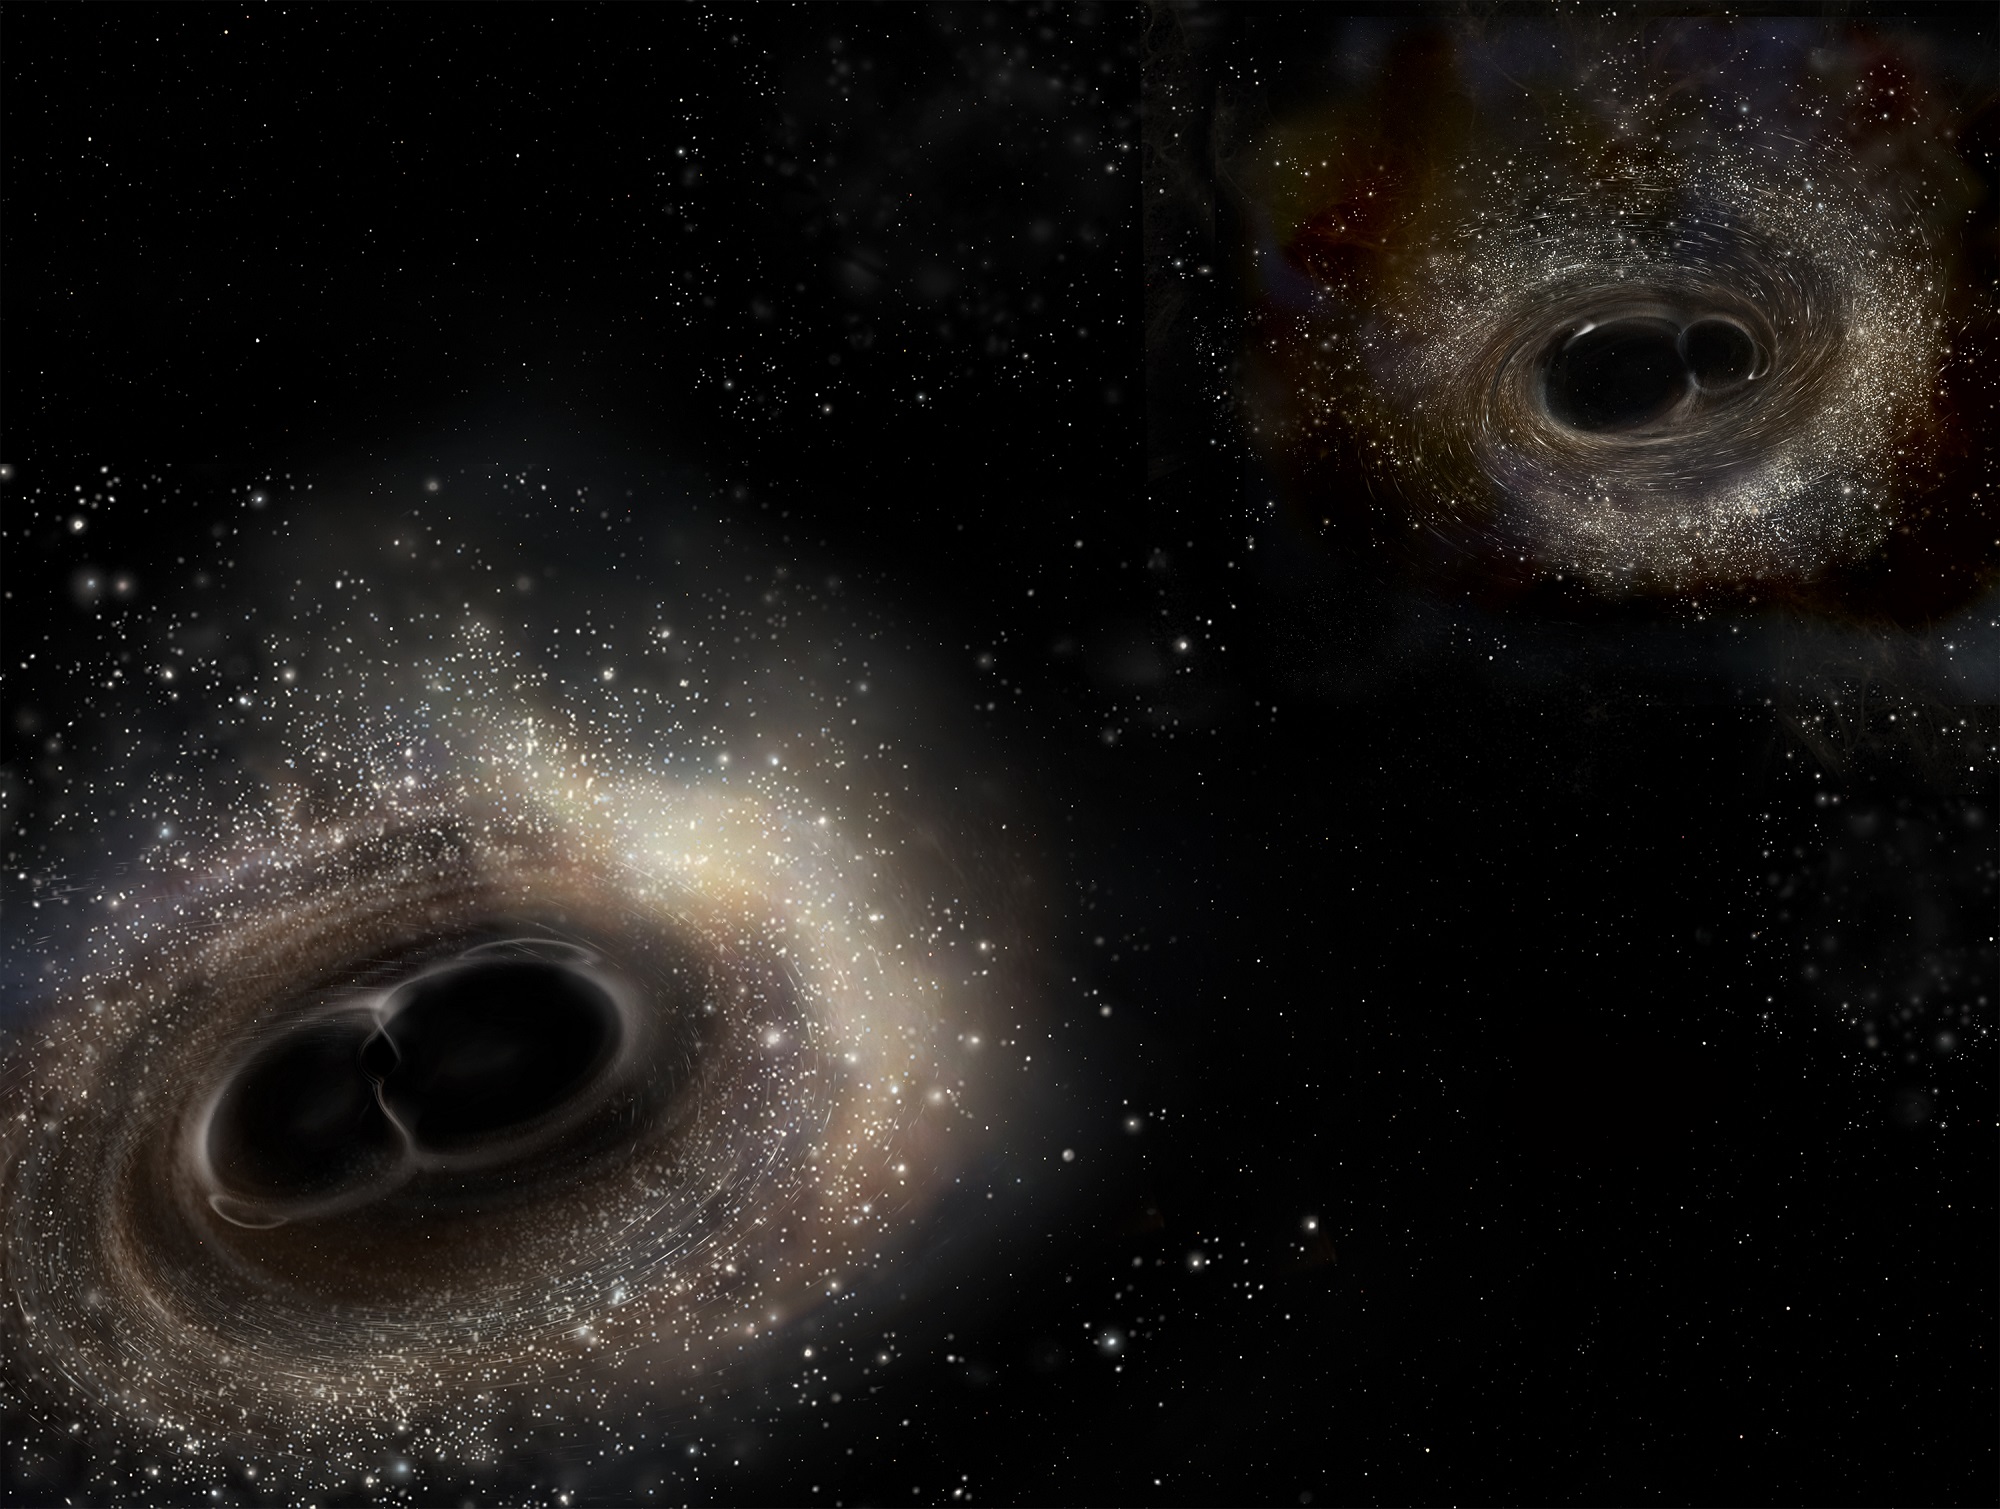
In two recently published studies, two international teams of researchers report on the discovery of five newly-discovered black hole pairs at the centers of distant galaxies. This discovery could help astronomers shed new light on how SMBHs form and grow over time, not to mention how black hole mergers produce the strongest gravitational waves in the Universe.
The first four dual black hole candidates were reported in a study titled “Buried AGNs in Advanced Mergers: Mid-Infrared Color Selection as a Dual AGN Finder“, which was led by Shobita Satyapal, a professor of astrophysics at George Mason University. This study was accepted for publication in The Astrophysical Journal and recently appeared online.
The second study, which reported the fifth dual black hole candidate, was led by Sarah Ellison – an astrophysics professor at the University of Victoria. It was recently published in the Monthly Notices of the Royal Astronomical Society under the title “Discovery of a Dual Active Galactic Nucleus with ~8 kpc Separation“. The discovery of these five black hole pairs was very fortuitous, given that pairs are a very rare find.
As Shobita Satyapal explained in a Chandra press statement:
“Astronomers find single supermassive black holes all over the universe. But even though we’ve predicted they grow rapidly when they are interacting, growing dual supermassive black holes have been difficult to find.“
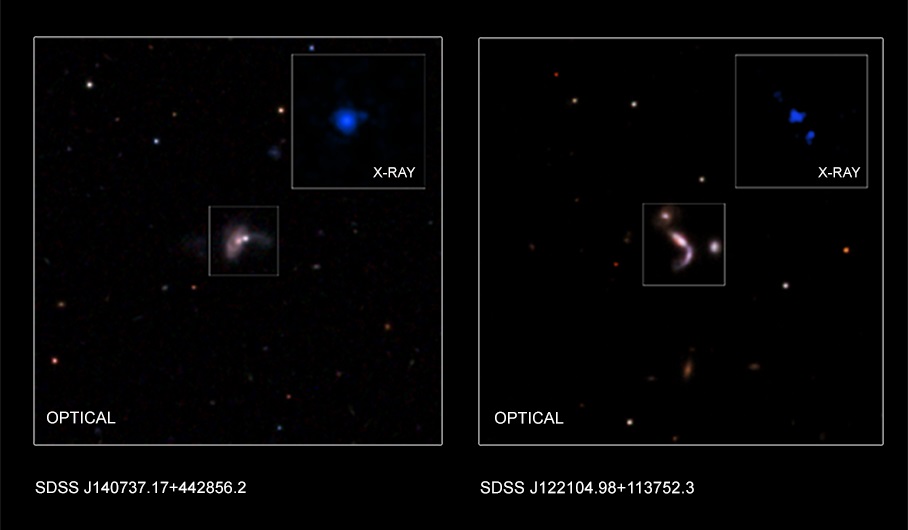
The black hole pairs were discovered by combining data from a number of different ground-based and space-based instruments. This included optical data from the Sloan Digital Sky Survey (SDSS) and the ground-based Large Binocular Telescope (LBT) in Arizona with near-infrared data from the Wide-Field Infrared Survey Explorer (WISE) and x-ray data from NASA’s Chandra X-ray Observatory.
For the sake of their studies, Satyapal, Ellison, and their respective teams sought to detect dual AGNs, which are believed to be a consequence of galactic mergers. They began by consulting optical data from the SDSS to identify galaxies that appeared to be in the process of merging. Data from the all-sky WISE survey was then used to identify those galaxies that displayed the most powerful AGNs.
They then consulted data from the Chandra’s Advanced CCD Imaging Spectrometer (ACIS) and the LBT to identify seven galaxies that appeared to be in an advanced stage of merger. The study led by Ellison also relied on optical data provided by the Mapping Nearby Galaxies at Apache Point Observatory (MaNGA) survey to pinpoint one of the new black hole pairs.
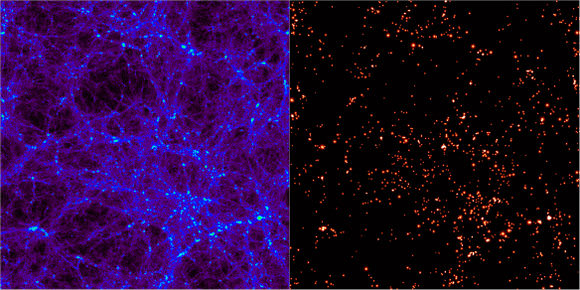
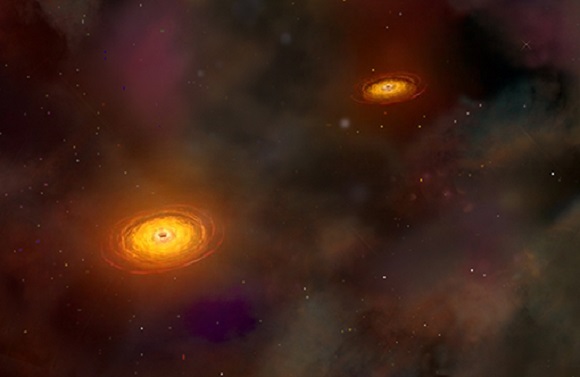
From the combined data, they found that five out of the seven merging galaxies hosted possible dual AGNs, which were separated by less than 10 kiloparsecs (over 30,000 light years). This was evidenced by the infrared data provided by WISE, which was consistent with what is predicated of rapidly growing supermassive black holes.
In addition, the Chandra data showed closely-separated pairs of x-ray sources, which is also consistent with black holes that have matter slowly being accreted onto them. This infrared and x-ray data also suggested that the supermassive black holes are buried in large amounts of dust and gas. As Ellison indicated, these findings were the result of painstaking work that consisted of sorting through multiple wavelengths of data:
“Our work shows that combining the infrared selection with X-ray follow-up is a very effective way to find these black hole pairs. X-rays and infrared radiation are able to penetrate the obscuring clouds of gas and dust surrounding these black hole pairs, and Chandra’s sharp vision is needed to separate them”.

Before this study, less than ten pairs of growing black holes had been confirmed based on X-ray studies, and these were mostly by chance. This latest work, which detected five black hole pairs using combined data, was therefore both fortunate and significant. Aside from bolstering the hypothesis that supermassive black holes form from the merger of smaller black holes, these studies also have serious implications for gravitational wave research.
“It is important to understand how common supermassive black hole pairs are, to help in predicting the signals for gravitational wave observatories,” said Satyapa. “With experiments already in place and future ones coming online, this is an exciting time to be researching merging black holes. We are in the early stages of a new era in exploring the universe.”
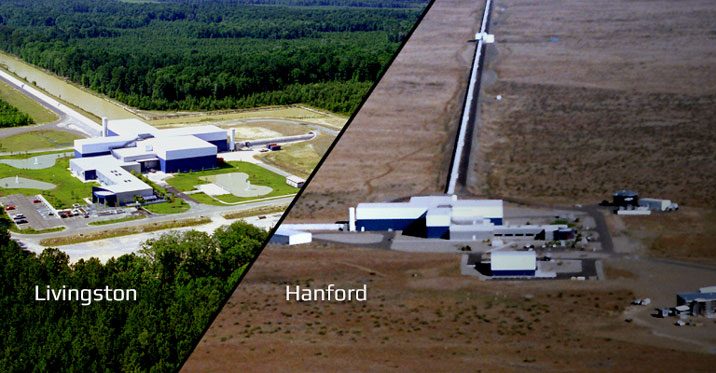
Since 2016, a total of four instances of gravitational waves have been detected by instruments like the Laser Interferometer Gravitational-Wave Observatory (LIGO) and the VIRGO Observatory. However, these detections were the result of black hole mergers where the black holes were all smaller and less massive – between eight and 36 Solar masses.
Supermassive Black Holes, on the other hand, are much more massive and will likely produce a much larger gravitational wave signature as they continue to draw closer together. And in a few hundred million years, when these pairs eventually do merge, the resulting energy produced by mass being converted into gravitational waves will be incredible.

At present, detectors like LIGO and Virgo are not able to detect the gravitational waves created by Supermassive Black Hole pairs. This work is being done by arrays like the North American Nanohertz Observatory for Gravitational Waves (NANOGrav), which relies on high-precision millisecond pulsars to measure the influence of gravitational waves on space-time.
The proposed Laser Interferometer Space Antenna (LISA), which will be the first dedicated space-based gravitational wave detector, is also expected to help in the search. In the meantime, gravitational wave research has already benefited immensely from collaborative efforts like the one that exists between Advanced LIGO and Advanced Virgo.
In the future, scientists also anticipate that they will be able to study the interiors of supernovae through gravitational wave research. This is likely to reveal a great deal about the mechanisms behind black hole formation. Between all of these ongoing efforts and future developments, we can expect to “hear” a great deal more of the Universe and the most powerful forces at work within it.
Be sure to check out this animation that shows what the eventual merger of two of these black hole pairs will look like, courtesy of the Chandra X-ray Observatory:
Further Reading: Chandra Harvard, arXiv, MNRAS