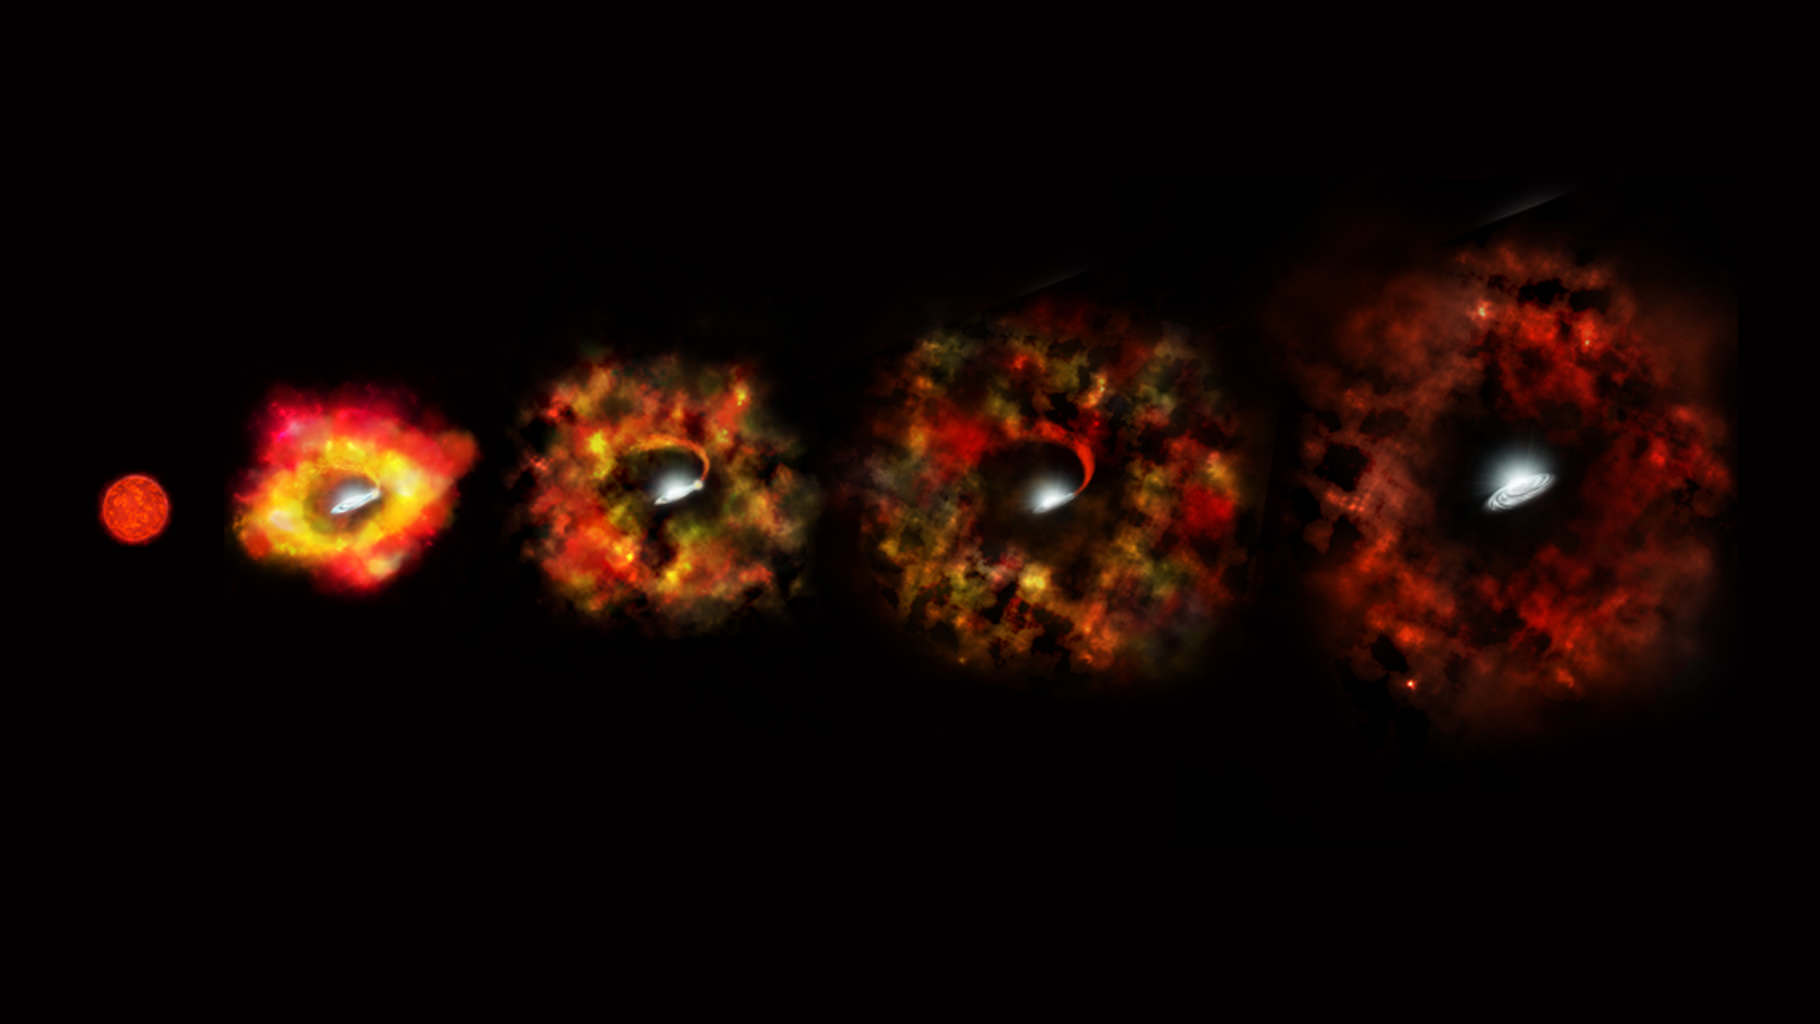
This illustration shows the final stages in the life of a supermassive star that fails to explode as a supernova, but instead implodes to form a black hole. Credit: NASA/ESA/P. Jeffries (STScI)
Collapsing stars are a rare thing to witness. And when astronomers are able to catch a star in the final phase of its evolution, it is a veritable feast for the senses. Ordinarily, this process consists of a star undergoing gravitational collapse after it has exhausted all of its fuel, and shedding its outer layers in a massive explosion (aka. a supernova). However, sometimes, stars can form black holes without the preceding massive explosion.
This process, what might be described as “going out not with a bang, but with a whimper”, is what a team of astronomers witnessed when observing N6946-BH1 – a star located in the Fireworks Galaxy (NGC 6946). Originally, astronomers thought that this star would exploded because of its significant mass. But instead, the star simply fizzled out, leaving behind a black hole.
The Fireworks Galaxy, a spiral galaxy located 22 million light-years from Earth, is so-named because supernova are known to be a frequent occurrence there. In fact, earlier this month, an amateur astronomer spotted what is now designated as SN 2017eaw. As such, three astronomers from Ohio Sate University (who are co-authors on the study) were expecting N6946-BH1 would go supernova when in 2009, it began to brighten.
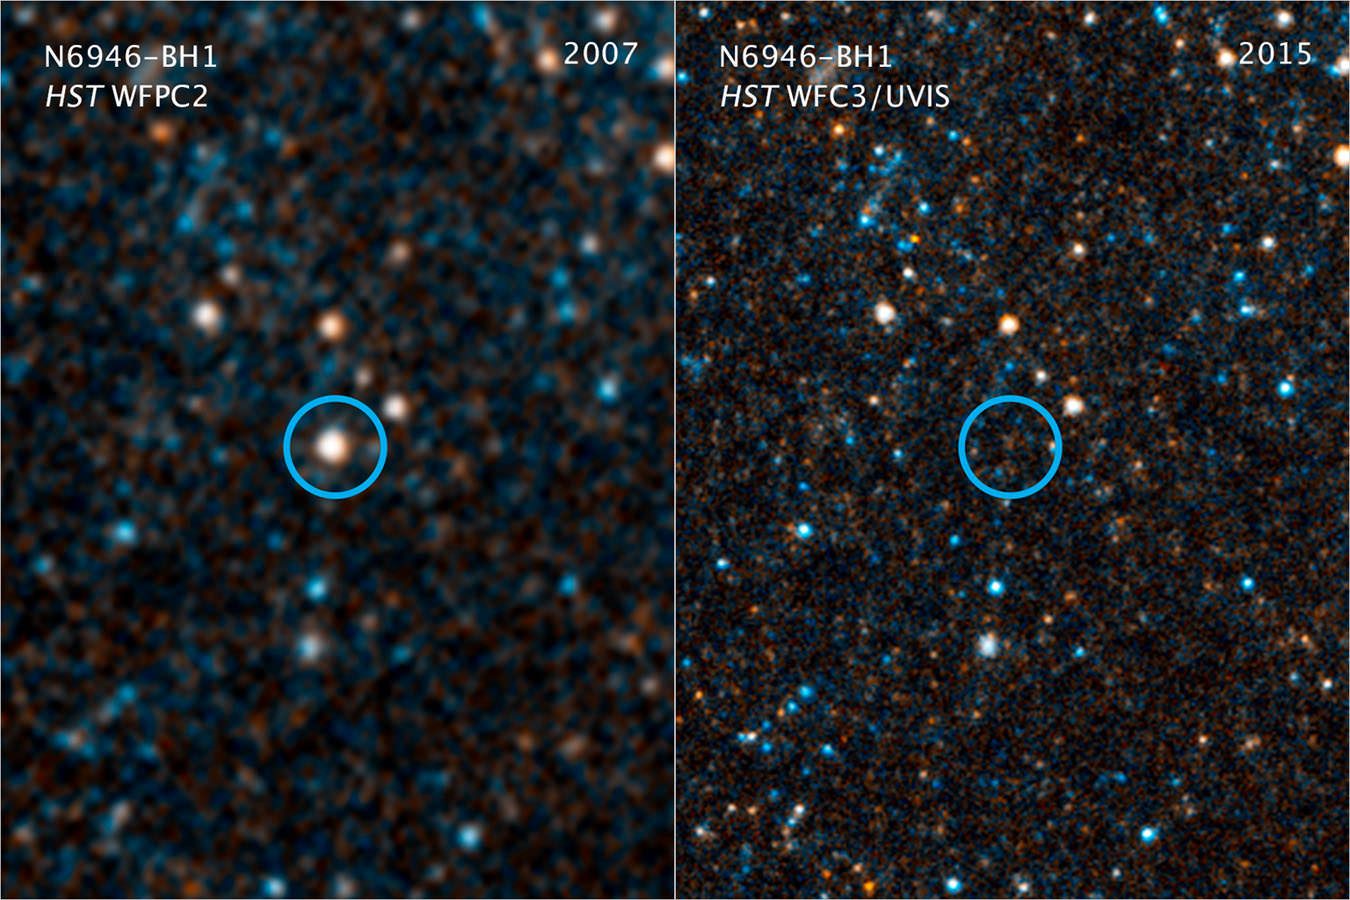
Visible-light and near-infrared photos from NASA’s Hubble Space Telescope showing the giant star N6946-BH1 before and after it vanished out of sight by imploding to form a black hole. Credit: NASA/ESA/C. Kochanek (OSU)
However, by 2015, it appeared to have winked out. As such, the team went looking for the remnants of it with the help of colleagues from Ohio State University and the University of Oklahoma. Using the combined power of the Large Binocular Telescope (LBT) and NASA’s Hubble and Spitzer space telescopes, they realized that the star had completely disappeared from sight.
After it experienced a weak optical outburst in 2009, they had anticipated that this red supergiant would go supernova – which seemed logical given that it was 25 times as massive as our Sun. After winking out in 2015, they had expected to find that the star had merely dimmed, or that it had cast off a dusty shell of material that was obscuring its light from view.
Their efforts included an LBT survey for failed supernovae, which they combined with infrared spectra obtained by the Spitzer Space Telescope and optical data from Hubble. However, all the surveys turned up negative, which led them to only one possible conclusion: that N6946-BH1 must have failed to go supernova and instead went straight to forming a blackhole.
Simulated view of a black hole. Credit: Bronzwaer/Davelaar/Moscibrodzka/Falcke, Radboud University
As Scott Adams – a former Ohio State student who is now an astrophysicist at the Cahill Center for Astrophysics (and the lead author of the study) – explained in a NASA press release:
“N6946-BH1 is the only likely failed supernova that we found in the first seven years of our survey. During this period, six normal supernovae have occurred within the galaxies we’ve been monitoring, suggesting that 10 to 30 percent of massive stars die as failed supernovae. This is just the fraction that would explain the very problem that motivated us to start the survey, that is, that there are fewer observed supernovae than should be occurring if all massive stars die that way.”
A major implication of this study is the way it could shed new light on the formation of very massive black holes. For some time now, astronomers have believed that in order to form a black hole at the end of its life cycle, a star would have to be massive enough to cause a supernova. But as the team observed, it doesn’t make sense that a star would blow off its outer layers and still have enough mass left over to form a massive black hole.
As Christopher Kochanek – a professor of astronomy at The Ohio State University, the Ohio Eminent Scholar in Observational Cosmology and a co-author of the team’s study – explained:
“The typical view is that a star can form a black hole only after it goes supernova. If a star can fall short of a supernova and still make a black hole, that would help to explain why we don’t see supernovae from the most massive stars.”
This information is also important as far as the study of gravitational waves goes. In February of 2016, scientists at the Laser Interferometer Gravitational-wave Observatory (LIGO) announced the first detection of this strange phenomena, which were apparently generated by a massive black hole. If in fact massive black holes form from failed supernova, it would help astronomers to track down the sources more easily.
Be sure to check out this video of the observations made of this failed SN and black hole:
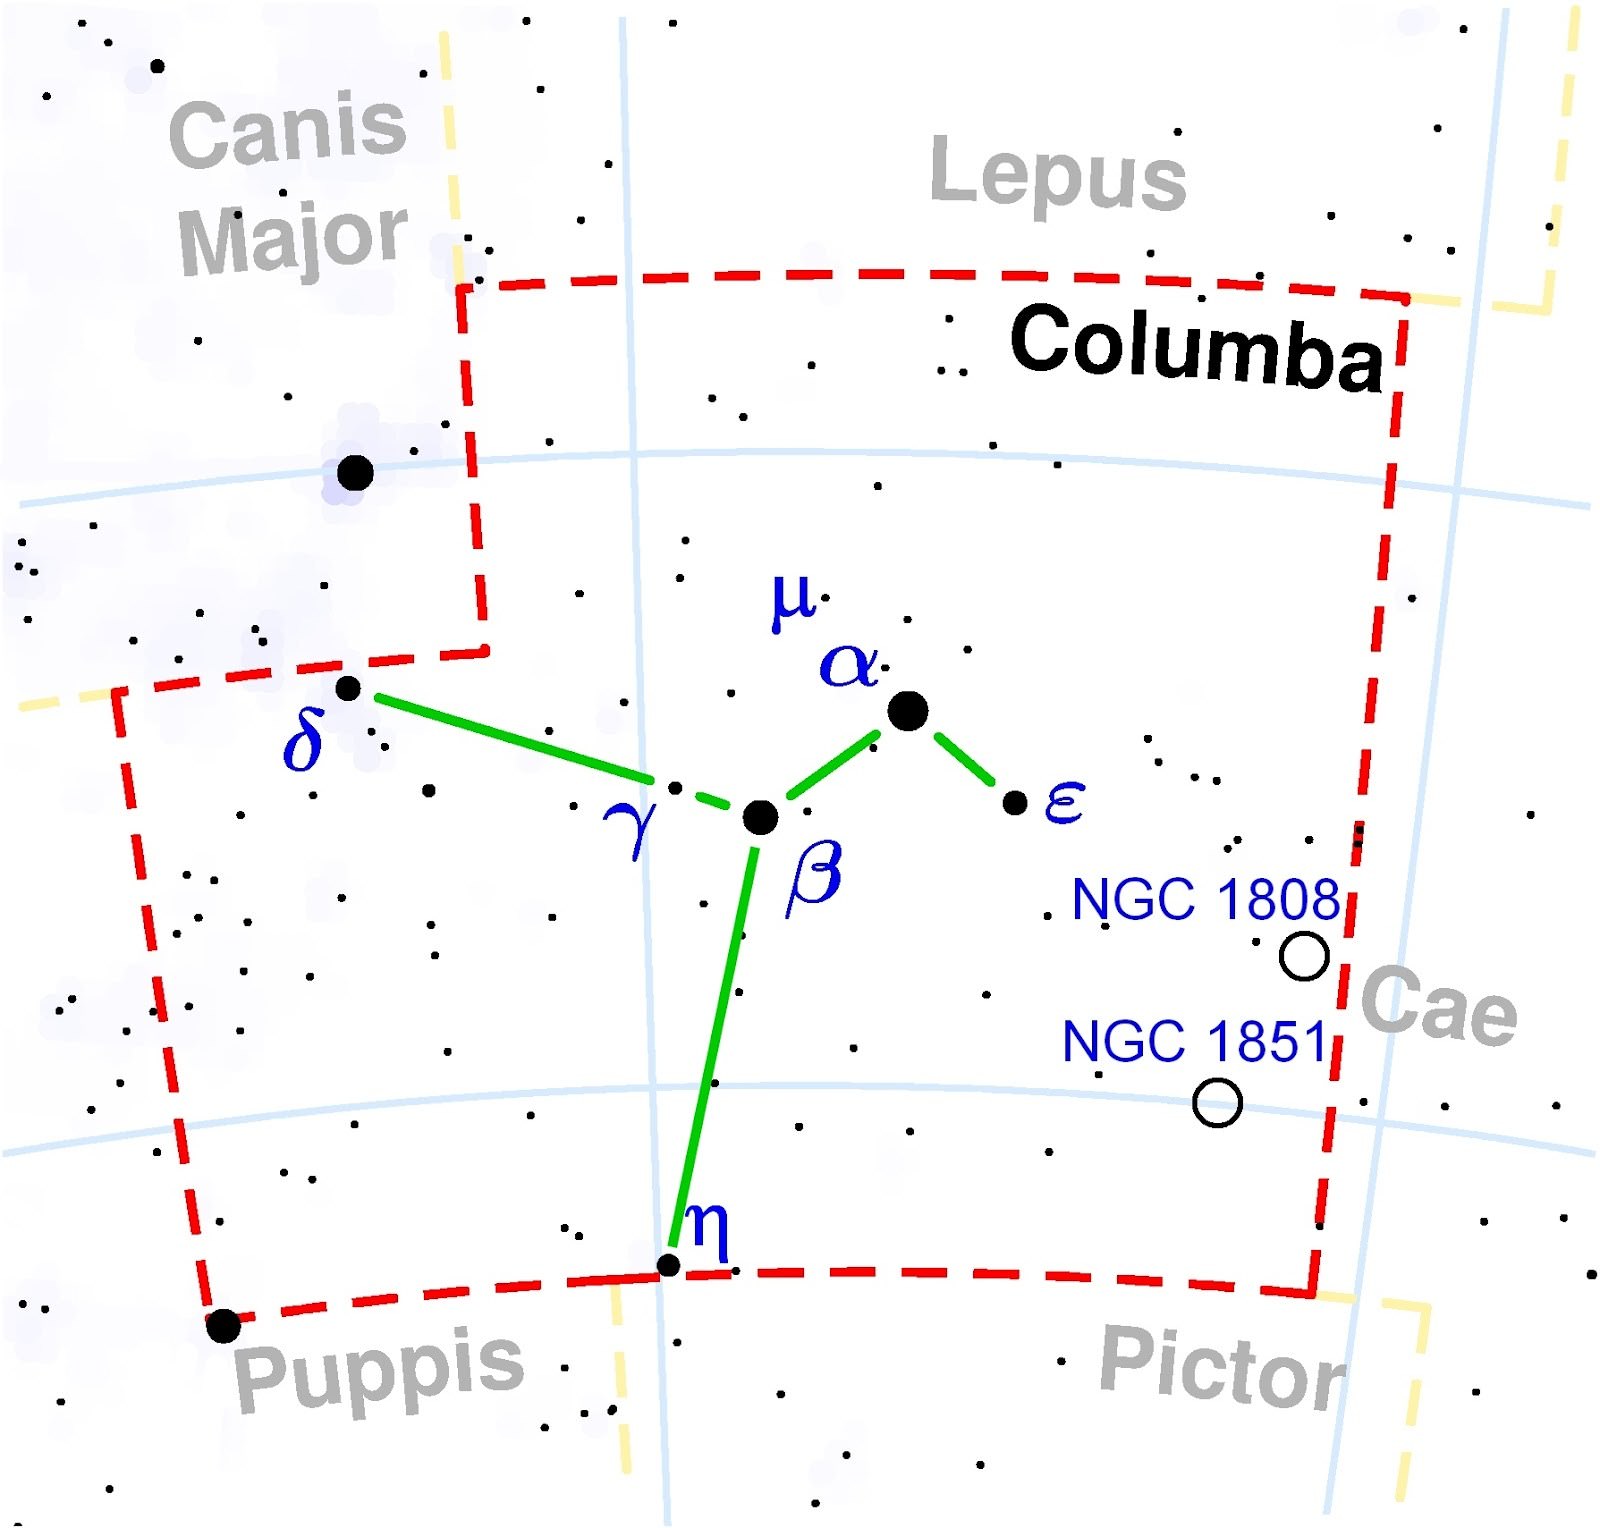
The southern constellation Columba. Credit: Torsten Bronger
Welcome back to Constellation Friday! Today, in honor of the late and great Tammy Plotner, we will be dealing with the dove – the Columba constellation!
In the 2nd century CE, Greek-Egyptian astronomer Claudius Ptolemaeus (aka. Ptolemy) compiled a list of all the then-known 48 constellations. This treatise, known as the Almagest, would be used by medieval European and Islamic scholars for over a thousand years to come, effectively becoming astrological and astronomical canon until the early Modern Age.
Since then, thanks to the efforts of astronomer and explorers, many more constellations have come to be recognized. One of these is the constellation Columba (also known as “the dove”), which was discovered in the 16th century. Located in the southern hemisphere, this small constellation is bordered by the constellations of Caelum, Canis Major, Lepus, Pictor, and Puppis.
Name and Meaning:
Since Columba was unknown to the ancient Greeks and Romans, no mythlogy is associated with it, but its original name was Columba Noachi, which refers to the Torah’s and Bible’s Dove of Noah that was the first bird to find land after the Deluge.
It could also belong to the story of Argo, where a dove was sent out to lead the Argonauts to safety between the clashing rocks. The legend of the dove is supported by the brightest star in the constellation – Alpha – whose name is Phact, Arabic for “ring dove”.
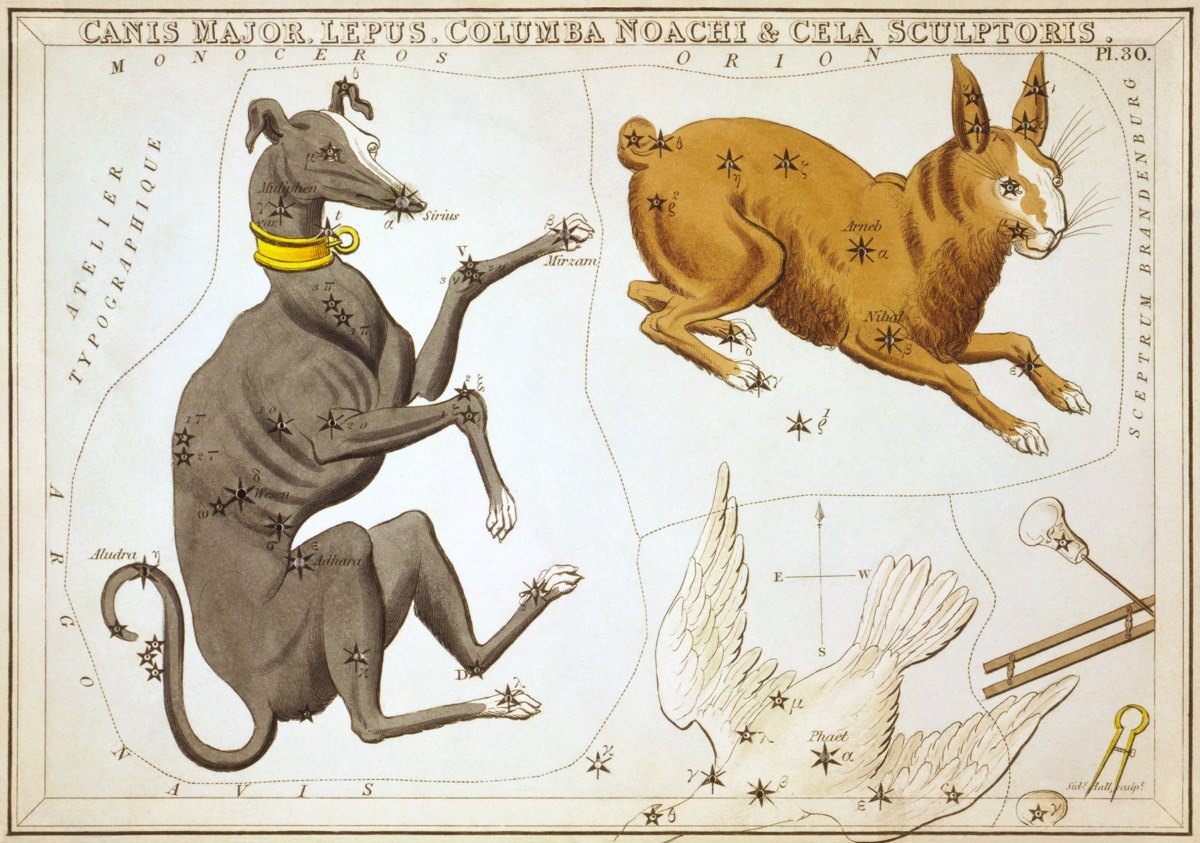
The constellation seen as “Columba Noachi” in Urania’s Mirror (1825). Credit: US Library of Congress/Wikipedia Commons
History of Observation:
Columba first appeared on the constellation charts of Petrus Plancius – a sixteen century Dutch astronomer and cartographer. In 1589, he created a celestial globe using what little information he could gather from the times explorers to help “fill in” the blank area around the south celestial pole.
Columba was then introduced into a large wall map of the constellations in 1592 and later included in Johann Bayer’s Uranometria sky atlas. In 1920, it was included among the 88 constellations recognized by the IAU, where it has remained to this day.
Notable Objects:
Columba has several major stars associated with it. The brightest is Alpha Columbae (aka. Phact), which is located approximately 270 light years from Earth. Phact is a double star that belongs to the spectral class B7IVe, and is omposed of a Be-type subgiant and a faint companion star. Its name is derived from the Arabic world Al-Fakhita, which means “the dove”.
Beta Columbae (aka. Wezn) is the second brightest star in the constellation, a giant K1-type star located 86 light years from Earth. It’s name is derived from the Arabic word Al-Wazen, which means “the weight”. Third is Delta Columbae (aka. Ghusn al Zaitun), a spectroscopic binary that is located approximately 237 light years away. Its name is derived from the Arabic phrase al-ghasn alzzaytun, which means “olive branch.”
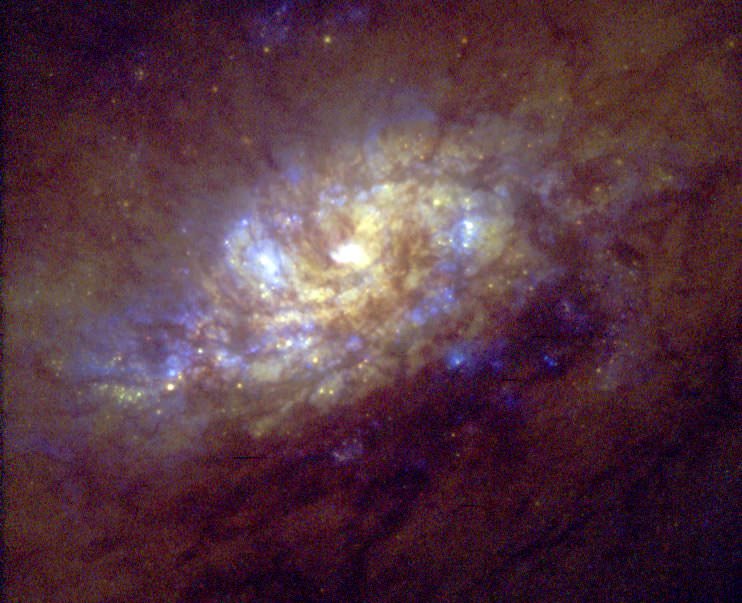
The barred spiral galaxy NGC 1808. Credit: Jim Flood (Amateur Astronomers Inc., Sperry Observatory), Max Mutchler (STScI)
Columba is also home to several Deep Sky Objects. There’s NGC 1808, a barred spiral galaxy that is located approximately 40 million light years from Earth. Similar in many ways to the Milky Way, this galaxy has an unusual nuclear which is shaped like a warped disk and is believed to have a lot of star-forming activity within it.
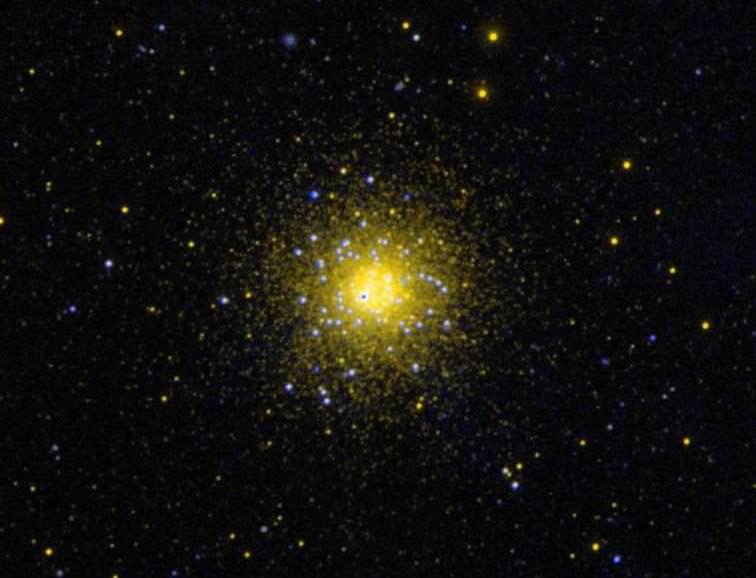
There’s also NGC 1851 (aka. Caldwell 73), is a globular cluster located approximately 39,500 light years away, and NGC 1792, a starburst spiral galaxy that also goes by the name Bulliens Columbae (or the “bubbling galaxy”). This is due to its appearance, which is characterized by the patchy distribution of dust throughout the galaxy and the way this dust is heated by young stars.
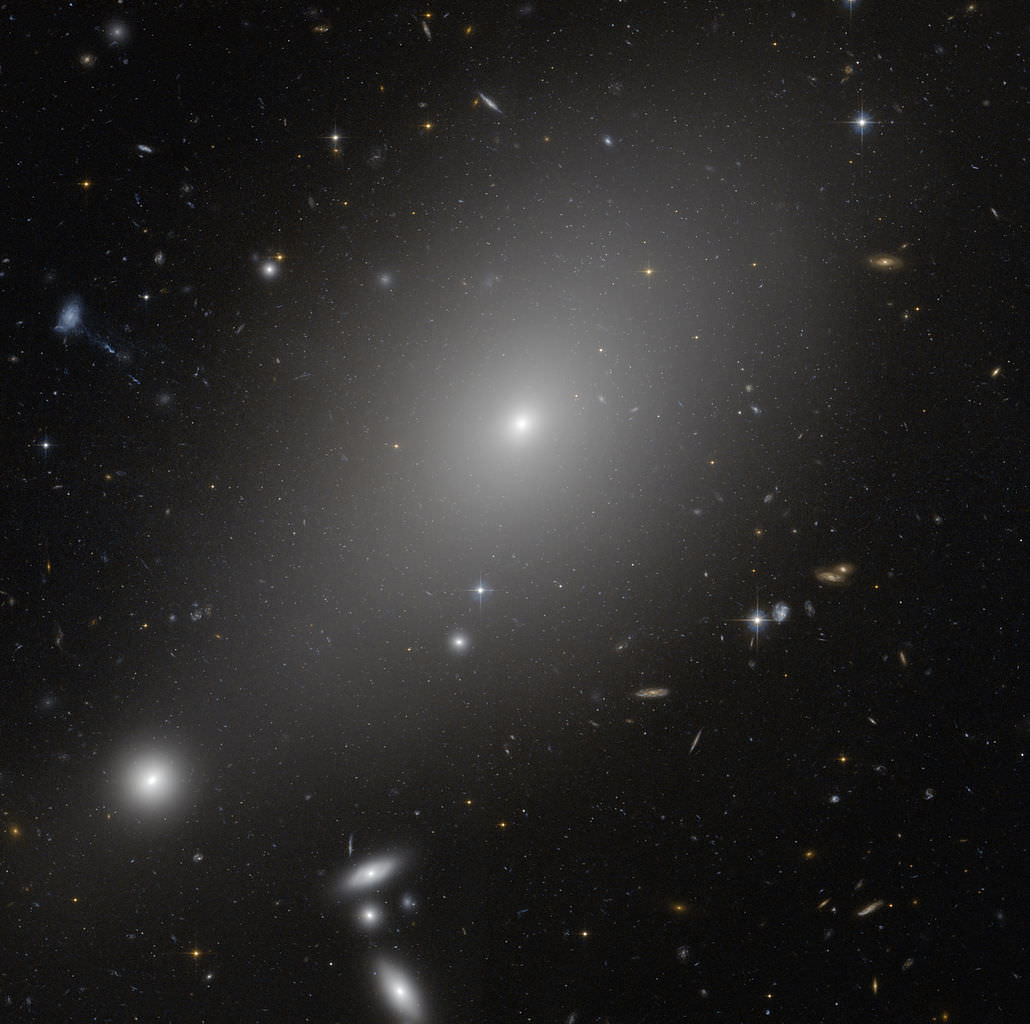
Last, there’s ESO 306-17, a fossil group giant elliptical galaxy that is located at a distance of about 493 million light years from Earth. The galaxy spans about 1 million light years in diameter and is believed to have cannibalized smaller galaxies in its neighbourhood. Hence why it is designated as a fossil group, which refers to the fact that it is believed to be the end-result of a galaxy colliding and merging with a regular galaxy group.
Finding Columba:
Columba consists of 1 bright star and 5 primary stars, with 18 Bayer/Flamsteed designated stellar members. It is bordered by the constellations of Lepus, Caelum, Pictor, Puppis and Canis Major. Columba is easily visible to viewers at latitudes between +45° and -90° and is best seen at culmination during the month of February.
The globular cluster NGC 1851. Credit: NASA, JPL-Caltech, SSC
Get out your telescope and take a look at Alpha Columbae – the A symbol on the map. Here we have a a subgiant star – a star that has just stopped fusing hydrogen to helium – with an an apparent magnitude of approximately 2.6. Located about 268 light years from Earth, Phact is spinning rapidly… at a speed of at least 180 kilometers per second at its equator.
That’s over 90 times faster than our Sun! This rapid rotation causes Phact to flatten at its poles and to spin off a low density envelope about twice its radius. Now, look closely you’ll see that Phact is actually a binary star system. Its faint companion has an apparent magnitude of 12.3 and is 13.5″ distant from the main star.
Now aim binoculars at Beta Columbae – the B symbol on the map. Its proper name is Wazn the “Weight”. If you don’t think there is anything particularly interesting about this 86 light-year distant, spectral class K1IIICN+1, 3.12 magnitude star, then you better think again. This calm looking, core helium fusing giant star might be a little on the small side as giant stars go, but it is about 12 times the size of our own Sun and shines 53 times brighter.
Of course, that’s not all that unusual either. Nor is the fact that Wazn is about 2 billion years old. What is really strange is that Beta Columbae is scooting along through space at a speed of 103 kilometers per second. That’s about six to seven time faster than what’s considered “normal”! Why? It’s a runaway star, just like Mu Columbae.
Turn your binoculars toward the U symbol on the map and have a look. At 1,300 light years from our solar system, Mu is one of the few O-class stars that is visible to the unaided eye. Like Phact, Mu is a relatively fast rotating star that completes a full revolution approximately every 1.5 days.
Colour composite image of the starburst spiral galaxy NGC 1792. Credit: ESO
But Mu is also like Wazn – speeding along at relative velocity of over 200 km/s. Just where did these these two “runaways” come from? Chances are Wazn came from the other side of the Milky Way, while Mu may have originated from a binary star collision in Orion. Catch them while they’re still there!
Now aim your binoculars or telescopes at 7th magnitude globular cluster, NGC 1851 (RA 5 14 6.7 Dec -40 2 48). This Class II beauty was discovered by James Dunlop on May 29, 1826 and cataloged as Dunlop 508. What you’ll find is a very rich, almost impenetrable core surrounded by a nice halo of resolvable stars in a delightful field.
NGC 1851 has two distinct stellar populations with very different initial metal mixtures: a normal alpha-enhanced component, and one characterized by strong anti correlations among the CNONa abundances. Known in the Caldwell Catalog as Object 73, this fine object does well in all aperture sizes – even to Dunlop who almost 200 years ago wrote:
“An exceedingly bright, round, well-defined nebula, about 1.5′ diameter, exceedingly condensed, almost to the very margin. This is the brightest small nebula that I have seen. I tried several magnifying powers on this beautiful globe; a considerable portion round the margin is resolvable, but the compression to the centre is so great that I cannot reasonably expect to separate the stars. I compared this with the 68 Conn. des Temps, and this nebula greatly exceeds the 68 in condensation and brightness.”
Image of ESO 306-17, taken by the Advanced Camera for Surveys aboard the NASA/ESA Hubble Space Telescope. Credit: NASA/ESA/Michael West (ESO)
For a telescope challenge, try NGC 1792 (RA 05 05.2 Dec -37 59). Despite being billed at slightly fainter than magnitude 10, you’ll find the surface brightness of this spiral galaxy a little more in need of larger aperture. Noted as a starburst galaxy, NGC 1792 has a patchy distribution of dust throughout the galactic disc. The galaxy itself is abundant in neutral hydrogen gas and is in the star formation process.
The galaxy is characterized by unusually luminous far-infrared radiation from the young stars heating the dust with their intense activity. This activity could be caused by gravitational interaction with galaxy NGC 1808 (RA 5 7 42.3 Dec -37 30 47) – also a Seyfert galaxy. Easily seen in larger telescopes as an elongated glow, with a bright, round central core. There’s a reason for that…
The barred spiral galaxy NGC 1808 is undergoing an episode of intense star formation near its very center, perhaps triggered by rotation of the bar or by material transported inward along the bar. This new star formation is somehow being organized into clusters of between 10 and 100 light years in diameter, and filaments of dark, obscuring dust are mixed in with the gas and stars.
Thanks to studies done with the XMM-Newton and Chandra observatories, they have directly proved the co-existence of thermal diffuse plasma and non-nuclear unresolved point-like sources associated with the starburst activity, along with a Low Luminosity Active Galactic Nucleus (LLAGN) or an Ultra Luminous X-ray source (ULX). What a show!
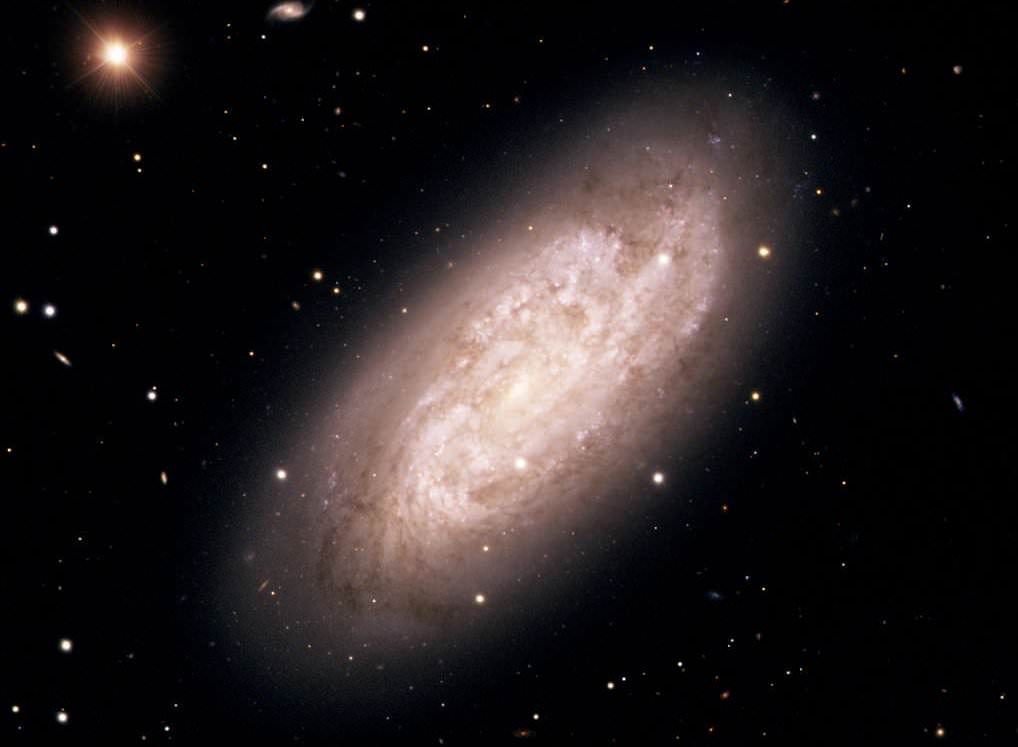
Now try your luck with galactic star cluster NGC 1963 (RA 05 32.2 Dec -36 23). While it is not a very rich and populous star cluster, it is an interesting stellar association of perhaps two dozen stars arranged in chains over a wide field with a size of 10.0′. Look for an asterism that appears like the number 3!
Freeze-dried mice sperm that spent nine months in space aboard the iSS were sucessfully used to create healthy offspring. Credit: Sayaka Wakayama/University of Yamanashi via AP
With proposed missions to Mars and plans to establish outposts on the Moon in the coming decades, there are several questions about what effects time spent in space or on other planets could have on the human body. Beyond the normal range of questions concerning the effects of radiation and lower-g on our muscles, bones, and organs, there is also the question of how space travel could impact our ability to reproduce.
Earlier this week – on Monday, May 22nd – a team of Japanese researchers announced findings that could shed light on this question. Using a sample of freeze-dried mouse sperm, the team was able to produce a litter of healthy baby mice. As part of a fertility study, the mouse sperm had spent nine months aboard the International Space Station (between 2013 and 2014). The real question now is, can the same be done for human babies?
The study was led by Sayaka Wakayama, a student researcher at the University of Yamanashi‘s Advanced Biotechnology Center. As she and her colleagues explain in their study – which was recently published in the Proceedings of the National Academy of Sciences – assisted reproductive technology will be needed if humanity ever intends to live in space long-term.
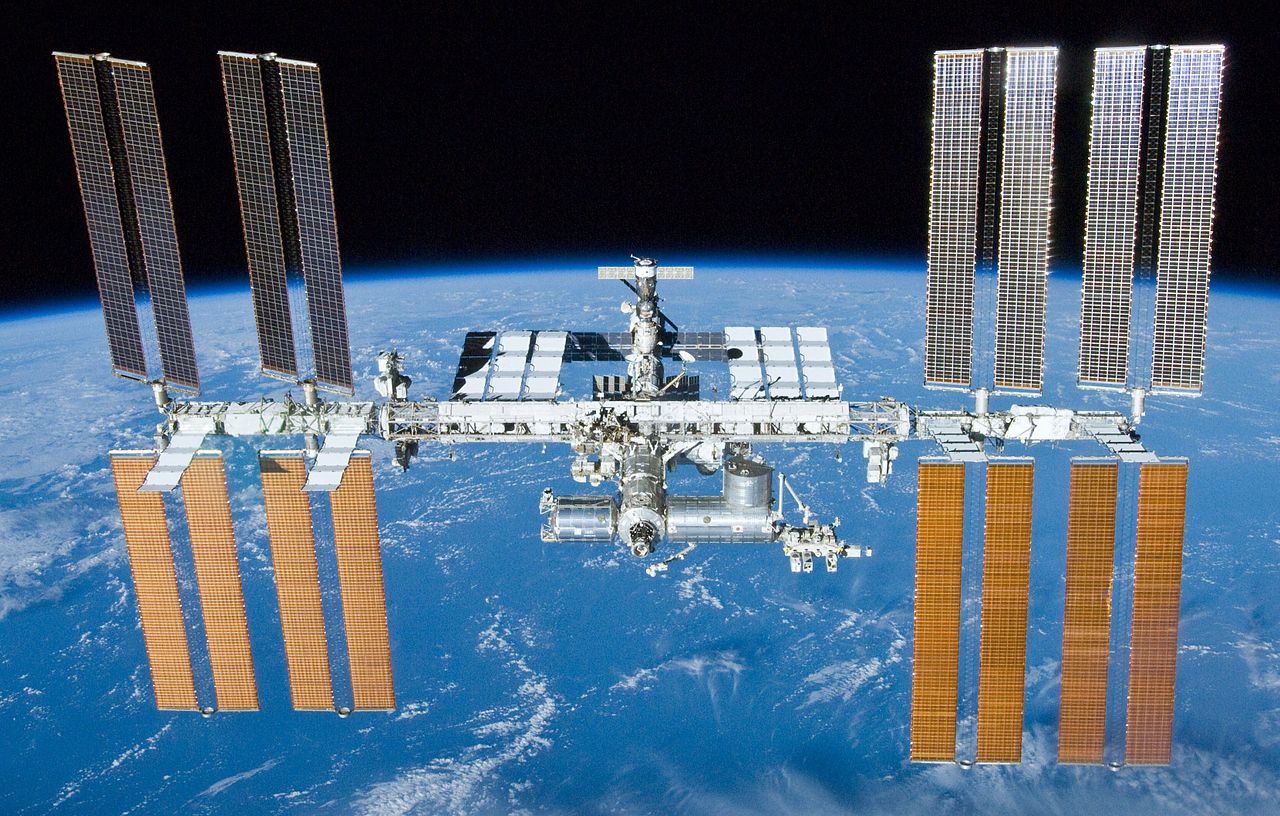
The International Space Station (ISS), seen here with Earth as a backdrop. Credit: NASA
As such, studies that address the effect that living in space could have on human reproduction are needed first. These need to address the impact microgravity (or low-gravity) could have on fertility, human abilities to conceive, and the development of children. And more importantly, they need to deal with one of the greatest hazards of spending time in space – which is the threat posed by solar and cosmic radiation.
To be fair, one need not go far to feel the effects of space radiation. The ISS regularly receives more than 100 times the amount of radiation that Earth’s surface does, which can result in genetic damage if sufficient safeguards are not in place. On other Solar bodies – like Mars and the Moon, which do not have a protective magnetosphere – the situation is similar.
And while the effects of radiation on adults has been studied extensively, the potential damage that could be caused to our offspring has not. How might solar and cosmic radiation affect our ability to reproduce, and how might this radiation affect children when they are still in the womb, and once they are born? Hoping to take the first steps in addressing these questions, Wakayama and her colleagues selected the spermatozoa of mice.
They specifically chose mice since they are a mammalian species that reproduces sexually. As Sayaka Wakayama explained Universe Today via email:
“So far, only fish or salamanders were examined for reproduction in space. However, mammalian species are very different compared to those species, such as being born from a mother (viviparity). To know whether mammalian reproduction is possible or not, we must use mammalian species for experiments. However, mammalian species such as mice or rats are very sensitive and difficult to take care of by astronauts aboard the ISS, especially for a reproduction study. Therefore, we [have not conducted these studies] until now. We are planning to do more experiments such as the effect of microgravity for embryo development.”
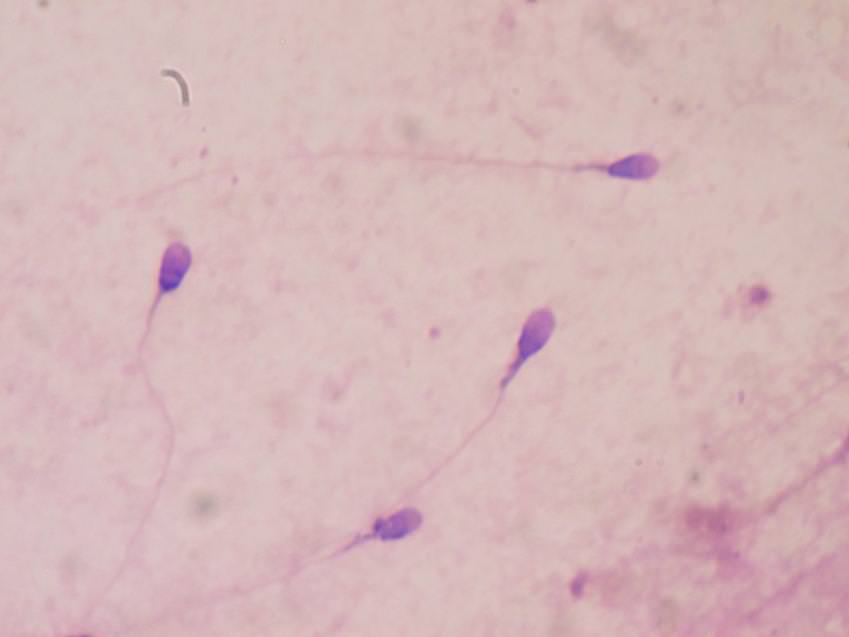
Human sperm stained for semen quality testing in the clinical laboratory. Credit: Bobjgalindo/Wikipedia Commons
The samples spent nine months aboard the ISS, during which time they were kept at a constant temperature of -95 °C (-139 °F). During launch and recovery, however, they were at room temperature. After retrieval, Wakayama and her team found that the samples had suffered some minor damage,.
“Sperm preserved in space had DNA damage even after only 9 months by space radiation,” said Wakayama. “However, that damage was not strong and could be repaired when fertilized by oocytes capacity. Therefore, we could obtain normal, healthy offspring. This suggests to me that we must examine the effect when sperm are preserved for longer periods.”
In addition to being reparable, the sperm samples were still able to fertilize mouse embryos (once they were brought back to Earth) and produce mouse offspring, all of which grew to maturity and showed normal fertility levels. They also noted that the fertilization and birth rates were similar to those of control groups, and that only minor genomic differences existed between those and the mouse created using the test sperm.
From all this, they demonstrated that while exposure to space radiation can damage DNA, it need not affect the production of viable offspring (at least within a nine month period). Moreover, the results indicate that human and domestic animals could be produced from space-preserved spermatozoa, which could be mighty useful when it comes to colonizing space and other planets.
A Pacific pocket mouse pup and its mother appear outside their artificial burrow at the San Diego Zoo. Credit: Ken Bohn/San Diego Zoo/AP
As Wakayama put it, this research builds on fertilization practices already established on Earth, and demonstrated that these same practices could be used in space:
“Our main subject is domestic animal reproduction. In the current situation on the ground, many animals are born from preserves spermatozoa. Especially in Japan, 100% of milk cows were born from preserved sperm due to economic and breeding reasons. Sometimes, sperm that has been stored for more than 10 years was used to produce cows. If humans live in space for many years, then, our results showed that we can eat beefsteak in the space. For that purpose, we did this study. For humans, our finding will probably help infertile couples.”
This research also paves the way for additional tests that would seek to measure the effects of space radiation on ova and the female reproduction system. Not only could these tests tell us a great deal about how time in space could affect female fertility, it could also have serious implications for astronaut safety. As Ulrike Luderer, a professor of medicine at the University of California and one of the co-authors on the paper said in a statement to the AFP:
“These types of exposures can cause early ovarian failure and ovarian cancer, as well as other osteoporosis, cardiovascular disease and neurocognitive diseases like Alzheimer’s. Half the astronauts in the NASA’s new astronaut classes are women. So it is really important to know what chronic health effects there could be for women exposed to long-term deep space radiation.”
Future space colonies could rely on frozen sperm and ova to produce livestock, and maybe even humans. Credit: Rick Guidice/NASA Ames Research Center
However, a lingering issue with these sorts of tests is being able to differentiate between the effects of microgravity and radiation. In the past, research has been conducted that showed how exposure to simulated microgravity can reduce DNA repair capacity and induce DNA damage in humans. Other studies have raised the issue of the interplay between the two, and how further experiments are needed to address the precise impact of each.
In the future, it may be possible to differentiate between the two by placing samples of spermatazoa and ova in a torus that is capable of simulating Earth gravity (1 g). Similarly, shielded modules could be used to isolate the effects of low or even micro-gravity. Beyond that, there will likely be lingering uncertainties until such time as babies are actually born in space, or in a lunar or Martian environment.
And of course, the long-terms impact of reduced gravity and radiation on human evolution remains to be seen. In all likelihood, that won’t become clear for generations to come, and will require multi-generational studies of children born away from Earth to see how they and their progeny differ.
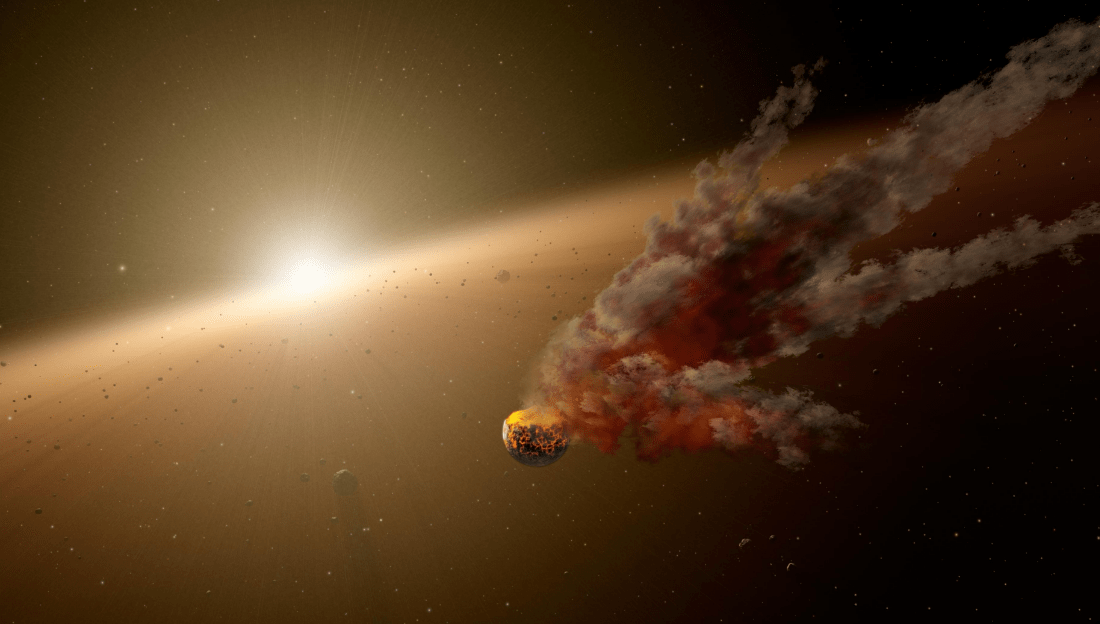
Artist's concept of KIC 8462852, which has experienced unusual changes in luminosity over the past few years. Credit: NASA, JPL-Caltech
KIC 8462852 (aka. Tabby’s Star) captured the world’s attention back in September of 2015 when it was found to be experiencing a mysterious drop in brightness. A week ago (on May 18th), it was announced that the star was at it again, which prompted observatories from all around the world to train their telescopes on the star so they could observe the dimming as it happened.
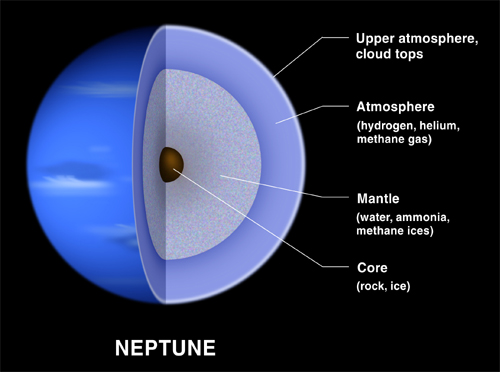
The interior structure of Neptune. Credit: Moscow Institute of Physics and Technology
Since it’s discovery in the mid-19th century, Neptune has consistently been a planet of mystery. As the farthest planet from our Sun, it has only been visited by a single robotic mission. And there are still many unanswered questions about what kind of mechanics power its interior. Nevertheless, what we have learned about the planet in the course of the past few decades is considerable.
For example, thanks to the Voyager 2 probe and multiple surveys using Earth-based instruments, scientists have managed to gain a pretty good understanding of Neptune’s structure and composition. In addition to knowing what makes up its atmosphere, planetary models have also predicted what the interior of the planet looks like. So just what is Neptune made of?
Structure and Composition:
Neptune, like the rest of the gas giant planets in the Solar System, can be broken up into various layers. The composition of Neptune changes depending on which of these layers you’re looking at. The outermost layer of Neptune is the atmosphere, forming about 5-10% of the planet’s mass, and extending up to 20% of the way down to its core.
Composition and interior structure of Neptune. Credit: NASA
Beneath the atmosphere is the planet’s large mantle. This is a superheated liquid region where temperatures can reach as high as 2,000 to 5,000 K (1727 – 4727 °C; 3140 – 8540 °F). The mantle is equivalent to 10 – 15 Earth masses and is rich in water, ammonia and methane. This mixture is referred to as icy even though it is a hot, dense fluid, and is sometimes called a “water-ammonia ocean”.
Increasing concentrations of methane, ammonia and water are found in the lower regions of the atmosphere. Unlike Uranus, Neptune’s composition has a higher volume of ocean, whereas Uranus has a smaller mantle. Like the other gas/ice giants, Neptune is believed to have a solid core, the composition of which is still subject to guesswork. However, the theory that it is rocky and metal-rich is consistent with current theories of planet formation.
In accordance with these theories, the core of Neptune is composed of iron, nickel and silicates, with an interior model giving it a mass about 1.2 times that of Earth. The pressure at the center is estimated to be 7 Mbar (700 GPa), about twice as high as that at the center of Earth, and with temperatures as high as 5,400 K. At a depth of 7000 km, the conditions may be such that methane decomposes into diamond crystals that rain downwards like hailstones.
Due to its smaller size and higher concentrations of volatiles relative to Jupiter and Saturn, Neptune (much like Uranus) is often referred to as an “ice giant” – a subclass of a giant planet. Also like Uranus, Neptune’s internal structure is differentiated between a rocky core consisting of silicates and metals; a mantle consisting of water, ammonia and methane ices; and an atmosphere consisting of hydrogen, helium and methane gas.
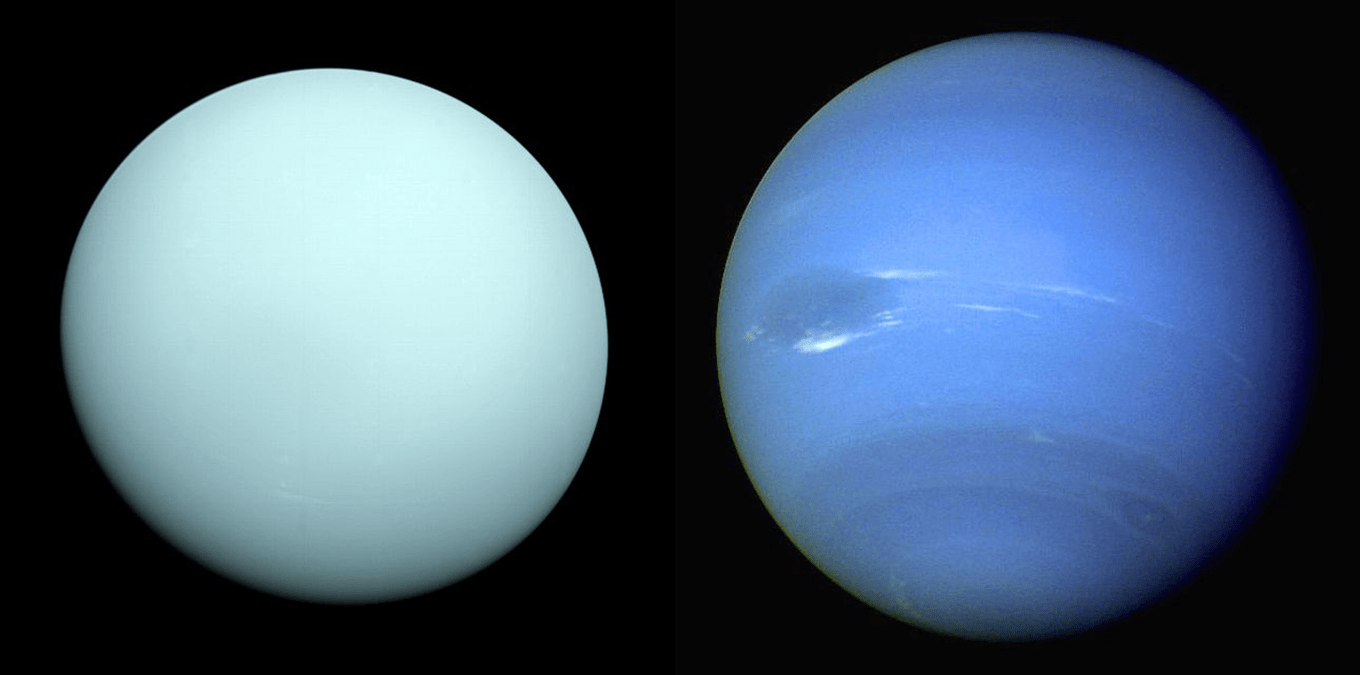
Uranus and Neptune, the Solar System’s ice giant planets. Credit: Wikipedia Commons
Neptune’s Atmosphere:
Neptune’s atmosphere forms about 5% to 10% of its mass and extends perhaps 10% to 20% of the way towards the core, where it reaches pressures of about 10 GPa – or about 100,000 times that of Earth’s atmosphere. At high altitudes, Neptune’s atmosphere is 80% hydrogen and 19% helium, with a trace amount of methane.
As with Uranus, this absorption of red light by the atmospheric methane is part of what gives Neptune its blue hue, although Neptune’s is darker and more vivid. Because Neptune’s atmospheric methane content is similar to that of Uranus, some unknown atmospheric constituent is thought to contribute to Neptune’s more intense coloring.
Neptune’s atmosphere is subdivided into two main regions: the lower troposphere (where temperature decreases with altitude), and the stratosphere (where temperature increases with altitude). The boundary between the two, the tropopause, lies at a pressure of 0.1 bars (10 kPa). The stratosphere then gives way to the thermosphere at a pressure lower than 10-5 to 10-4 microbars (1 to 10 Pa), which gradually transitions to the exosphere.
Neptune’s spectra suggest that its lower stratosphere is hazy due to condensation of products caused by the interaction of ultraviolet radiation and methane (i.e. photolysis), which produces compounds such as ethane and ethyne. The stratosphere is also home to trace amounts of carbon monoxide and hydrogen cyanide, which are responsible for Neptune’s stratosphere being warmer than that of Uranus.
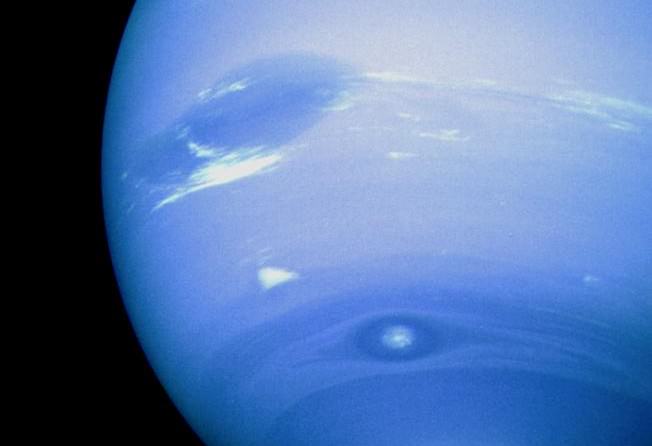
Color and contrast-modified image that emphasizes Neptune’s atmospheric features. Neptune’s Great Dark Spot stands out as the most prominent feature on the left. Credit: Erich Karkoschka
For reasons that remain obscure, the planet’s thermosphere experiences unusually high temperatures of about 750 K (476.85 °C/890 °F). The planet is too far from the Sun for this heat to be generated by ultraviolet radiation, which means another heating mechanism is involved – which could be the atmosphere’s interaction with ion’s in the planet’s magnetic field, or gravity waves from the planet’s interior that dissipate in the atmosphere.
Because Neptune is not a solid body, its atmosphere undergoes differential rotation. The wide equatorial zone rotates with a period of about 18 hours, which is slower than the 16.1-hour rotation of the planet’s magnetic field. By contrast, the reverse is true for the polar regions where the rotation period is 12 hours.
This differential rotation is the most pronounced of any planet in the Solar System, and results in strong latitudinal wind shear and violent storms. The three most impressive were all spotted in 1989 by the Voyager 2 space probe, and then named based on their appearances.
The first to be spotted was a massive anticyclonic storm measuring 13,000 x 6,600 km and resembling the Great Red Spot of Jupiter. Known as the Great Dark Spot, this storm was not spotted five later (Nov. 2nd, 1994) when the Hubble Space Telescope looked for it. Instead, a new storm that was very similar in appearance was found in the planet’s northern hemisphere, suggesting that these storms have a shorter life span than Jupiter’s.
Reconstruction of Voyager 2 images showing the Great Black spot (top left), Scooter (middle), and the Small Black Spot (lower right). Credit: NASA/JPL
The Scooter is another storm, a white cloud group located farther south than the Great Dark Spot. This nickname first arose during the months leading up to the Voyager 2 encounter in 1989, when the cloud group was observed moving at speeds faster than the Great Dark Spot.
The Small Dark Spot, a southern cyclonic storm, was the second-most-intense storm observed during the 1989 encounter. It was initially completely dark; but as Voyager 2 approached the planet, a bright core developed and could be seen in most of the highest-resolution images.
Exploration:
The Voyager 2 probe is the only spacecraft to have ever visited Neptune. The spacecraft’s closest approach to the planet occurred on August 25th, 1989, which took place at a distance of 4,800 km (3,000 miles) above Neptune’s north pole. Because this was the last major planet the spacecraft could visit, it was decided to make a close flyby of the moon Triton – similar to what had been done for Voyager 1‘s encounter with Saturn and its moon Titan.
The spacecraft performed a near-encounter with the moon Nereid before it came to within 4,400 km of Neptune’s atmosphere on August 25th, then passed close to the planet’s largest moon Triton later the same day. The spacecraft verified the existence of a magnetic field surrounding the planet and discovered that the field was offset from the center and tilted in a manner similar to the field around Uranus.
Neptune’s rotation period was determined using measurements of radio emissions and Voyager 2 also showed that Neptune had a surprisingly active weather system. Six new moons were discovered during the flyby, and the planet was shown to have more than one ring.
While no missions to Neptune are currently being planned, some hypothetical missions have been suggested. For instance, a possible Flagship Mission has been envisioned by NASA to take place sometime during the late 2020s or early 2030s. Other proposals include a possible Cassini-Huygens-style “Neptune Orbiter with Probes”, which was suggested back in 2003.
Another, more recent proposal by NASA was for Argo – a flyby spacecraft that would be launched in 2019, which would visit Jupiter, Saturn, Neptune, and a Kuiper belt object. The focus would be on Neptune and its largest moon Triton, which would be investigated around 2029.
Given its distance from Earth, it is no secret why the Trans-Neptunian region remains mysterious to us. In the coming decades, several proposed missions are expected to travel there and explore its rich population of icy bodies and the giant planet for which it is named. From these studies, we are likely to learn a great deal about Neptune and the history of the Solar System.
An artist’s conception shows the planet TRAPPIST-1h. (NASA / JPL-Caltech)
The announcement of a seven-planet system around the star TRAPPIST-1 earlier this year set off a flurry of scientific interest. Not only was this one of the largest batches of planets to be discovered around a single star, the fact that all seven were shown to be terrestrial (rocky) in nature was highly encouraging. Even more encouraging was the fact that three of these planets were found to be orbiting with the star’s habitable zone.
Since that time, astronomers have been seeking to learn all they can about this system of planets. Aside from whether or not they have atmospheres, astronomers are also looking to learn more about their orbits and surface conditions. Thanks to the efforts of a University of Washington-led international team of astronomers, we now have an accurate idea of what conditions might be like on its outermost planet – TRAPPIST-1h.
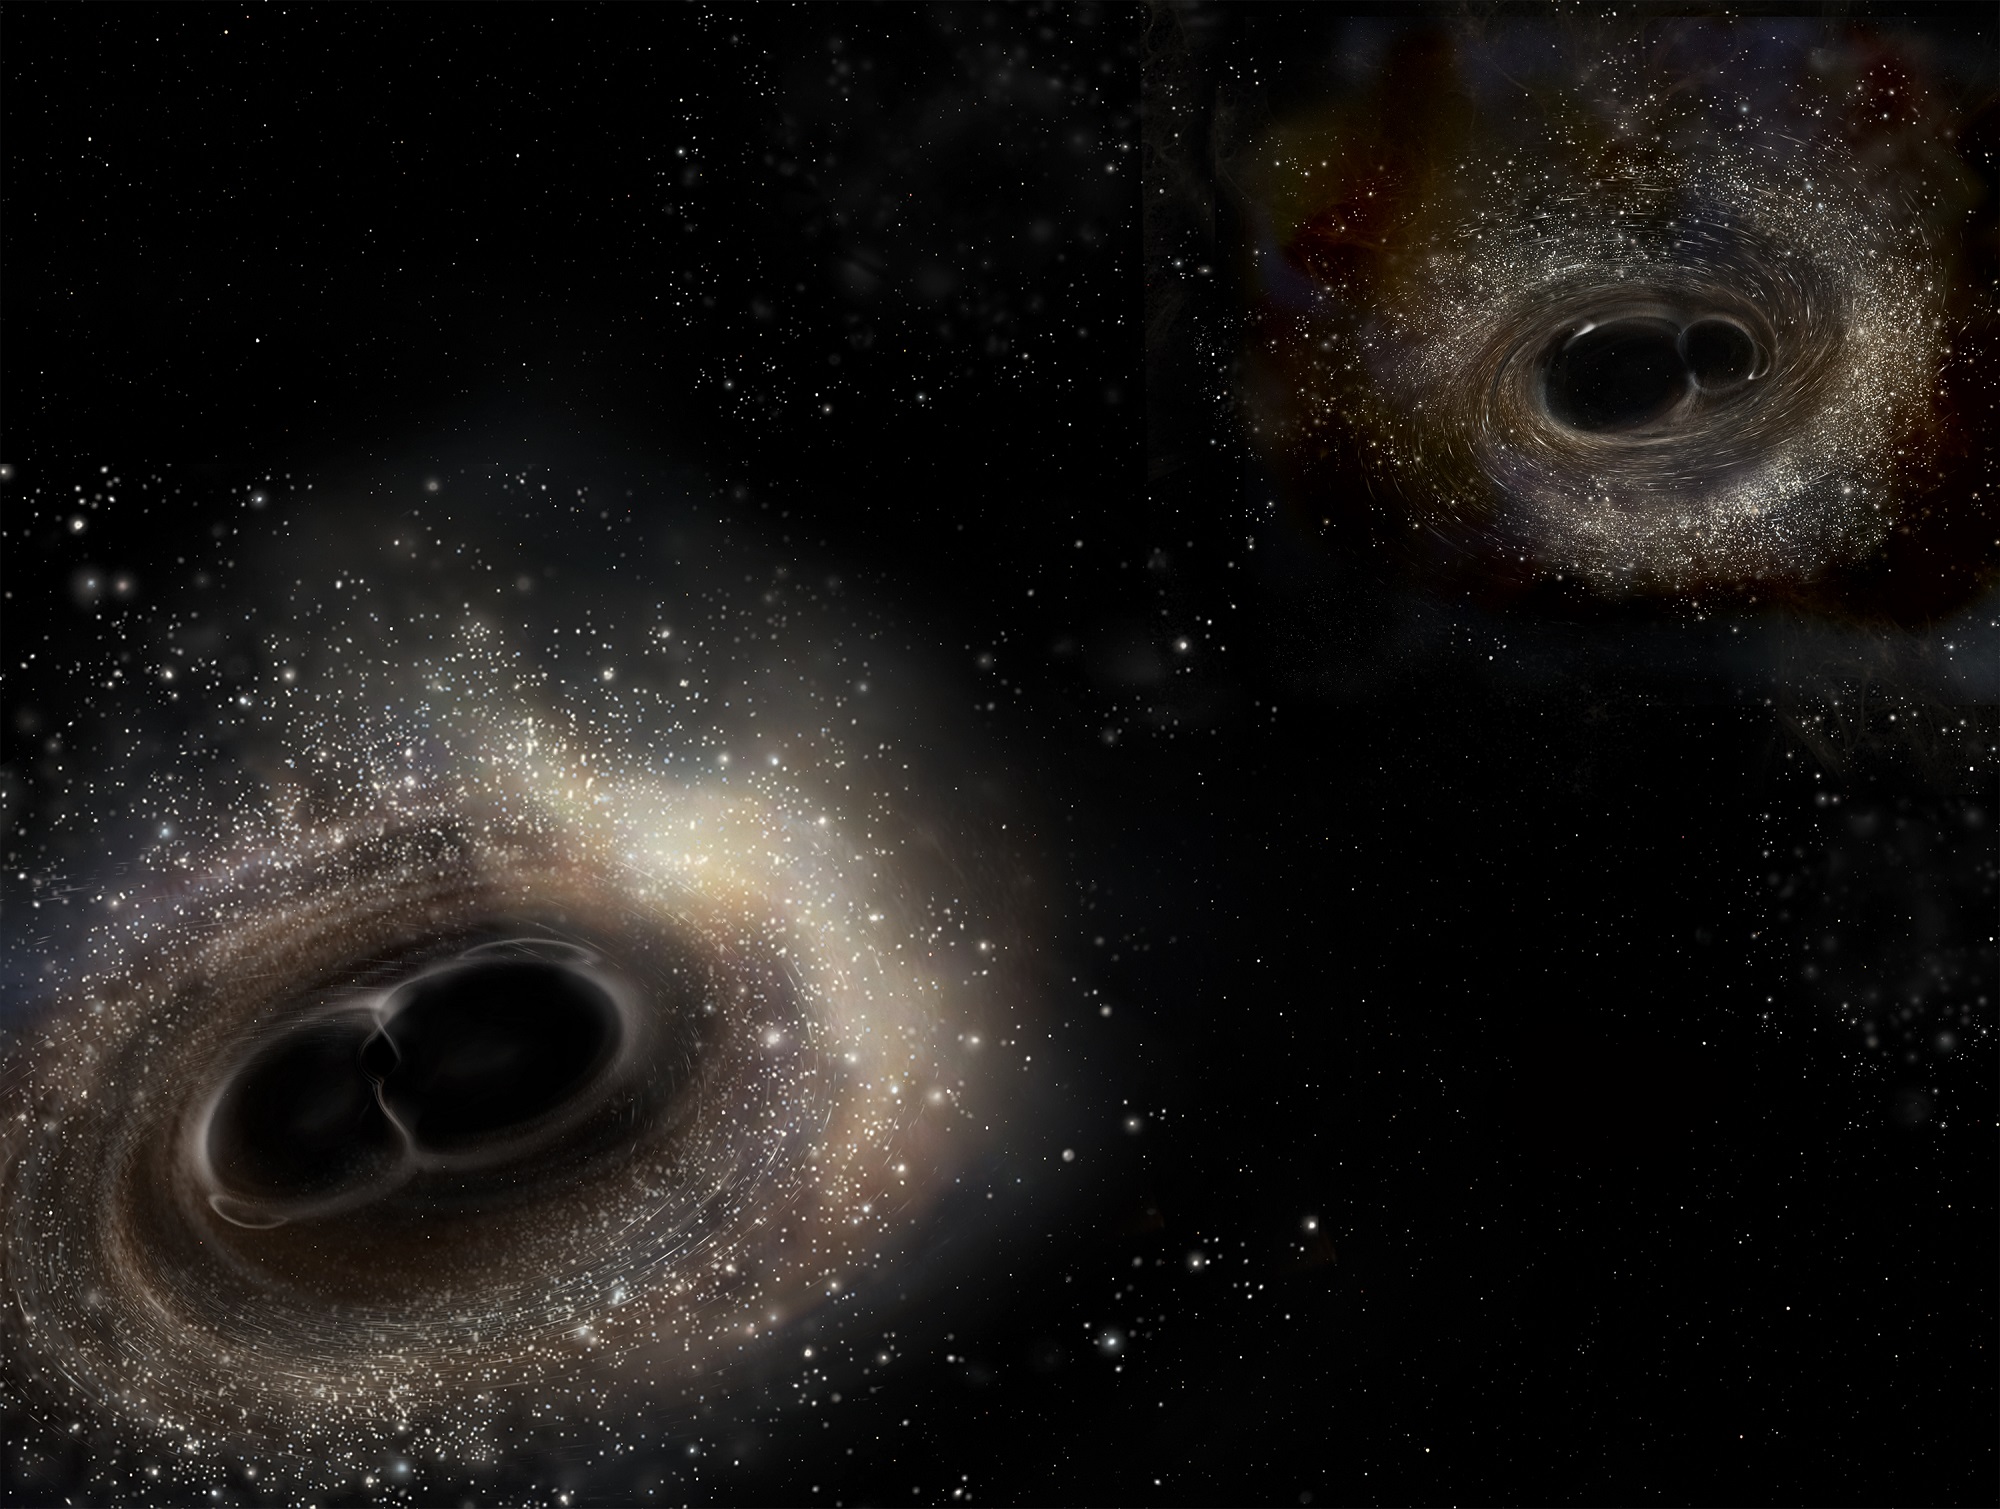
Artist's impression of merging binary black holes. Credit: LIGO/A. Simonnet.
On February 11th, 2016, scientists at the Laser Interferometer Gravitational-wave Observatory (LIGO) announced the first detection of gravitational waves. This development, which confirmed a prediction made by Einstein’s Theory of General Relativity a century prior, opened new avenues of research for cosmologists and astrophysicists. It was also a watershed for researchers at Monash University, who played an important role in the discovery.
And now, a little over a year later, a team of researchers from the Monash Center for Astrophysics has announced another potential revelation. Based on their ongoing studies of gravitational waves, the team recently proposed a theoretical concept known as ‘orphan memory’. If true, this concept could revolutionize the way we think about gravitational waves and spacetime.
Researchers from Monash Center for Astrophysics are part of what is known as the LIGO Scientific Collaboration (LSC) – a group of scientists dedicated to developing the hardware and software needed to study gravitational waves. In addition to creating a system for vetting detections, the team played a key role in data analysis – observing and interpreting the data that was gathered – and were also instrumental in the design of the LIGO mirrors.
Looking beyond what LIGO and other experiments (like the Virgo Interferometer) observed, the research team sought to address how these detectors capabilities could be extended further by finding the “memory” of gravitational waves. The study that describes this theory was recently published in the Physical Review Letters under the title “Detecting Gravitational Wave Memory without Parent Signals“.
According to their new theory, spacetime does not return to its normal state after a cataclysmic event generates gravitational waves that cause it to stretch out. Instead, it remains stretched, which they refer to as “orphan memory” – the word “orphan” alluding to the fact the “parent wave” is not directly detectable. While this effect has yet to be observed, it could open up some very interesting opportunities for gravitational wave research.
At present, detectors like LIGO and Virgo are only able to discern the presence of gravitational waves at certain frequencies. As such, researchers are only able to study waves generated by specific types of events and trace them back to their source. As Lucy McNeill, a researchers from the Monash Center for Astrophysics and the lead author on the paper, said in a recent University press statement:
“If there are exotic sources of gravitational waves out there, for example, from micro black holes, LIGO would not hear them because they are too high-frequency. But this study shows LIGO can be used to probe the universe for gravitational waves that were once thought to be invisible to it.”
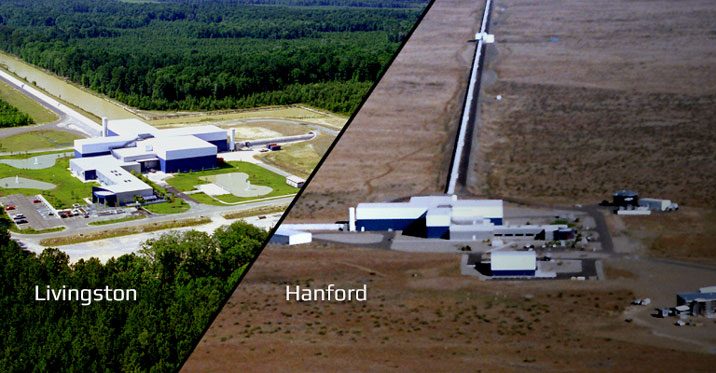
LIGO’s two facilities, located in Livingston, Louisiana, and Hanford, Washington. Credit: ligo.caltech.edu
As they indicate in their study, high-frequency gravitational-wave bursts (i.e. ones that are in or below the kilohertz range) would produce orphan memory that the LIGO and Virgo detectors would be able to pick up. This would not only increase the bandwidth of these detectors exponentially, but open up the possibility of finding evidence of gravity wave bursts in previous searches that went unnoticed.
Dr Eric Thrane, a lecturer at the Monash School of Physics and Astronomy and another a member of the LSC team, was also one of the co-authors of the new study. As he stated, “These waves could open the way for studying physics currently inaccessible to our technology.”
But as they admit in their study, such sources might not even exist and more research is needed to confirm that “orphan memory” is in fact real. Nevertheless, they maintain that searching for high-frequency sources is a useful way to probe for new physics, and it just might reveal things we weren’t expecting to find.
“A dedicated gravitational-wave memory search is desirable. It will have enhanced sensitivity compared to current burst searches,” they state. “Further, a dedicated search can be used to determine whether a detection candidate is consistent with a memory burst by checking to see if the residuals (following signal subtraction) are consistent with Gaussian noise.”
Alas, such searches may have to wait upon the proposed successors to the Advanced LIGO experiment. These include the Einstein Telescope and Cosmic Explorer, two proposed third-generation gravitational wave detectors. Depending on what future surveys find, we may discover that spacetime not only stretches from the creation of gravitational waves, but also bears the “stretch marks” to prove it!
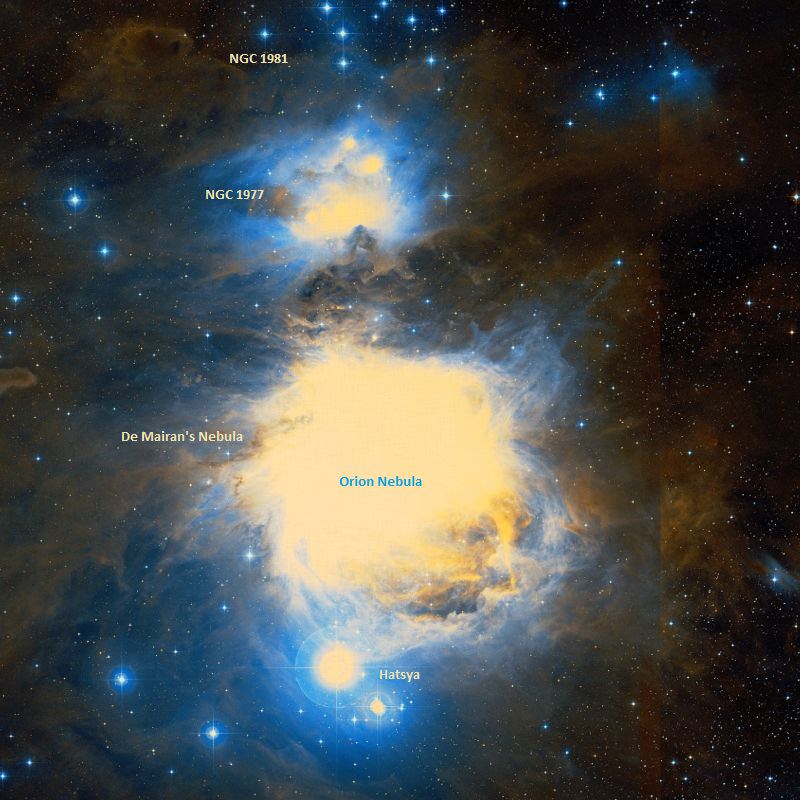
The De Mairan's Nebula (aka. Messier 43) and the Orion Nebula. Credit: Wikisky
Welcome back to Messier Monday! In our ongoing tribute to the great Tammy Plotner, we take a look at Orion’s Nebula’s “little brother”, the De Marian’s Nebula!
During the 18th century, famed French astronomer Charles Messier noted the presence of several “nebulous objects” in the night sky. Having originally mistaken them for comets, he began compiling a list of them so that others would not make the same mistake he did. In time, this list (known as the Messier Catalog) would come to include 100 of the most fabulous objects in the night sky.
One of these if the diffuse nebula known as the De Marian’s Nebula (aka. Messier 43). Located in the direction of the Orion constellation (in close proximity to the Orion Nebula), this nebula lies at a distance of 1,600 light years from Earth. Together with the Orion Nebula, it is part of one of the most active star-forming regions visible in the night sky.
Description:
The diffuse nebula M43 surrounds the variable star N U Orionis (HD 37061) – a rather cool, young star cooking in a rich HII region. But is the light that’s reaching us actually coming through a tunnel in this dusty cloud? As Karl Wurm and Mario Perinotto explained in a 1970 study:
“Most of the areas with identical monochromatic features show a high deficiency of cluster stars correlated with a low surface brightnesss and a reduced gas density. This is explained by an opaqueness of the emission strata in the direction in the line of sight and a position of the same nearer to the observer than the extension of the cluster. There appear surface structures at large distances from the Trapezium which show a correlation between the intensity of scattered star light and the intensity of the emission of the higher ions ([Oiii], [Neiii]). This observation is considered as a proof that canals through the nebular cloud complex allow in some directions the exciting radiation to reach large distances from the star without having suffered an appreciable absorption or scattering.”
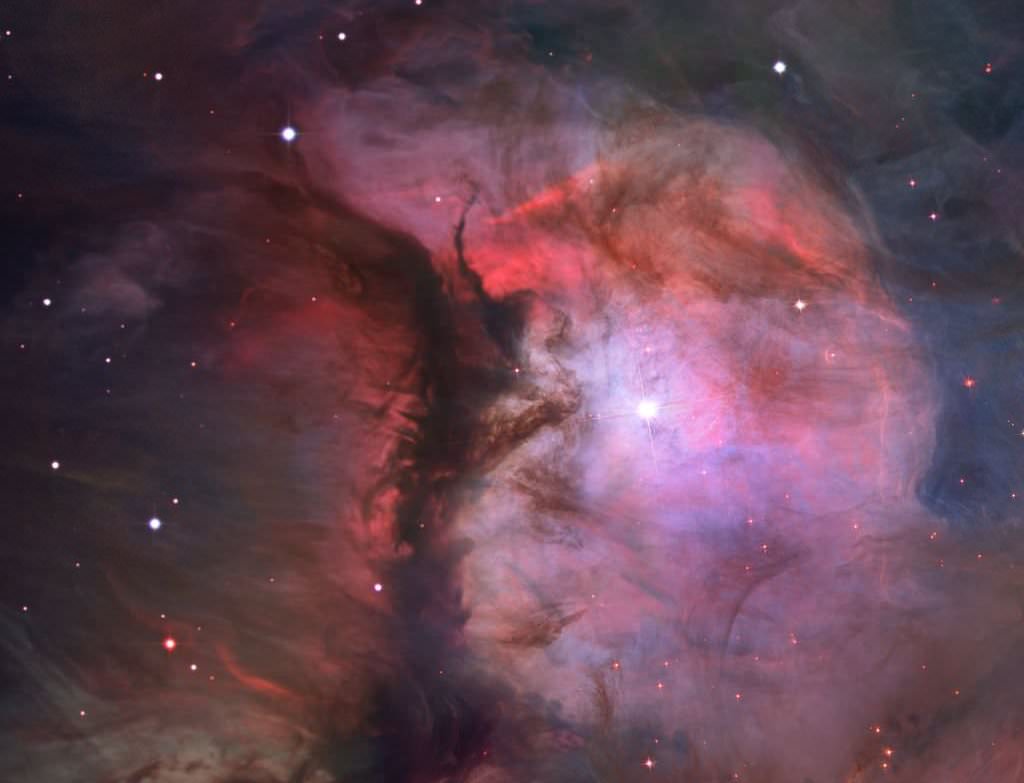
De Mairan’s Nebula, M43, NGC 1982. Credit: NASA/ESA/M. Robberto (Space Telescope Science Institute/ESA)/Hubble Space Telescope Orion Treasury Project Team
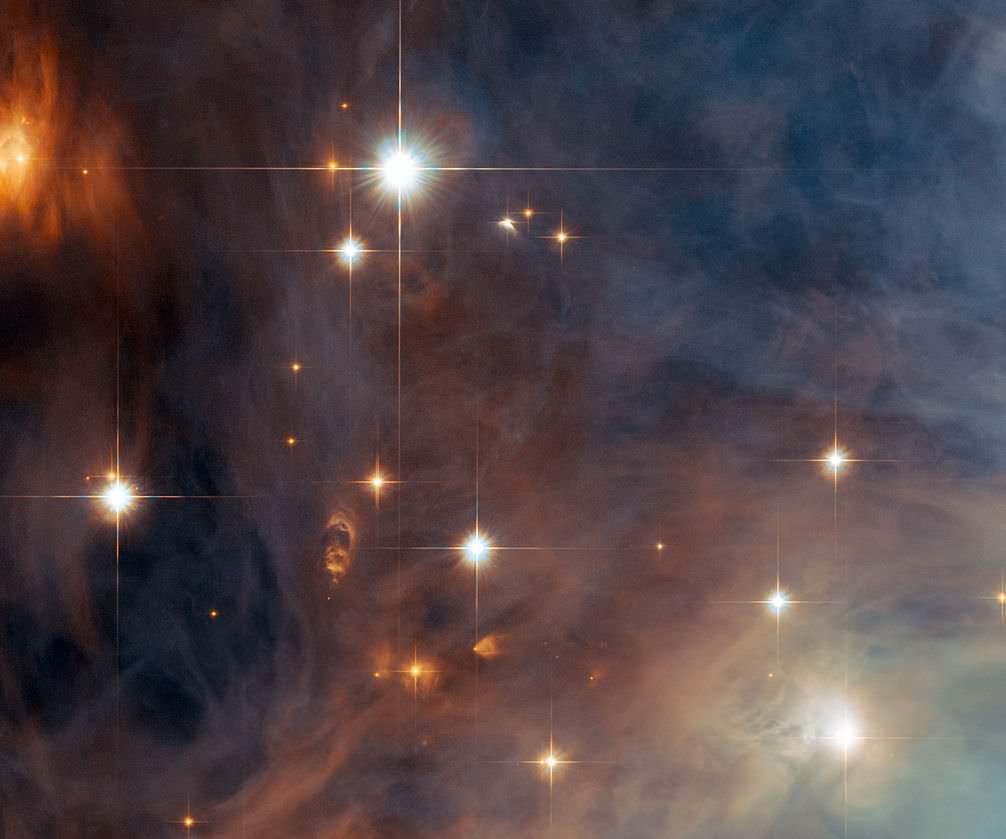
However, N U is far from being alone…. The whole complex is littered with stars being born! As Bo Reipurth (et al), stated in a 1999 study:
“The OMC-2/3 molecular clouds contain one of the highest concentrations of protostars known in nearby molecular clouds. We have observed an area of about 6 × 15 (0.8 pc × 2 pc) covering the OMC-2/3 region with the Very Large Array in the D configuration at 3.6 cm, matching well the area of a recent 1300 m survey. We detected 14 sources, of which it is highly probable that 11 sources are either protostars or very young stars. This testifies to the star-forming activity and extreme youth of the OMC-2/3 region. The 3.6 cm flux is free-free emission probably due to shocks in outflowing material. Three of the sources are extended even with the relatively low resolution of the present observations, and two of these may be collimated radio jets. The large fraction of submillimeter continuum sources that have a radio continuum counterpart is evidence that outflow is already common at the very earliest evolutionary stages. No relation is found between the radio continuum flux and the 1300 m flux of the associated submillimeter dust clumps.”
History of Observation:
In 1731, Jean-Jacques Dortous de Mairan was the first to notice this independent portion of the Orion nebula, stating:
“Finally I will add that close to the luminous space in Orion [M42], one sees the star d of Huygens [NU Orionis] currently (1731) surrounded by a brilliance very similar to that which produces, as I believe, the atmosphere of our Sun, if it were dense enough and extensive enough to be visible in Telescopes at a similar distance. See it in the form and the situation [given by] D, according to what was determined with the Reticule.”
On March 4, 1771, Charles Messier would also come to the same conclusion as he states in his observing notes:
“The star which is above, and has little distance from that nebula, and of which is spoken in the Traite de l’Aurore boreale [Treat of the Northern Light] by M. de Mairan is surrounded, and equally by a very thin light; the star doesn’t have the same brilliance as the four of the great nebula: its light is pale, and it appears covered by fog. I determined its position; its right ascension was 81d 3′ 0″, and its declination 5d 26′ 37″ south.”
Close-up view of the Orion Nebula’s little brother, Messier 43, taken by NASA/ESA Hubble Space Telescope. Credit: ESA/Hubble & NASA
While Sir William Herschel was very careful not to assign his own catalog numbers to Messier Objects, he, too, was fascinated by the M43 region. In his personal notes he writes:
“In the year 1774, the 4th of March, I observed the nebulous star, which is the 43d of the Connoissance des Temps and is not many minutes north of the great nebula; but at the same time I also took notice of two similar, but much smaller nebulous stars; one on each side of the large one, and at nearly equal distance from it. Fig. 37 is a copy of the drawing which was made at the time of observation.
“In 1783, I reexamined the nebulous star, and found it to be faintly surrounded with a circular glory of whitish nebulosity, faintly joined to the great nebula. About the latter end of the same year I remarked that it was not equally surrounded, but most nebulous toward the south.
“In 1784, I began to entertain an opinion that the star was not connected with the nebulosity of the great nebula in Orion, but was one of those which are scattered over that part of the heavens.
“In 1801, 1806, and 1810 this opinion was fully confirmed, by the gradual change which happened in the great nebula, to which the nebulosity surrounding this star belongs. For the intensity of the light about the nebulous star had by this time been considerably reduced, by attenuation or dissipation of nebulous matter; and it seemed now to be pretty evident that the star is far behind the nebulous matter, and that consequently its light in passing through it is scattered and deflected, so as to produce the appearance of a nebulous star. A similar phenomenon may be seen whenever a planet or a star of the 1st or 2nd magnitude happens to be involved in haziness; for a diffused circular light will then be seen, to which, but in a much inferior degree, that which surrounds this nebulous star bears a great resemblance.
“When I reviewed this interesting object in December 1810, I directed my attention particularly to the two small nebulous stars, by sides of the large one, and found that they were perfectly free from every nebulous appearance; which confirmed not only my former surmise of the great attenuation of the nebulosity, but also proved that their former nebulous appearance had been entirely the effect of the passage of their feeble light through the nebulous matter spread out before them.
The 19th of January 1811, I had another critical examination of the same object in a very clear view through the 40-feet telescope; but notwithstanding the superior light of this instrument, I could not perceive any remains of nebulosity about the two small stars, which were perfectly clear, and in the same situation, where about thirty-seven years before I had seen them involved in nebulosity.”
May this wonderful region entertain your brain for as many years as it did Bill Herschel!
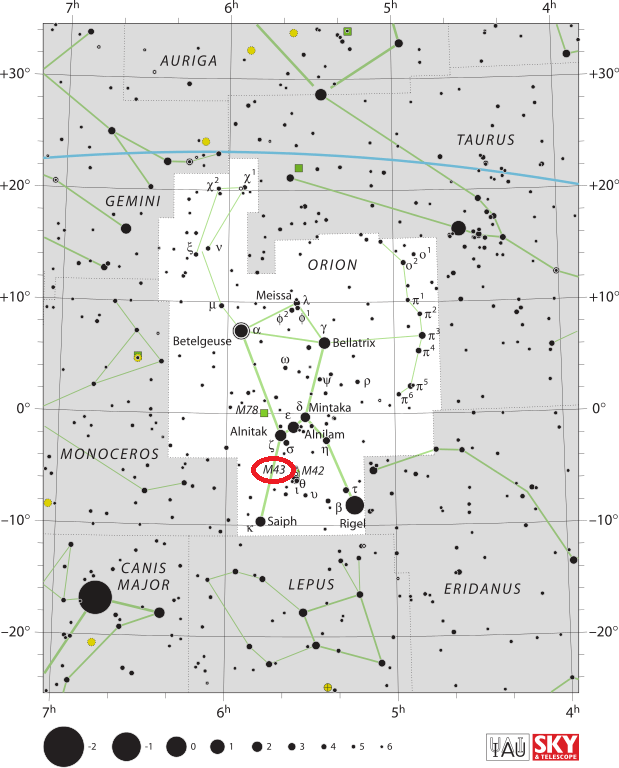
The location of Messier 43 in the constellation of Orion. Credit: IAU/Sky & Telescope magazine (Roger Sinnott & Rick Fienberg)
Locating Messier 43:
Locating M43 is as easy as locating… well… M42! This small star cluster accompanied by an emission/reflection nebula just to the north of the Orion Nebula’s “Trapezium” region is often mistake for part of the great nebula itself. However, if you look closely, you’ll see the two are separated by a dark dust lane.
Begin by locating the asterism of three stars known as Orion’s Belt. If you cover it with your fist held at arm’s length in a “thumb’s down” gesture with your left hand, the tip of your thumb will just about mark the correct spot in the sky. From a dark location when no Moon is present, you can easily see the haze of the Orion nebula surrounding the stars in the “sword” asterism. While it is easily seen in binoculars on a dark night, it will fade significantly under light pollution or moonlight.
And here are the quick facts on Messier 43 to help you get started:
Object Name: Messier 43 Alternative Designations: M43, NGC 1982, De Mairan’s Nebula, Companion of the Orion Nebula Object Type: Emission/Reflection Nebula and Open Cluster Constellation: Orion Right Ascension: 05 : 35.6 (h:m) Declination: -05 : 16 (deg:m) Distance: 1.3 (kly) Visual Brightness: 9.0 (mag) Apparent Dimension: 20×15 (arc min)
Artist's concept of KIC 8462852, which has experienced unusual changes in luminosity over the past few years. Credit: NASA, JPL-Caltech
In September of 2015, scientists announced that the star known as KIC 8462852 (aka. “Tabby’s Star” or “Boyajian’s Star”) was experiencing a strange dip in luminosity. At the time, astronomers indicated that this mysterious behavior could be the result of comets transiting in front of the star, but other (perhaps more hopeful) individuals claimed that it could also be the result of an alien megastructure.
This led to a flurry of studies and articles that sought to offer entirely natural explanations for what has been observed. Even SETI weighed in, indicating that they would begin searching for indications of radio signals coming this mysterious star. But after two years and multiple studies that offer explanations other an alien Dyson Sphere (or some other type of megastructure), the star is at it again! Continue reading “The Star That Probably Doesn’t Have an Alien Megastructure (But Maybe it Does) is Dimming Again”
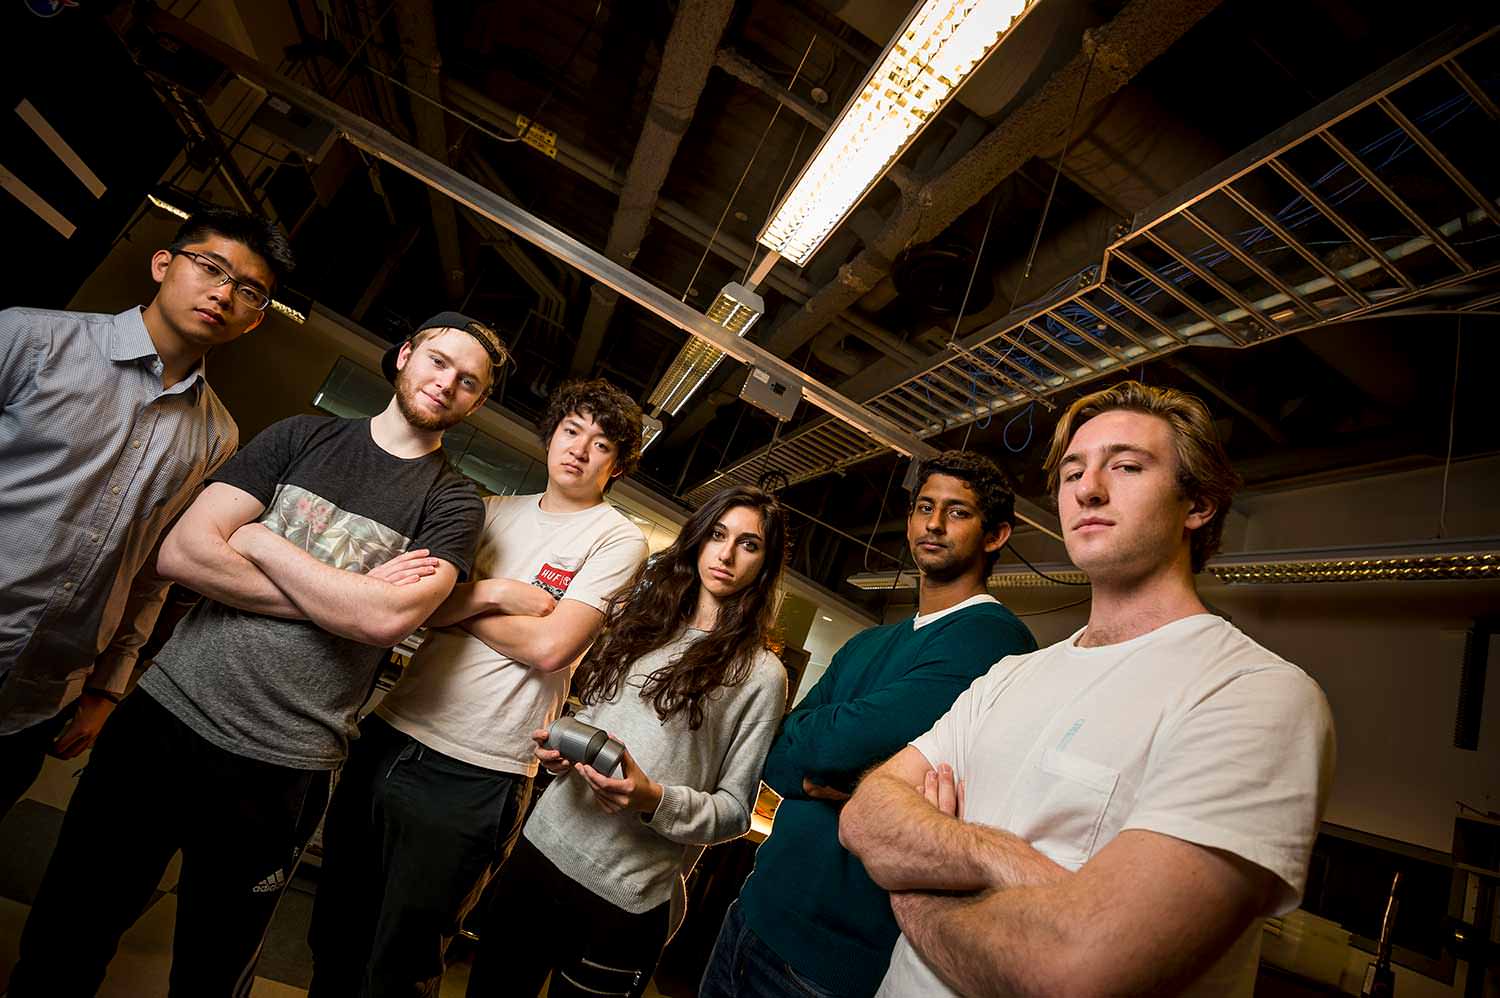
A team of UC San Diego students have created an experiment to test if beer can be brewed on the Moon. Credit: NASA
When human beings colonize other Solar bodies, how will they see to their basic needs? Already, research has been performed to determine where colonists would be able to procure water, how they might grow their own food, and where and how they might live. But what about the finer things in life, the things that make all the hard labor and sacrifice worth it? In case it’s not clear yet, I’m talking about beer!
If and when Lunar or Martian colonies become a reality, will the colonists be able to brew and enjoy their own beer? Or will imported beer be the only thing available to them? That’s the question a team of bioengineering students from the University of California San Diego sought to answer. As finalists who competed in the Lab2Moon competition being held by TeamIndus, they combined their love of beer with their love of space exploration.
As the only Indian team in the Google Lunar XPRIZE competition, TeamIndus has been working on a privately-funded spacecraft to send to the Moon. Once complete, TeamIndus hopes to conduct a soft landing on the surface of the Moon later this year. Their accomplishments so far include being one of the five teams selected to compete in the Milestone Prizes and successfully winning the $1 million Milestone Prize for their landing technology.
Johnny Koo, Jared Buchanan, Han Lu Ling, Neeki Ashari, Srivaths Kalyan, and Tavish Traut. Credit: Erik Jepsen/UC San Diego Publications
The Lab2Moon competition was held in order to see a youth experiment brought to the Moon aboard that spacecraft. And while their experiment did not take home the top prize, their final prototype will still be going into space. Thanks to Synergy Moon, who won an XPrize verified launch contract, the experiment will be launched aboard a rocket this December (the planned launch date is currently Dec. 28th, 2017).
For the sake of their experiment, the UC San Diego team – all undergraduates with the Jacobs School of Engineering – sought to test if yeast would be viable in a Lunar environment. As the key ingredient in the production of beer (and many other beneficial things), their experiment sought to determine if Lunar colonists will be capable of becoming their own brewmasters.
Their team name is “Original Gravity”, a delicious pun that alludes to both brewing and the Lunar conditions they are investigating. In the case of brewing, Original Gravity (OG) is the measure of sugars dissolved in the wort (the beer before it is fermented). In the case of the Moon, it refers to the fact that Lunar gravity is just 0.165 times that of Earth’s, which could affect the behavior of the microorganisms like yeast.
As Neeki Ashari, a fifth-year bioengineering student and the team’s PR & Operations Lead, said in a University press release:
“The idea started out with a few laughs amongst a group of friends. We all appreciate the craft of beer, and some of us own our own home-brewing kits. When we heard that there was an opportunity to design an experiment that would go up on India’s moonlander, we thought we could combine our hobby with the competition by focusing on the viability of yeast in outer space.”
With sponsorship from the Omega Yeast Labs, the team designed a unique brewing system. First, all the prep work that precedes the adding of yeast – for instance, combining malted barley and water to create wort – would take place on Earth. Second, the team plans to combine the “fermentation” and “carbonation” phases – which are usually done separately – into one phase.
This process makes for a system that is much easier to design, eliminates the need for releasing accumulated CO² (which can be a hazard) and also prevents the possibility of over-pressurization if anything in the system fails. Last, the testing of fermentation will not rely on density measurements that rely on gravity (as brewers do on Earth), using pressure to determine sugar content instead.
As Han Ling, a fifth-year bioengineering undergraduate student and the team’s leader, explained, “Converting the pressure buildup to fermentation progress is straightforward, as long as volume and original gravity – specific gravity before fermentation, hence our name – are known prior to the experiment.” Measuring roughly as wide as a soda can, their system is able to ferment yeast and worst to create beer, even under Lunar conditions.
In addition to being the first-ever experiment to brew beer in space, their experiment will also be the first to craft beer using such a small apparatus. A Srivaths Kaylan, a fourth-year nano-engineering major and the team’s mechanical lead, indicated:
“Our canister is designed based on actual fermenters. It contains three compartments—the top will be filled with the unfermented beer, and the second will contain the yeast. When the rover lands on the moon with our experiment, a valve will open between the two compartments, allowing the two to mix. When the yeast has done it’s job, a second valve opens and the yeast sink to the bottom and separate from the now fermented beer.”
Team Original Gravity’s revolutionary brewing system. Credit: jacobsschool.ucsd.edu
Looking to the future, Ashari and the team hope to see their experiment adapted for use on other planets – like Mars! Other proposed experiments that were entered in the competition included methods for photosynthesis to producing electricity in a Lunar environment. Beyond making beer, understanding how yeast will behave in a Lunar environment is also important in the development of pharmaceuticals and yeast-containing foods, such as bread.
It certainly is interesting to think about what kind of beers could be produced in an extra-terrestrial environment, isn’t it? Will future generations of brewers have the option of using locally-grown barley, wheat, hops, and yeast cultures to craft their beer? Will the use of Lunar or Martian water have an effect on the taste of the beer?
And then there’s the matter of names and styles. Will Lunar brewers create a Dark Side of the Moon Stout? Will the people of Mars specialize in Red Ales? Like I said, interesting!