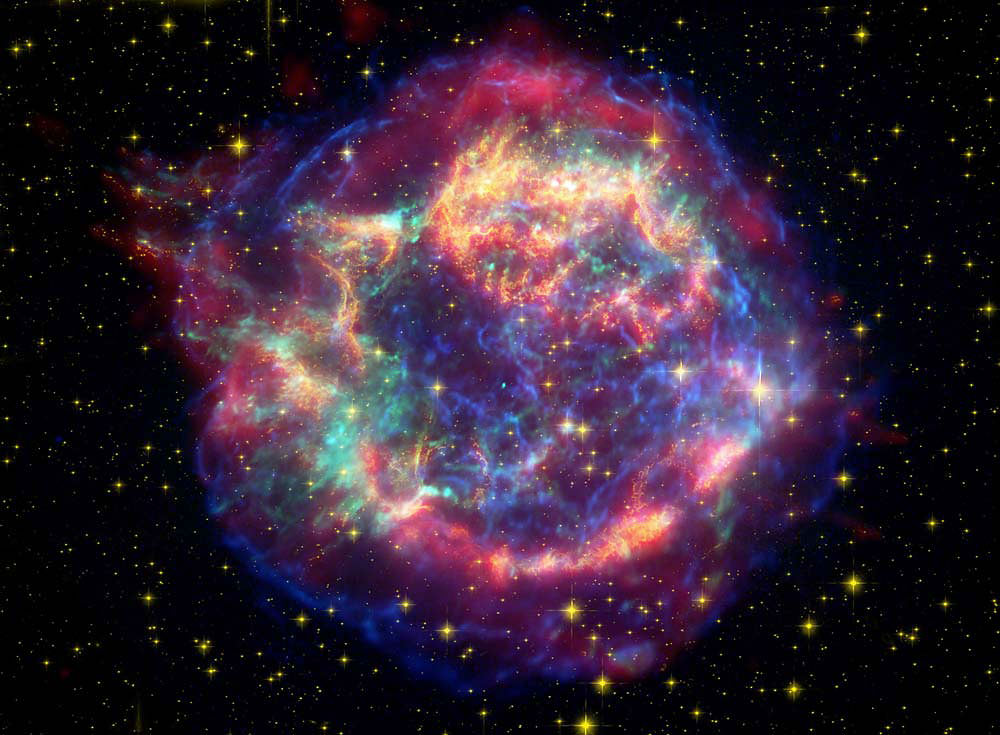
Composite Spitzer, Hubble, and Chandra image of supernova remnant Cassiopeia A. A new study shows that a supernova as far away as 50 light years could have devastating effects on life on Earth. (NASA/JPL-Caltech/STScI/CXC/SAO)
There are a lot of ways that life on Earth could come to an end: an asteroid strike, global climate catastrophe, or nuclear war are among them. But perhaps the most haunting would be death by supernova, because there’s absolutely nothing we could do about it. We’d be sitting ducks.
New research suggest that a supernova’s kill zone is bigger than we thought; about 25 light years bigger, to be exact.
Iron in the Ocean
In 2016, researchers confirmed that Earth has been hit with the effects from multiple supernovae. The presence of iron 60 in the seabed confirms it. Iron 60 is an isotope of iron produced in supernova explosions, and it was found in fossilized bacteria in sediments on the ocean floor. Those iron 60 remnants suggest that two supernovae exploded near our solar system, one between 6.5 to 8.7 million years ago, and another as recently as 2 million years ago.
Iron 60 is extremely rare here on Earth because it has a short half life of 2.6 million years. Any of the iron 60 created at the time of Earth’s formation would have decayed into something else by now. So when researchers found the iron 60 on the ocean floor, they reasoned that it must have another source, and that logical source is a supernova.
This evidence was the smoking gun for the idea that Earth has been struck by supernovae. But the questions it begs are, what effect did that supernova have on life on Earth? And how far away do we have to be from a supernova to be safe?
“…we can look for events in the history of the Earth that might be connected to them (supernova events).” – Dr. Adrian Melott, Astrophysicist, University of Kansas.
In a press release from the University of Kansas, astrophysicist Adrian Melott talked about recent research into supernovae and the effects they can have on Earth. “This research essentially proves that certain events happened in the not-too-distant past,” said Melott, a KU professor of physics and astronomy. “They make it clear approximately when they happened and how far away they were. Knowing that, we can consider what the effect may have been with definite numbers. Then we can look for events in the history of the Earth that might be connected to them.”
Earlier work suggested that a supernova kill zone is about 25-30 light years. If a supernova exploded that close to Earth, it would trigger a mass extinction. Bye-bye humanity. But new work suggests that 25 light years is an under-estimation, and that a supernova 50 light years away would be powerful enough to cause a mass extinction.
Supernovae: A Force Driving Evolution?
But extinction is just one effect a supernova could have on Earth. Supernovae can have other effects, and they might not all be negative. It’s possible that a supernovae about 2.6 million years ago even drove human evolution.
“Our local research group is working on figuring out what the effects were likely to have been,” Melott said. “We really don’t know. The events weren’t close enough to cause a big mass extinction or severe effects, but not so far away that we can ignore them either. We’re trying to decide if we should expect to have seen any effects on the ground on the Earth.”
Melott and his colleagues have written a new paper that focuses on the effects a supernova might have on Earth. In a new paper titled “A SUPERNOVA AT 50 PC: EFFECTS ON THE EARTH’S ATMOSPHERE AND BIOTA”, Melott and a team of researchers tried to shed light on Earth-supernova interactions.
The Local Bubble
There are a number of variables that come into play when trying to determine the effects of a supernova, and one of them is the idea of the Local Bubble. The Local Bubble itself is the result of one or more supernova explosion that occurred as long as 20 million years ago. The Local Bubble is a 300 light year diameter bubble of expanding gas in our arm of the Milky Way galaxy, where our Solar System currently resides. We’ve been travelling through it for the last five to ten million years. Inside this bubble, the magnetic field is weak and disordered.
Melott’s paper focused on the effects that a supernova about 2.6 million years ago would have on Earth in two instances: while both were within the Local Bubble, and while both were outside the Local Bubble.
The disrupted magnetic field inside the Local Bubble can in essence magnify the effects a supernova can have on Earth. It can increase the cosmic rays that reach Earth by a factor of a few hundred. This can increase the ionization in the Earth’s troposphere, which mean that life on Earth would be hit with more radiation.
Outside the Local Bubble, the magnetic field is more ordered, so the effect depends on the orientation of the magnetic field. The ordered magnetic field can either aim more radiation at Earth, or it could in a sense deflect it, much like our magnetosphere does now.
Focusing on the Pleistocene
Melott’s paper looks into the connection between the supernova and the global cooling that took place during the Pleistocene epoch about 2.6 million years ago. There was no mass extinction at that time, but there was an elevated extinction rate.
According to the paper, it’s possible that increased radiation from a supernova could have changed cloud formation, which would help explain a number of things that happened at the beginning of the Pleistocene. There was increased glaciation, increased species extinction, and Africa grew cooler and changed from predominantly forests to semi-arid grasslands.
Cancer and Mutation
As the paper concludes, it is difficult to know exactly what happened to Earth 2.6 million years ago when a supernova exploded in our vicinity. And it’s difficult to pinpoint an exact distance at which life on Earth would be in trouble.
But high levels of radiation from a supernova could increase the cancer rate, which could contribute to extinction. It could also increase the mutation rate, another contributor to extinction. At the highest levels modeled in this study, the radiation could even reach one kilometer deep into the ocean.
There is no real record of increased cancer in the fossil record, so this study is hampered in that sense. But overall, it’s a fascinating look at the possible interplay between cosmic events and how we and the rest of life on Earth evolved.
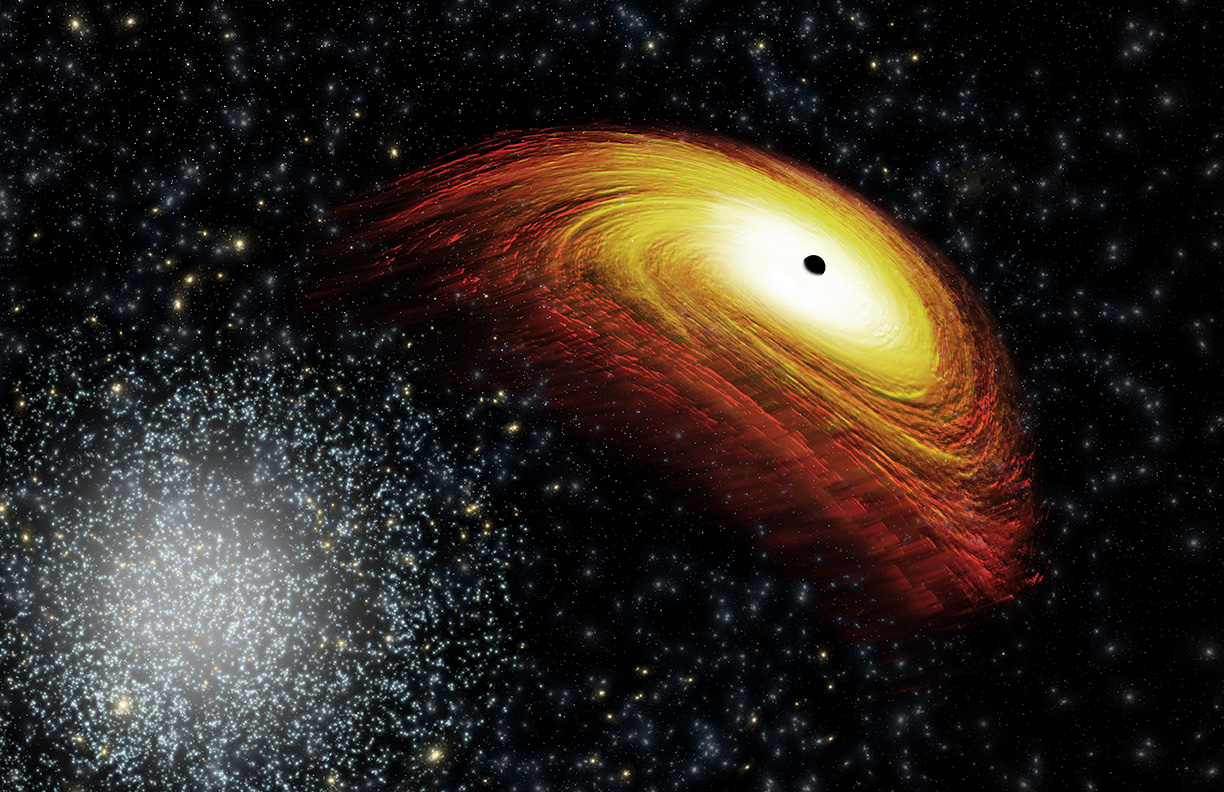
Using data from Chandra and other telescopes, astronomers have found a possible "recoiling" black hole. Credit: NASA/CXC/M.Weiss
When galaxies collide, all manner of chaos can ensue. Though the process takes millions of years, the merger of two galaxies can result in Supermassive Black Holes (SMBHs, which reside at their centers) merging and becoming even larger. It can also result in stars being kicked out of their galaxies, sending them and even their systems of planets into space as “rogue stars“.
But according to a new study by an international team of astronomers, it appears that in some cases, SMBHs could also be ejected from their galaxies after a merger occurs. Using data from NASA’s Chandra X-ray Observatory and other telescopes, the team detected what could be a “renegade supermassive black hole” that is traveling away from its galaxy.
According to the team’s study – which appeared in the Astrophysical Journal under the title A Potential Recoiling Supermassive Black Hole, CXO J101527.2+625911 – the renegade black hole was detected at a distance of about 3.9 billion light years from Earth. It appears to have come from within an elliptical galaxy, and contains the equivalent of 160 million times the mass of our Sun.
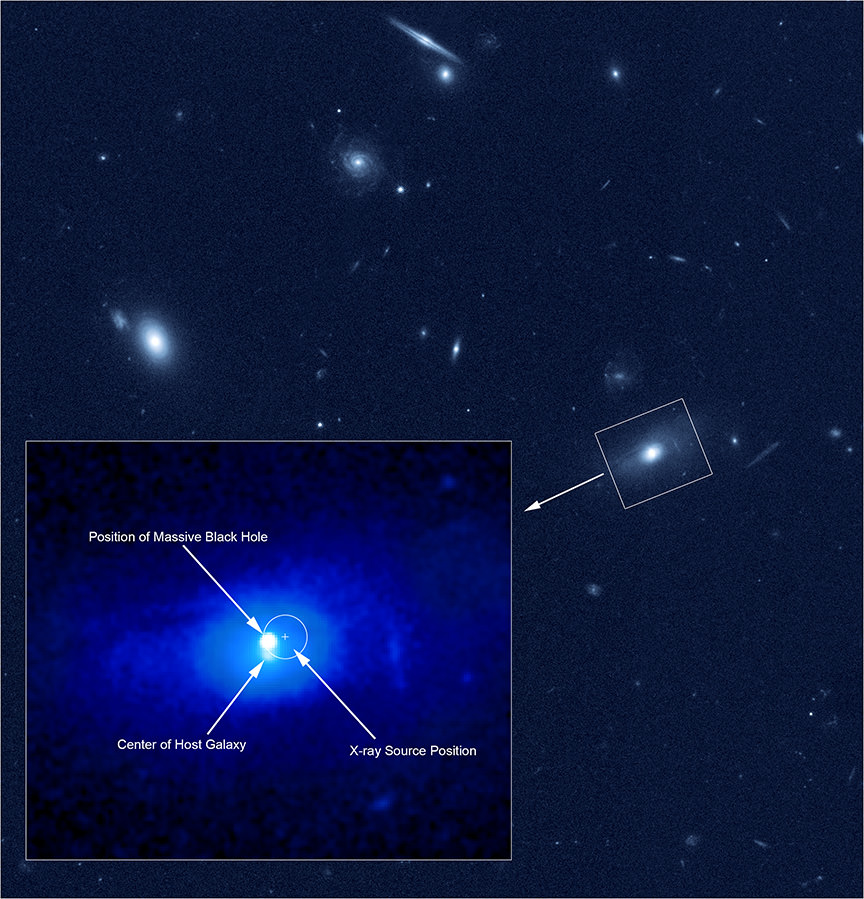
Hubble data showing the two bright points near the middle of the galaxy. Credit: NASA/CXC/NRAO/D.-C.Kim/STScI
The team found this black hole while searching through thousands of galaxies for evidence of black holes that showed signs of being in motion. This consisted of sifting through data obtained by the Chandra X-ray telescope for bright X-ray sources – a common feature of rapidly-growing SMBHs – that were observed as part of the Sloan Digital Sky Survey (SDSS).
They then looked at Hubble data of all these X-ray bright galaxies to see if it would reveal two bright peaks at the center of any. These bright peaks would be a telltale indication that a pair of supermassive black holes were present, or that a recoiling black hole was moving away from the center of the galaxy. Last, the astronomers examined the SDSS spectral data, which shows how the amount of optical light varies with wavelength.
From all of this, the researchers invariably found what they considered to be a good candidate for a renegade black hole. With the help data from the SDSS and the Keck telescope in Hawaii, they determined that this candidate was located near, but visibly offset from, the center of its galaxy. They also noted that it had a velocity that was different from the galaxy – properties which suggested that it was moving on its own.
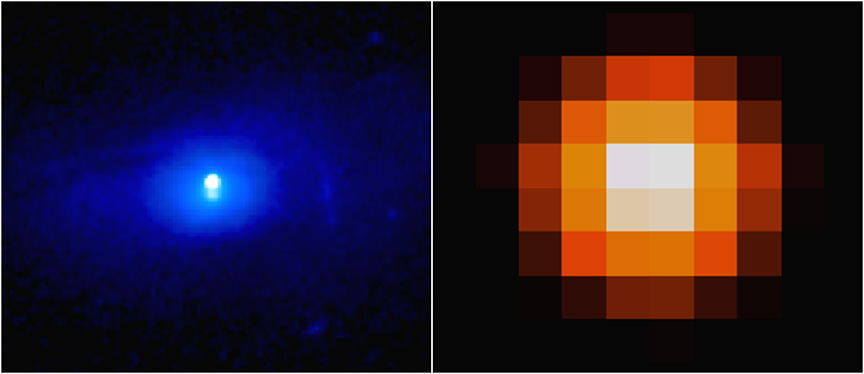
The image below, which was generated from Hubble data, shows the two bright points near the center of the galaxy. Whereas the one on the left was located within the center, the one on the right (the renegade SMBH) was located about 3,000 light years away from the center. Between the X-ray and optical data, all indications pointed towards it being a black hole that was kicked from its galaxy.
The bright X-ray source detected with Chandra (left), and data obtained from the SDSS and the Keck telescope in Hawaii. Credit: NASA/CXC/NRAO/D.-C.Kim/STScI
In terms of what could have caused this, the team ventured that the back hole might have “recoiled” when two smaller SMBHs collided and merged. This collision would have generated gravitational waves that could have then pushed the black hole out of the galaxy’s center. They further ventured that the black hole may have formed and been set in motion by the collision of two smaller black holes.
Another possible explanation is that two SMBHs are located in the center of this galaxy, but one of them is not producing detectable radiation – which would mean that it is growing too slowly. However, the researchers favor the explanation that what they observed was a renegade black hole, as it seems to be more consistent with the evidence. For example, their study showed signs that the host galaxy was experiencing some disturbance in its outer regions.
This is a possible indication that the merger between the two galaxies occurred in the relatively recent past. Since SMBH mergers are thought to occur when their host galaxies merge, this reservation favors the renegade black hole theory. In addition, the data showed that in this galaxy, stars were forming at a high rate. This agrees with computer simulations that predict that merging galaxies experience an enhanced rate of star formation.
But of course, additional researches is needed before any conclusions can be reached. In the meantime, the findings are likely to be of particular interest to astronomers. Not only does this study involve a truly rare phenomenon – a SMBH that is in motion, rather than resting at the center of a galaxy – but the unique properties involved could help us to learn more about these rare and enigmatic features.
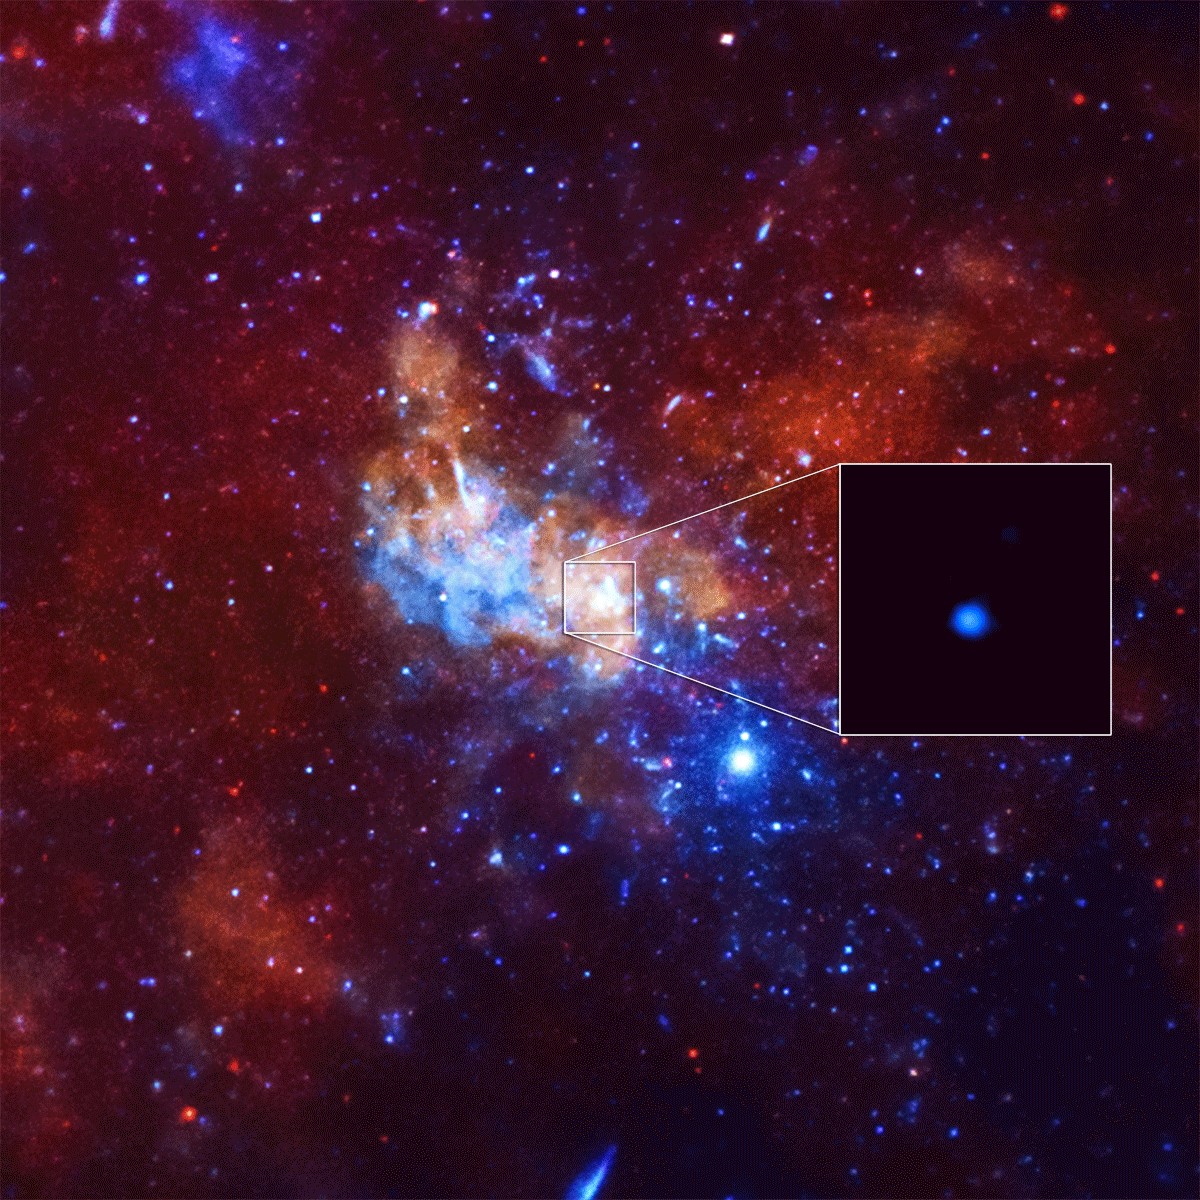
Detection of an unusually bright X-Ray flare from Sagittarius A*, a supermassive black hole in the center of the Milky Way galaxy. Credit: NASA/CXC/Stanford/I. Zhuravleva et al.
For one, the study of SMBHs could reveal more about the rate and direction of spin of these enigmatic objects before they merge. From this, astronomers would be able to better predict when and where SMBHs are about to merge. Studying the speed of recoiling black holes could also reveal additional information about gravitational waves, which could unlock additional secrets about the nature of space time.
And above all, witnessing a renegade black hole is an opportunity to see some pretty amazing forces at work. Assuming the observations are correct, there will no doubt be follow-up surveys designed to see where the SMBH is traveling and what effect it is having on the surrounding cosmic environment.
Ever since the 1970s, scientists have been of the opinion that most galaxies have SMBHs at their center. In the years and decades that followed, research confirmed the presence of black holes not only at the center of our galaxy – Sagittarius A* – but at the center of all almost all known massive galaxies. Ranging in mass from the hundreds of thousands to billions of Solar masses, these objects exert a powerful influence on their respective galaxies.
Be sure to enjoy this video, courtesy of the Chandra X-Ray Observatory:
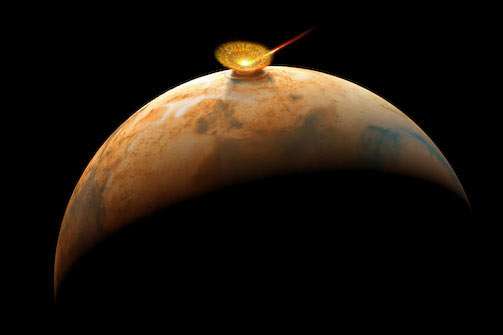
Asteroid impacts on Mars could have generated supersonic winds that shaped the surface, according to a new study. Credit: geol.umd.edu
The study of another planet’s surface features can provide a window into its deep past. Take Mars for example, a planet whose surface is a mishmash of features that speak volumes. In addition to ancient volcanoes and alluvial fans that are indications of past geological activity and liquid water once flowing on the surface, there are also the many impact craters that dot its surface.
In some cases, these impact craters have strange bright streaks emanating from them, ones which reach much farther than basic ejecta patterns would allow. According to a new research study by a team from Brown University, these features are the result of large impacts that generated massive plumes. These would have interacted with Mars’ atmosphere, they argue, causing supersonic winds that scoured the surface.
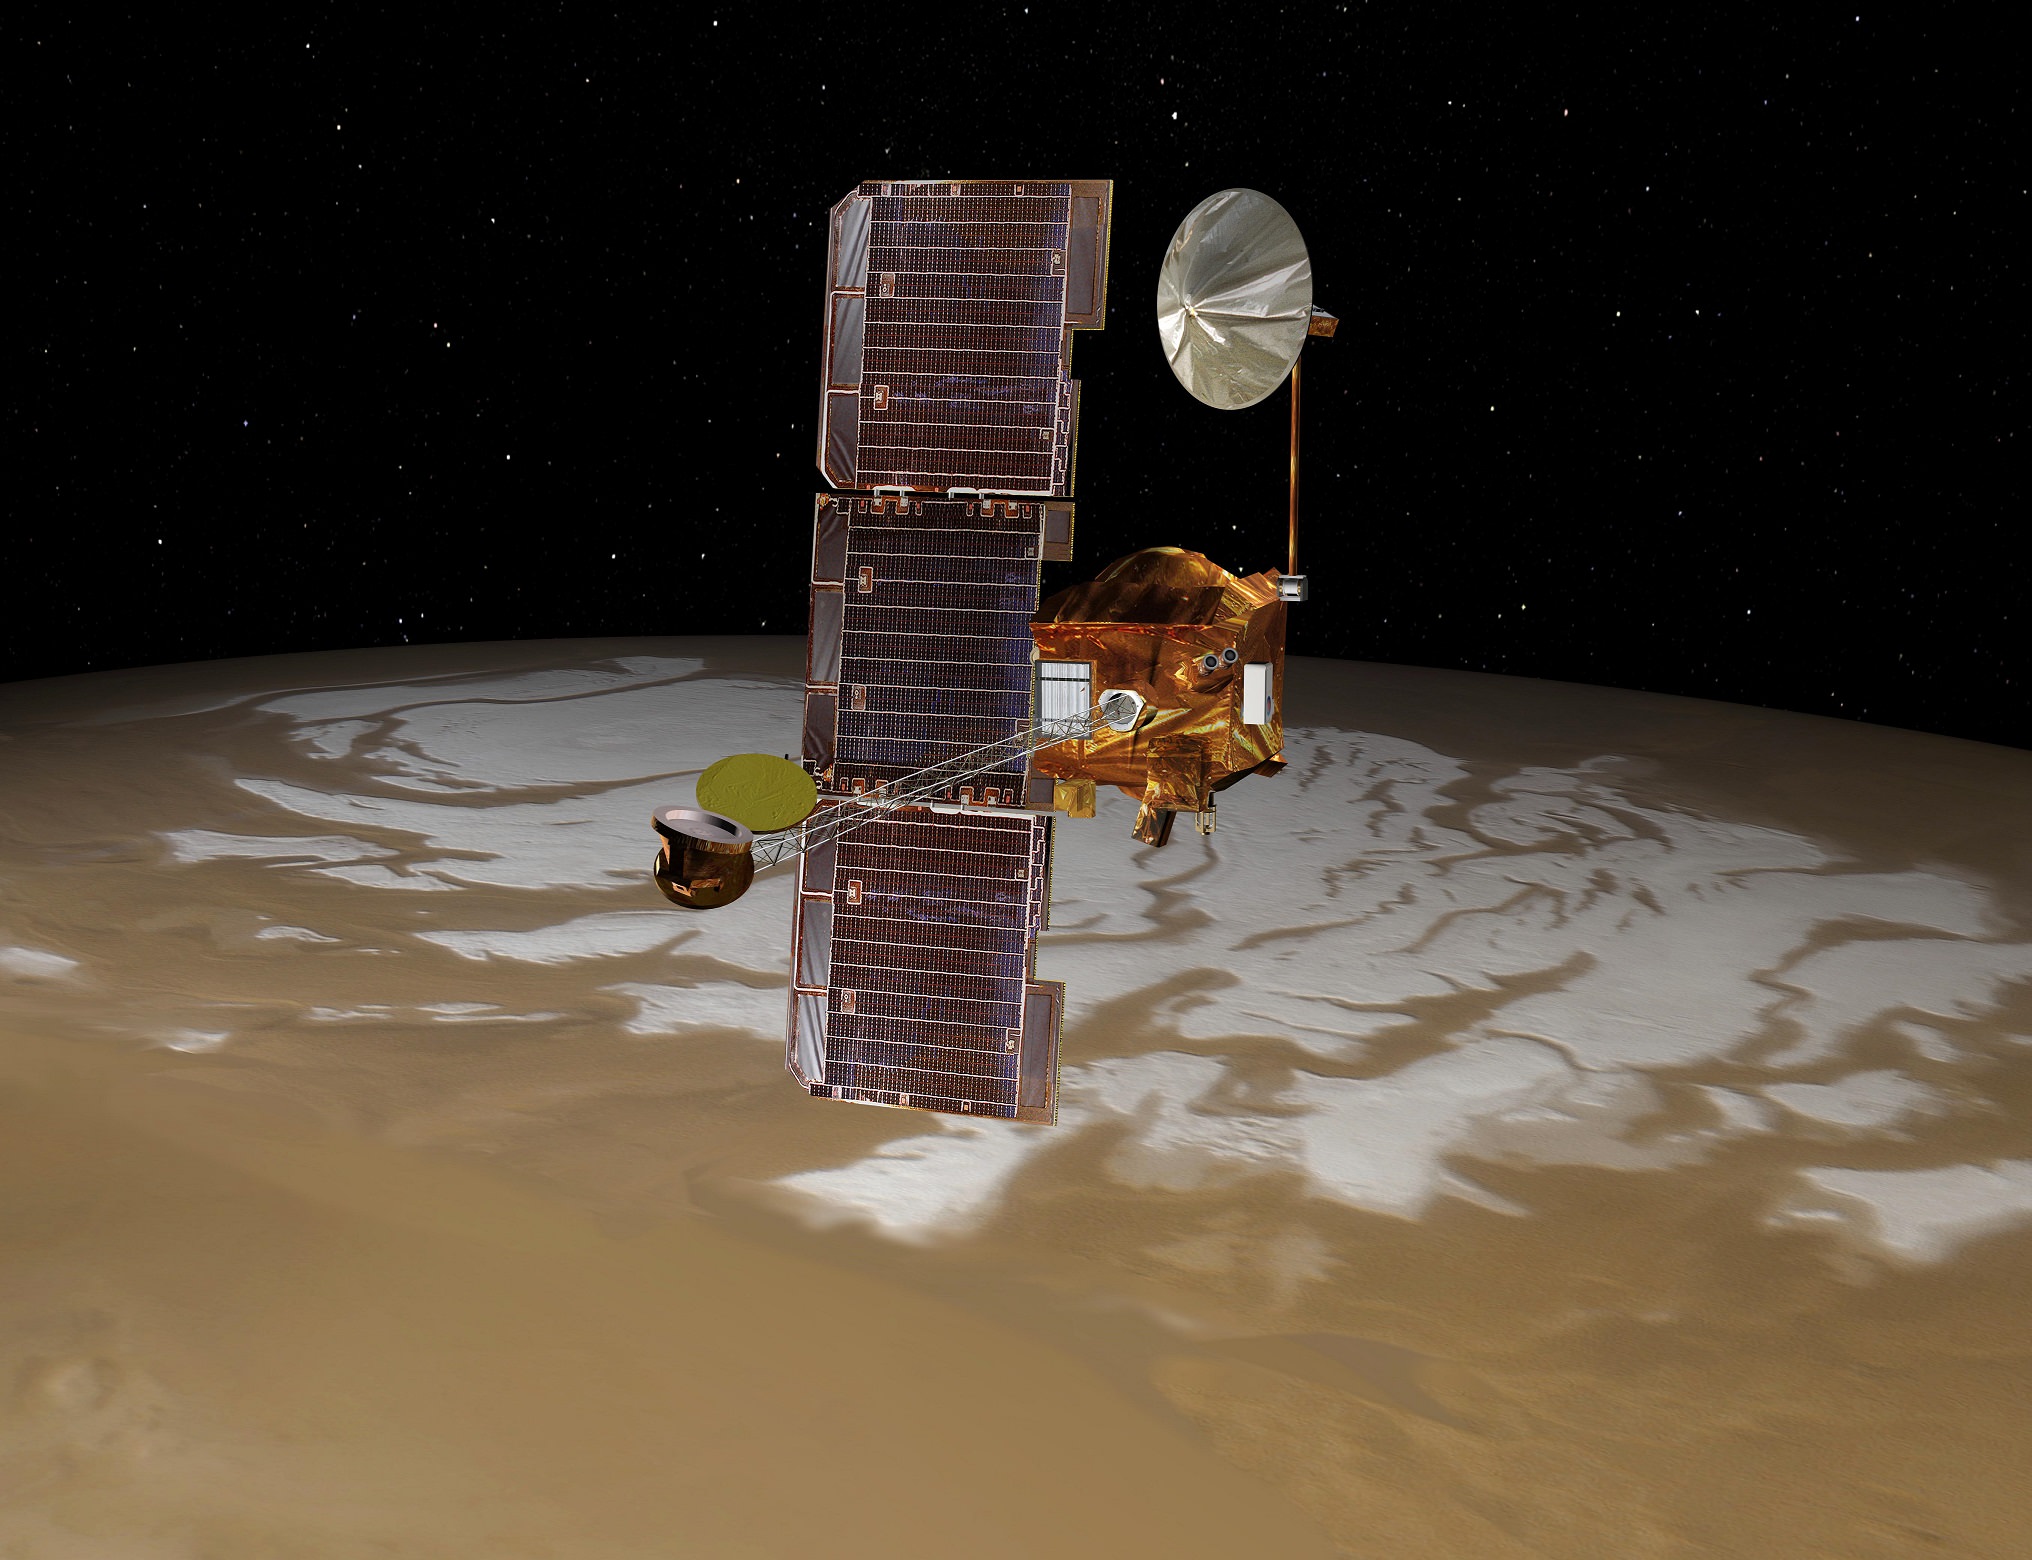
These features were noticed years ago by Professor Peter H. Schultz, a professor of geological science with the Department of Earth, Environmental, and Planetary Sciences (DEEPS) at Brown University. When studying images taken at night by the Mars Odyssey orbiter using its THEMIS instrument, he noticed steaks that only appeared when imaged in the infrared wavelength.
Artist’s conception of the Mars Odyssey spacecraft. Credit: NASA/JPL
These streaks were only visible in IR because it was only at this wavelength that contrasts in heat retention on the surface were visible. Essentially, brighter regions at night indicate surfaces that retain more heat during the day and take longer to cool. As Schultz explained in a Brown University press release, this allowed for features to be discerned that would otherwise not be noticed:
“You couldn’t see these things at all in visible wavelength images, but in the nighttime infrared they’re very bright. Brightness in the infrared indicates blocky surfaces, which retain more heat than surfaces covered by powder and debris. That tells us that something came along and scoured those surfaces bare.”
Along with Stephanie N. Quintana, a graduate student from DEEPS, the two began to consider other explanations that went beyond basic ejecta patterns. As they indicate in their study – which recently appeared in the journal Icarus under the title “Impact-generated winds on Mars” – this consisted of combining geological observations, laboratory impact experiments and computer modeling of impact processes.
Ultimately, Schultz and Quintana concluded that crater-forming impacts led to vortex-like storms that reached speeds of up to 800 km/h (500 mph) – in other words, the equivalent of an F8 tornado here on Earth. These storms would have scoured the surface and ultimately led to the observed streak patterns. This conclusion was based in part on work Schultz has done in the past at NASA’s Vertical Gun Range.
An infrared image revealing strange bright streaks extending from Santa Fe crater on Mars. Credit: NASA/JPL-Caltech/Arizona State University.
This high-powered cannon, which can fire projectiles at speeds up to 24,000 km/h (15,000 mph), is used to conduct impact experiments. These experiments have shown that during an impact event, vapor plumes travel outwards from the impact point (just above the surface) at incredible speeds. For the sake of their study, Schultz and Quintana scaled the size of the impacts up, to the point where they corresponded to the impact craters on Mars.
The results indicated that the vapor plume speed would be supersonic, and that its interaction with the Martian atmosphere would generate powerful winds. However, the plume and associated winds would not be responsible for the strange streaks themselves. Since they would be travelling just above the surface, they would not be capable of causing the kind of deep scouring that exists in the streaked areas.
Instead, Schultz and Quintana showed that when the plume struck a raised surface feature – like the ridges of a smaller impact crater – it would create more powerful vortices that would then fall to the surface. It is these, according to their study, that are responsible for the scouring patterns they observed. This conclusion was based on the fact that bright streaks were almost always associated with the downward side of a crater rim.
IR images showing the correlation between the streaks and smaller craters that were in place when the larger crater was formed. Credit: NASA/JPL-Caltech/Arizona State University
As Schultz explained, the study of these streaks could prove useful in helping to establish that rate at which erosion and dust deposition occurs on the Martian surface in certain areas:
“Where these vortices encounter the surface, they sweep away the small particles that sit loose on the surface, exposing the bigger blocky material underneath, and that’s what gives us these streaks. We know these formed at the same time as these large craters, and we can date the age of the craters. So now we have a template for looking at erosion.”
In addition, these streaks could reveal additional information about the state of Mars during the time of impacts. For example, Schultz and Quintana noted that the streaks appear to form around craters that are about 20 km (12.4 mi) in diameter, but not always. Their experiments also revealed that the presence of volatile compounds (such as surface or subsurface water ice) would affect the amount of vapor generated by an impact.
In other words, the presence of streaks around some craters and not others could indicate where and when there was water ice on the Martian surface in the past. It has been known for some time that the disappearance of Mars’ atmosphere over the course of several hundred million years also resulted in the loss of its surface water. By being able to put dates to impact events, we might be able to learn more about Mars’ fateful transformation.
The study of these streaks could also be used to differentiate between the impacts of asteroids and comets on Mars – the latter of which would have had higher concentrations of water ice in them. Once again, detailed studies of Mars’ surface features are allowing scientists to construct a more detailed timeline of its evolution, thus determining how and when it became the cold, dry place we know today!
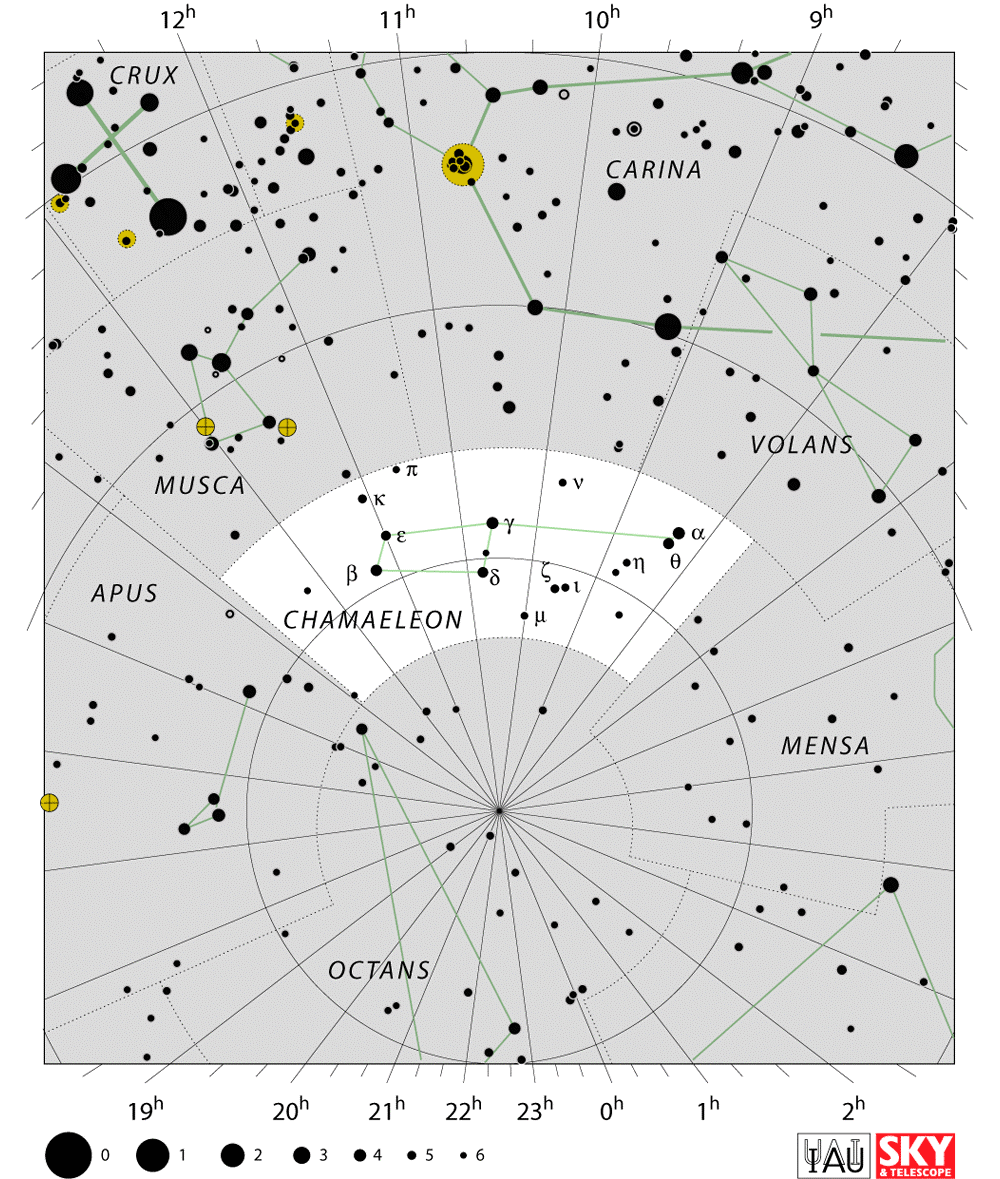
The Constellation Chamaeleon. Credit: Till Credner/AlltheSky.com
Welcome back to Constellation Friday! Today, in honor of the late and great Tammy Plotner, we will be dealing with that famous lizard that specializes at blending in – the Chamaeleon constellation!
In the 2nd century CE, Greek-Egyptian astronomer Claudius Ptolemaeus (aka. Ptolemy) compiled a list of all the then-known 48 constellations. This treatise, known as the Almagest, would be used by medieval European and Islamic scholars for over a thousand years to come, effectively becoming astrological and astronomical canon until the early Modern Age.
In time, this list would come to be expanded as astronomers became aware of more asterisms in the night sky. One of these is Chamaeleon, a small constellation located in the southern sky that was first defined in the 16th century. This constellation was appropriately named, given its ability to blend into the background! Today, it is one of the 88 constellations recognized by the IAU.
Name and Meaning:
Since Chamaeleon was unknown to the ancient Greeks and Romans, it has no mythology associated with it, but it’s not hard to understand how it came about its fanciful name. As exploration of the southern hemisphere began, what biological wonders were discovered! Can you imagine how odd a creature that could change its skin color to match its surroundings would be to someone who wasn’t familiar with lizards?
Map of the dark molecular clouds associated with the Chamaeleon constellation. Credit: Roberto Mura
Small wonder that a constellation that blended right in with the background stars could be considered a “chamaeleon” or that it might be pictured sticking its long tongue out to capture its insectile constellation neighbor – Musca the “fly”!
History of Observation:
Chamaeleon was one of twelve constellations created by Pieter Dirkszoon Keyser and Frederick de Houtman between 1595 and 1597. Both were Dutch navigators and early astronomical explorers who made attempts to chart southern hemisphere skies. Their work was added to Johann Bayer’s “Uranometeria” catalog in 1603, where Chamaeleon was first introduced as one of the 12 new southern constellations and its stars given Bayer designations.
To this day, Chamaeleon remain as one of the 88 modern constellations recognized by the IAU and it is bordered by Musca, Carina, Volans, Mensa, Octans and Apus. It contains only 3 main stars, the brightest of which is 4th magnitude Alpha – but it also has 16 Bayer/Flamsteed designated stars within its boundaries.
Notable Features:
The Chamaeleon constellation is home to several notable stars. These include Alpha Chamaeleontis, a spectral type F5III star located approximately 63.5 light years from Earth. Beta Chamaeleontis is a main sequence star that is approximately 270 light years distant. This star is the third brightest in the constellation, after Alpha and Gamma Chamaeleontis.
Artist’s concept of “hot Jupiter”, a Jupiter-sized planet orbiting closely to its star. Credit: NASA/JPL-Caltech
And then there’s HD 63454, a K-type main sequence star located approximately 116.7 light years away. It lies near the south celestial pole and is slightly cooler and less luminous than the Sun. In February of 2005, a hot Jupiter-like planet (HD 63454 b) was discovered orbiting the star.
The “Chamaeleon” also disguises itself with a huge number of dark molecular clouds that are often referred to as the “Chamaeleon Cloud Complex”. Situation about 15 degrees below the galactic plane, it is accepted is one of the closest low mass star forming regions to the Sun with a distance of about 400 to 600 light years.
Within these clouds are pre-main sequence star candidates, and low-mass T Tauri stars. The southern region of the Chamaeleon Cloud is a complex pattern of dark knots connected by elongated, dark, wavy filaments, with a serpentine-like shape. Bright rims with finger-like extensions are apparent, and a web of very faint, extremely thin but very long and straight shining filaments.
These feeble structures, reflecting stellar light, extend over the entire Chamaeleon complex and are considered very young – not yet capable of the type of collapse needed to introduce major star formation. Thanks to Gemini Near Infrared Spectrograph (GNIRS) on Gemini South Telescope, a very faint infrared object confirmed – a very low-mass, newborn brown dwarf star and the lowest mass brown dwarf star found to date in the Chamaeleon I cloud complex.
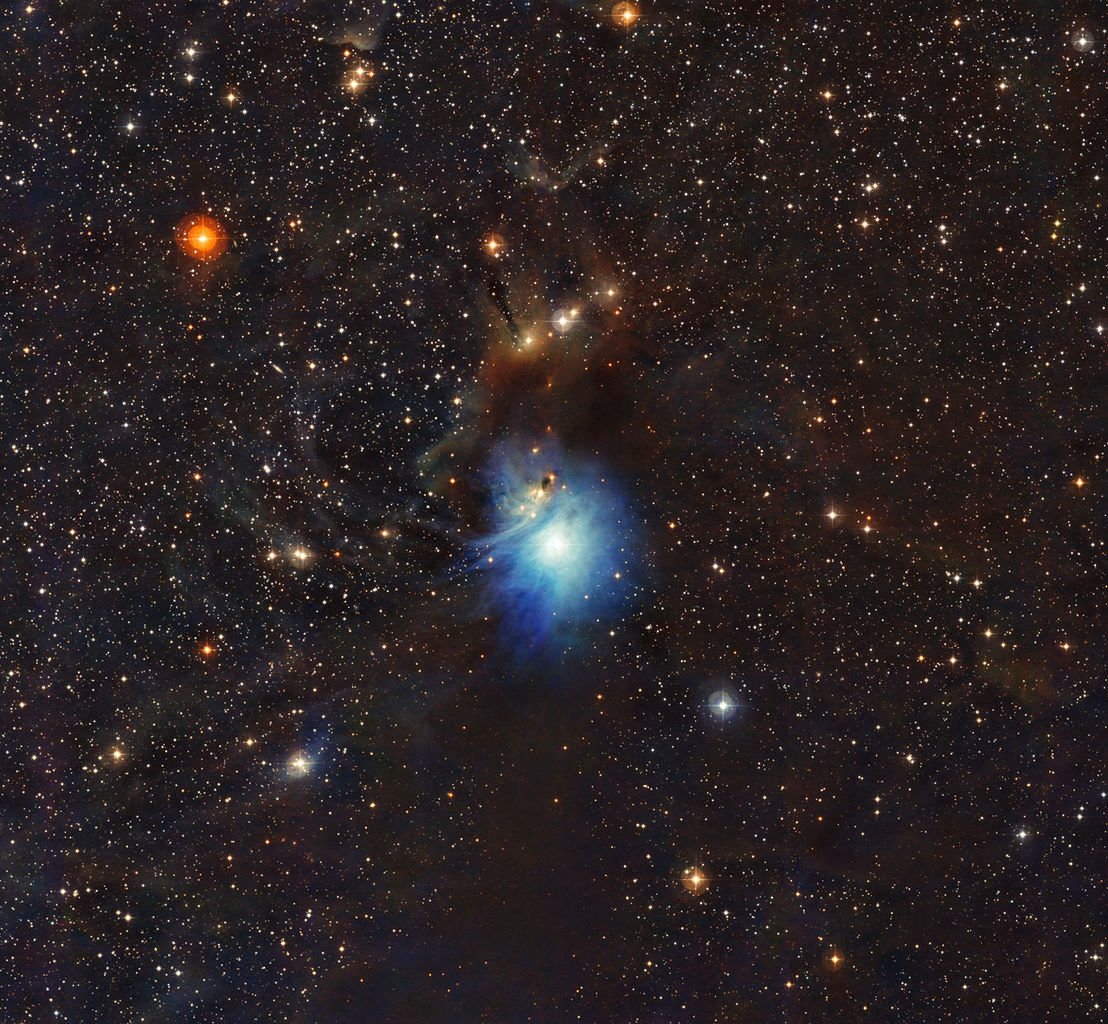
A newly formed star lights up the surrounding cosmic clouds in this image from ESO’s La Silla Observatory in Chile. Credit: ESO
Chamaeleon is also home to the Eta Chamaeleontis Cluster (aka. Mamajek 1). This open star cluster, which is centered on the star Eta Chamaeleontis, is approximately 316 light years distant and believed to be around eight million years old. The cluster was discovered in 1999 and consists of 12 or so relatively young stars. It was also the first open cluster discovered because of its X-ray emissions its member stars emit.
Finding Chamaeleon:
Chamaeleon is visible at latitudes between +0° and -90° and is best seen at culmination during the month of April. Now take out your telescope and aim it towards Eta for a look at newly discovered galactic star cluster – the Eta Chamaeleontis cluster – Mamajek 1. In 1999, a cluster of young, X-ray-emitting stars was found in the vicinity of eta Chamaeleontis from a deep ROSAT high-resolution imager observation.
They are believed to be pre-main-sequence weak-lined T Tauri stars, with an age of up to 12 million years old. The cluster itself is far from any significant molecular cloud and thus it has mysterious origins – not sharing proper motions with other young stars in the Chamaeleon region. There’s every possibility it could be a moving star cluster that’s a part of the Scorpius/Centaurus OB star association!
For binoculars, take a look at fourth magnitude Alpha Chamaeleontis. It is a rare class F white giant star that is about 63.5 light years from Earth. It is estimated to be about 1.5 billion years old. Its spectrum shows it to be a older giant with a dead helium core, yet its luminosity and temperature show it to be a younger dwarf.
The location of the Chamaeleon Constellation. Credit: IAU /Sky&Telescope magazine
Now point your binoculars or telescope towards Delta Chamaeleontis. While these two stars aren’t physically connect to one another, the visual double star is exceptionally pleasing with one orange component and one blue.
Last, but not least, take a look at Gamma Chamaeleontis. Although the south celestial pole currently lacks a bright star like Polaris to mark its position, the precession of the equinoxes will change that. One day – in the next 7500 years – the south celestial pole will pass close to the stars Gamma Chamaeleontis. But don’t wait up…
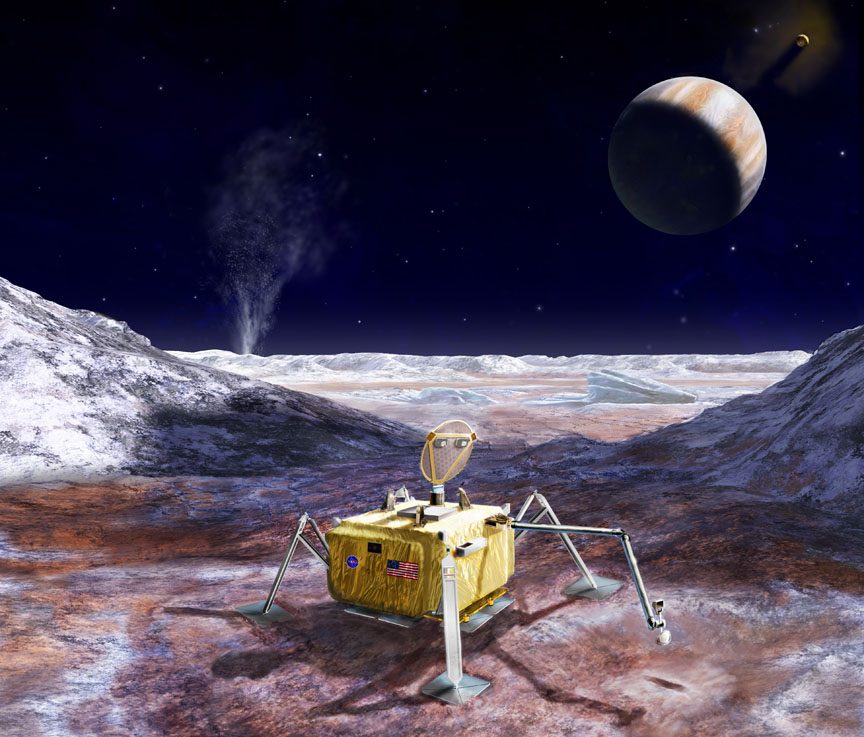
Artist's rendering of a possible Europa Lander mission, which would explore the surface of the icy moon in the coming decades. Credit:: NASA/JPL-Caltech
Between the Europa Clipper and the proposed Europa Lander, NASA has made it clear that it intends to send a mission to this icy moon of Jupiter in the coming decade. Ever since the Voyager 1 and 2 probes conducted their historic flybys of the moon in 1973 and 1974 – which offered the first indications of a warm-water ocean in the moon’s interior – scientists have been eager to peak beneath the surface and see what is there.
Towards this end, NASA has issued a grant to a team of researchers from Arizona State University to build and test a specially-designed seismometer that the lander would use to listen to Europa’s interior. Known as the Seismometer for Exploring the Subsurface of Europa (SESE), this device will help scientists determine if the interior of Europa is conducive to life.
According to the profile for the Europa Lander, this microphone would be mounted to the robotic probe. Once it reached the surface of the moon, the seismometer would begin collecting information on Europa’s subsurface environment. This would include data on its natural tides and movements within the shell, which would determine the icy surface’s thickness.
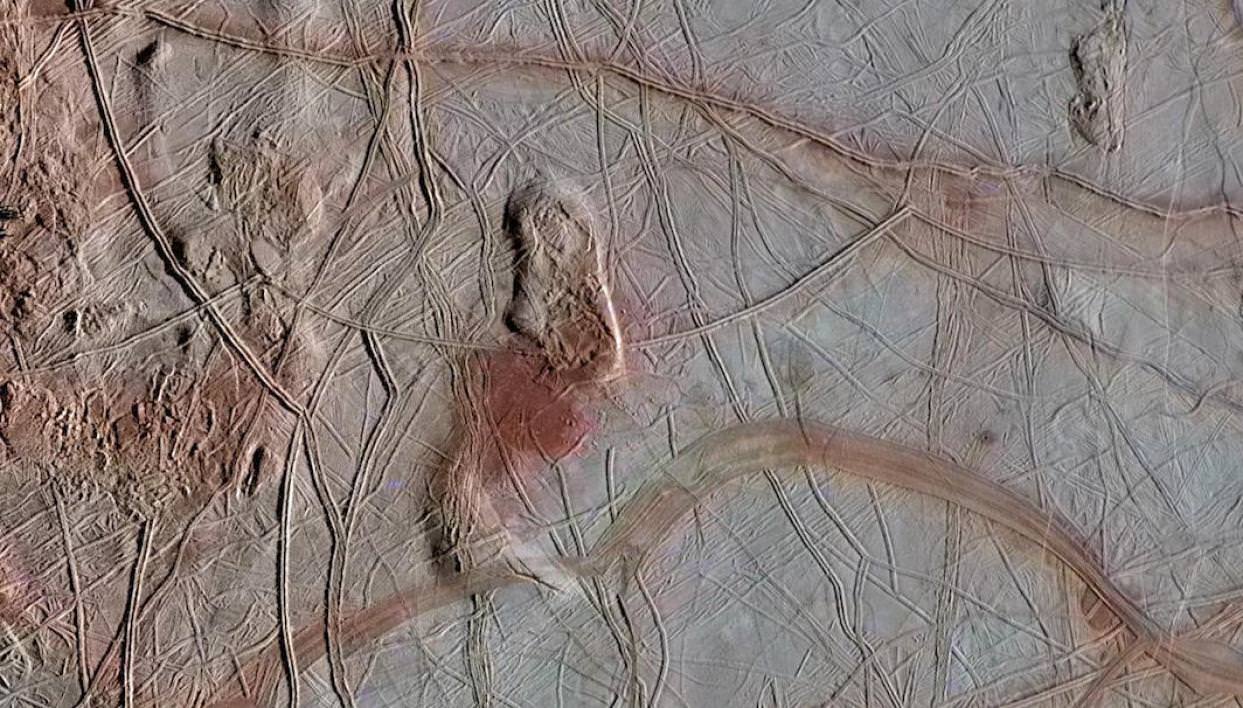
Image of Europa’s ice shell, taken by the Galileo spacecraft, of fractured “chaos terrain”. Credit: NASA/JPL-Caltech
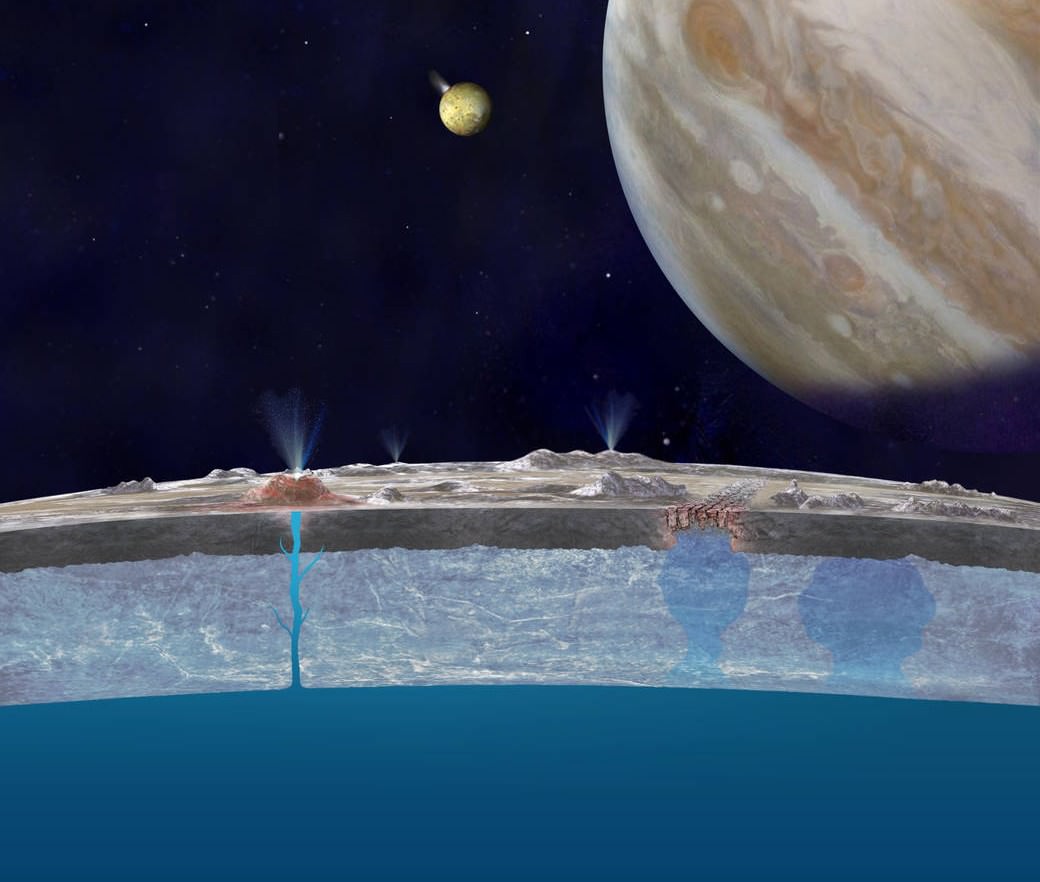
It would also determine if the surface has pockets of water – i.e. subsurface lakes – and see how often water rises to the surface. For some time, scientists have suspected that Europa’s “chaos terrain” would be the ideal place to search for evidence of life. These features, which are basically a jumbled mess of ridges, cracks, and plains, are believed to be spots where the subsurface ocean is interacting with the icy crust.
As such, any evidence of organic molecules or biological organisms would be easiest to find there. In addition, astronomers have also detected water plumes coming from Europa’s surface. These are also considered to be one of the best bets for finding evidence of life in the interior. But before they can be explored directly, determining where reservoirs of water reside beneath the ice and if they are connected to the interior ocean is paramount.
And this is where instruments like the SESE would come into play. Hongyu Yu is an exploration system engineer from ASU’s School of Earth and Space Exploration and the leader of the SESE team. As he stated in a recent article by ASU Now, “We want to hear what Europa has to tell us. And that means putting a sensitive ‘ear’ on Europa’s surface.”
While the idea of a Europa Lander is still in the concept-development stage, NASA is working to develop all the necessary components for such a mission. As such, they have provided the ASU team with a grant to develop and test their miniature seismometer, which measures no more than 10 cm (4 inches) on a side and could easily be fitted aboard a robotic lander.
Europa’s “Great Lake.” Scientists speculate many more exist throughout the shallow regions of the moon’s icy shell. Credit: Britney Schmidt/Dead Pixel FX/Univ. of Texas at Austin.
More importantly, their seismometer differs from conventional designs in that it does not rely on a mass-and-spring sensor. Such a design would be ill-suited for a mission to another body in our Solar System since it needs to be positioned upright, which requires that it be carefully planted and not disturbed. What’s more, the sensor needs to be placed within a complete vacuum to ensure accurate measurements.
By using a micro-electrical system with a liquid electrolyte for a sensor, Yu and his team have created a seismometer that can operate under a wider range of conditions. “Our design avoids all these problems,” he said. “This design has a high sensitivity to a wide range of vibrations, and it can operate at any angle to the surface. And if necessary, they can hit the ground hard on landing.”
As Lenore Dai – a chemical engineer and the director of the ASU’s School for Engineering of Matter, Transport and Energy – explained, the design also makes the SESE well suited for exploring extreme environments – like Europa’s icy surface. “We’re excited at the opportunity to develop electrolytes and polymers beyond their traditional temperature limits,” she said. “This project also exemplifies collaboration across disciplines.”
The SESE can also take a beating without compromising its sensor readings, which was tested when the team struck it with a sledgehammer and found that it still worked afterwards. According to seismologist Edward Garnero, who is also a member of the SESE team, this will come in handy. Landers typically have six to eight legs, he claims, which could be mated with seismometers to turn them into scientific instruments.
Artist’s concept of chloride salts bubbling up from Europa’s liquid ocean and reaching the frozen surface. Credit: NASA/JPL-Caltech
Having this many sensors on the lander would give scientists the ability to combine data, allowing them to overcome the issue of variable seismic vibrations recorded by each. As such, ensuring that they are rugged is a must.
“Seismometers need to connect with the solid ground to operate most effectively. If each leg carries a seismometer, these could be pushed into the surface on landing, making good contact with the ground. We can also sort out high frequency signals from longer wavelength ones. For example, small meteorites hitting the surface not too far away would produce high frequency waves, and tides of gravitational tugs from Jupiter and Europa’s neighbor moons would make long, slow waves.”
Such a device could also prove crucial to missions other “ocean worlds” within the Solar System, which include Ceres, Ganymede,Callisto,Enceladus, Titan and others. On these bodies as well, it is believed that life could very well exist in warm-water oceans that lie beneath the surface. As such, a compact, rugged seismometer that is capable of working in extreme-temperature environments would be ideal for studying their interiors.
What’s more, missions of this kind would be able to reveal where the ice sheets on these bodies are thinnest, and hence where the interior oceans are most accessible. Once that’s done, NASA and other space agencies will know exactly where to send in the probe (or possibly the robotic submarine). Though we might have to wait a few decades on that one!
An artist's illustration of a 16 meter segmented mirror space telescope. There are no actual images of LUVOIR because the design hasn't been finalized yet. Image: Northrop Grumman Aerospace Systems & NASA/STScI
We humans have an insatiable hunger to understand the Universe. As Carl Sagan said, “Understanding is Ecstasy.” But to understand the Universe, we need better and better ways to observe it. And that means one thing: big, huge, enormous telescopes.
In this series we’ll look at the world’s upcoming Super Telescopes:
The Large UV Optical Infrared Surveyor Telescope (LUVOIR)
There’s a whole generation of people who grew up with images from the Hubble Space Telescope. Not just in magazines, but on the internet, and on YouTube. But within another generation or two, the Hubble itself will seem quaint, and watershed events of our times, like the Moon Landing, will be just black and white relics of an impossibly distant time. The next generations will be fed a steady diet of images and discoveries stemming from the Super Telescopes. And the LUVOIR will be front and centre among those ‘scopes.
If you haven’t yet heard of LUVOIR, it’s understandable; LUVOIR is in the early stages of being defined and designed. But LUVOIR represents the next generation of space telescopes, and its power will dwarf that of its predecessor, the Hubble.
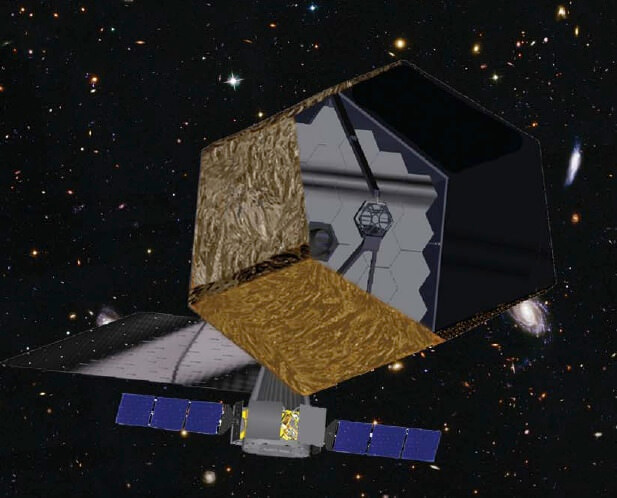
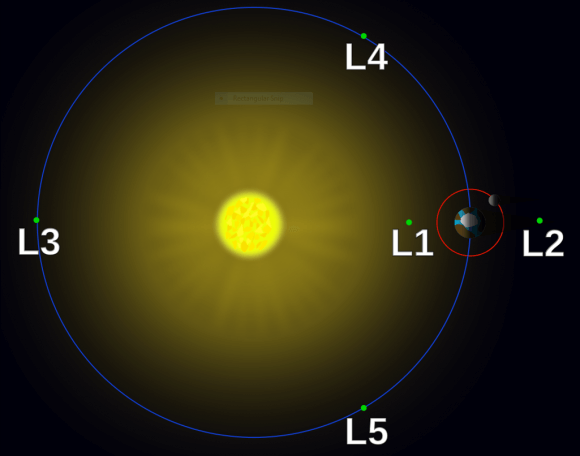
LUVOIR (its temporary name) will be a space telescope, and it will do its work at the LaGrange 2 point, the same place that JWST will be. L2 is a natural location for space telescopes. At the heart of LUVOIR will be a 15m segmented primary mirror, much larger than the Hubble’s mirror, which is a mere 2.4m in diameter. In fact, LUVOIR will be so large that the Hubble could drive right through the hole in the center of it.
This not-to-scale image of the Solar System shows the LaGrangian points. LUVOIR will be located in a halo orbit at L2, along with the JWST. Image: By Xander89 – File:Lagrange_points2.svg, CC BY 3.0, https://commons.wikimedia.org/w/index.php?curid=36697081
While the James Webb Space Telescope will be in operation much sooner than LUVOIR, and will also do amazing work, it will observe primarily in the infrared. LUVOIR, as its name makes clear, will have a wider range of observation more like Hubble’s. It will see in the Ultra-Violet spectrum, the Optical spectrum, and the Infrared spectrum.
Recently, Brad Peterson spoke with Fraser Cain on a weekly Space Hangout, where he outlined the plans for the LUVOIR. Brad is a recently retired Professor of Astronomy at the Ohio State University, where served as chair of the Astronomy Department for 9 years. He is currently the chair of the Science Committee at NASA’s Advisory Council. Peterson is also a Distinguished Visiting Astronomer at the Space Telescope Science Institute, and the chair of the astronomy section of the American Association for the Advancement of Science.
Different designs for LUVOIR have been discussed, but as Peterson points out in the interview above, the plan seems to have settled on a 15m segmented mirror. A 15m mirror is larger than any optical light telescope we have on Earth, though the Thirty Meter Telescope and others will soon be larger.
“Segmented telescopes are the technology of today when it comes to ground-based telescopes. The JWST has taken that technology into space, and the LUVOIR will take segmented design one step further,” Peterson said. But the segmented design of LUVOIR differs from the JWST in several ways.
“…the LUVOIR will take segmented design one step further.” – Brad Peterson
JWST’s mirrors are made of beryllium and coated with gold. LUVOIR doesn’t require the same exotic design. But it has other requirements that will push the envelope of segmented telescope design. LUVOIR will have a huge array of CCD sensors that will require an enormous amount of electrical power to operate.
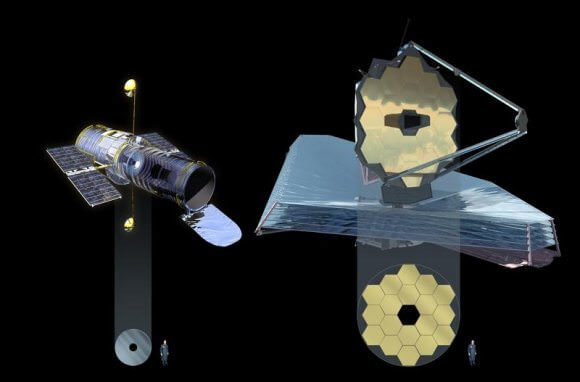
The Hubble Space Telescope on the left has a 2.4 meter mirror and the James Webb Space Telescope has a 6.5 meter mirror. LUVOIR, not shown, will dwarf them both with a massive 15 meter mirror. Image: NASA
LUVOIR will not be cryogenically cooled like the JWST is, because it’s not primarily an Infrared observatory. LUVOIR will also be designed to be serviceable. In fact, the US Congress now requires all space telescopes to be serviceable.
“Congress has mandated that all future large space telescopes must be serviceable if practicable.” – Brad Peterson
LUVOIR is designed to have a long life. It’s multiple instruments will be replaceable, and the hope is that it will last in space for 50 years. Whether it will be serviced by robots, or by astronauts, has not been determined. It may even be designed so that it could be brought back from L2 for servicing.
LUVOIR will contribute to the search for life on other worlds. A key requirement for LUVOIR is that it do spectroscopy on the atmospheres of distant planets. If you can do spectroscopy, then you can determine habitability, and, potentially, even if a planet is inhabited. This is the first main technological challenge for LUVOIR. This spectroscopy requires a powerful coronagraph to suppress the light of the stars that exoplanets orbit. LUVOIR’s coronagraph will excel at this, with a ratio of starlight suppression of 10 billion to 1. With this capability, LUVOIR should be able to do spectroscopy on the atmospheres of small, terrestrial exoplanets, rather than just larger gas giants.
“This telescope is going to be remarkable. The key science that it’s going to do be able to do is spectroscopy of planets in the habitable zone around nearby stars.” – Brad Peterson
This video from NASA’s Goddard Space Flight Center talks about the search for life, and how telescopes like LUVOIR will contribute to the search. At the 15:00 mark, Dr. Aki Roberge talks about how spectroscopy is key to finding signs of life on exoplanets, and how LUVOIR will take that search one step further.
Using spectroscopy to search for signs of life on exoplanets is just one of LUVOIR’s science goals.
LUVOIR is tasked with other challenges as well, including:
Mapping the distribution of dark matter in the Universe.
Isolating the source of gravitational waves.
Imaging circumstellar disks to see how planets form.
Identifying the first starlight in the Universe, studying early galaxies and finding the first black holes.
Studying surface features of worlds in our Solar System.
To tackle all these challenges, LUVOIR will have to clear other technological hurdles. One of them is the requirement for long exposure times. This puts enormous constraints on the stability of the scope, since its mirror is so large. A system of active supports for the mirror segments will help with stability. This is a trait it shares with other terrestrial Super Telescopes like the Thirty Meter Telescope and the European Extremely Large Telescope. Each of those had hundreds of segments which have to be controlled precisely with computers.
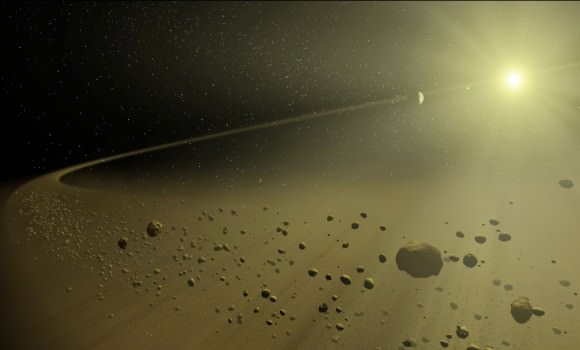
A circumstellar disk of debris around a matured stellar system may indicate that Earth-like planets lie within. LUVOIR will be able to see inside the disk to watch planets forming. Credit: NASA
LUVOIR’s construction, and how it will be placed in orbit are also significant considerations.
According to Peterson, LUVOIR could be launched on either of the heavy lift rockets being developed. The Falcon Heavy is being considered, as is the Space Launch System. The SLS Block 1B could do it, depending on the final size of LUVOIR.
“I’s going to require a heavy lift vehicle.” – Brad Peterson
Or, LUVOIR may never be launched into space. It could be assembled in space with pre-built components that are launched one at a time, just like the International Space Station. There are several advantages to that.
With assembly in space, the telescope doesn’t have to be built to withstand the tremendous force it takes to launch something into orbit. It also allows for testing when completed, before being sent to L2. Once the ‘scope was assembled and tested, a small ion propulsion engine could be used to power it to L2.
It’s possible that the infrastructure to construct LUVOIR in space will exist in a decade or two. NASA’s Deep Space Gateway in cis-lunar space is planned for the mid-20s. It would act as a staging point for deep-space missions, and for missions to the lunar surface.
LUVOIR is still in the early stages. The people behind it are designing it to meet as many of the science goals as they can, all within the technological constraints of our time. Planning has to start somewhere, and the plans presented by Brad Peterson represent the current thinking behind LUVOIR. But there’s still a lot of work to do.
“Typical time scale from selection to launch of a flagship mission is something like 20 years.” – Brad Peterson
As Peterson explains, LUVOIR will have to be chosen as NASA’s highest priority during the 2020 Decadal Survey. Once that occurs, then a couple more years are required to really flesh out the design of the mission. According to Peterson, “Typical time scale from selection to launch of a flagship mission is something like 20 years.” That gets us to a potential launch in the mid-2030s.
Along the way, LUVOIR will be given a more suitable name. James Webb, Hubble, Kepler and others have all had important missions named after them. Perhaps its Carl Sagan’s turn.
“The Carl Sagan Space Telescope” has a nice ring to it, doesn’t it?
Promotional poster for Alien: Covenant. Credit: 20th Century Fox
Promotional poster for Alien: Covenant. Credit: 20th Century Fox
Warning: mild plot spoilers ahead for the upcoming summer film Alien: Covenant, though we plan to focus more on the overall Alien sci-fi franchise and some of the science depicted in the movie.
So, are you excited for the 2017 movie season? U.S. Memorial Day weekend is almost upon us, and that means big ticket, explosion-laden sci-fi flicks and reboots/sequels. Lots of sequels. We recently got a chance to check out Alien: Covenant opening Thursday, May 18th as the second prequel and the seventh film (if you count 2004’s Alien vs. Predator offshoot) in the Alien franchise.
We’ll say right up front that we were both excited and skeptical to see the film… excited, because the early Alien films still stand as some of the best horror sci-fi ever made. But we were skeptical, as 2012’s Prometheus was lackluster at best. Plus, Prometheus hits you with an astronomical doozy in the form of the “alien star chart” right off the bat, not a great first step. Probably the best scene is Noomi Rapace’s terrifying self-surgery to remove the alien parasite. Mark Watney had to do something similar to remove the antenna impaled in his side in The Martian. Apparently, Ridley Scott likes to use this sort of scene to really gross audiences out. The second Aliens film probably stands as the benchmark for the series, and the third film lost fans almost immediately with the death of Newt at the very beginning, the girl Sigourney Weaver and crew fought so hard to save in Aliens.
How well does Alien: Covenant hold up? Well, while it was a better attempt at a prequel than Prometheus, it approaches though doesn’t surpass the iconic first two. Alien: Covenant is very similar to Aliens, right down to the same action beats.
The story opens as the crew of the first Earth interstellar colony ship Covenant heads towards a promised paradise planet Origae-6. En route, the crew receives a distress signal from the world where the ill-fated Prometheus disappeared, and detours to investigate. If you’ve never seen an Alien film before, we can tell you that investigating a mysterious transmission is always a very bad idea, as blood and gore via face-hugging parasites is bound to ensue. As with every Alien film, the crew of the Covenant is an entirely new cast, with Katherine Waterston as the new chief protagonist similar to Sigourney Weaver in the original films. And like any sci-fi horror film, expect few survivors.
Alien: Covenant is a worthy addition to the Alien franchise for fans who know what to expect, hearkening back to the original films. As a summer blockbuster, it has a bit of an uphill battle, with a slower opening before the real drama begins.
So how does the science of Alien: Covenant hold up?
The Good: Well, as with the earlier films, we always liked how the aliens in the franchise were truly, well, alien, not just human actors with cosmetic flourishes such as antennae or pointed ears. Humans are the result of evolutionary fortuity, assuring that an alien life form will trend more towards the heptapods in Arrival than Star Trek’s Mr. Spock. Still more is revealed about the parasitic aliens in Alien: Covenant, though the whole idea of a inter-genetic human alien hybrid advanced in the later films seems like a tall order… what if their DNA helix curled the wrong way? Or was triple or single, instead of double stranded?
Spaceships spin for gravity in the Alien universe, and I always liked Scott’s industrial-looking, gray steel and rough edges world in the Alien films, very 2001: A Space Odyssey.
Now, for a very few pedantic nit picks. You knew they were coming, right? In the opening scenes, the Covenant gets hit with a “neutrino burst” dramatically disabling the deployed solar array and killing a portion of the hibernating crew. Through neutrinos are real, they, for the most part, pass right through solid matter, with nary a hit. Millions are passing through you and me, right now. The burst is later described as due to a “stellar ignition event” (a flare? Maybe a nova?) Though the crew states there’s no way to predict these beforehand… but even today there is, as missions such as the Solar Dynamics Observatory and SOHO monitor Sol around the clock. And we do know which nearby stars such as Betelgeuse and Spica are likely to go supernova, and that red dwarfs are tempestuous flare stars. An interstellar colonization mission would (or at least should) know to monitor nearby stars (if any) for activity. True, a similar sort of maguffin in the form of the overblown Mars sandstorm was used in The Martian to get things rolling plot-wise, but we think maybe something like equally unpredictable bursts high-energy cosmic rays would be a bigger threat to an interstellar mission.
The crew also decides to detour while moving at presumably relativistic speeds to investigate the strange signal. This actually happens lots in sci-fi, as it seems as easy as running errands around town to simply hop from one world to the next. In reality, mass and change of momentum are costly affairs in terms of energy. In space, you want to get there quickly, but any interstellar mission would involve long stretches of slow acceleration followed by deceleration to enter orbit at your destination… changing this flight plan would be out of the question, even for the futuristic crew of the Covenant.
Expect a high body count: the crew of the Covenant. Credit: 20th Century Fox
Another tiny quibble: the Covenant’s computer pinpoints the source of the mysterious signal, and gives its coordinates in right ascension and declination. OK, this is good: RA and declination are part of a real coordinate system astronomers use to find things in the sky… here on Earth. It’s an equatorial system, though, hardly handy when you get out into space. Maybe a reference system using the plane of the Milky Way galaxy would be more useful.
But of course, had the crew of the Covenant uneventfully made it to Origae-6 and lived happily ever after stomach-exploding parasite free, there would be no film. Alien: Covenant is a worthy addition to the franchise and a better prequel attempt than Prometheus… though it doesn’t quite live up to the thrill ride of the first two, a tough act to follow in the realm of horror sci-fi.
Artists illustration of the expansion of the Universe (Credit: NASA, Goddard Space Flight Center)
What is the Universe? That is one immensely loaded question! No matter what angle one took to answer that question, one could spend years answering that question and still barely scratch the surface. In terms of time and space, it is unfathomably large (and possibly even infinite) and incredibly old by human standards. Describing it in detail is therefore a monumental task. But we here at Universe Today are determined to try!
So what is the Universe? Well, the short answer is that it is the sum total of all existence. It is the entirety of time, space, matter and energy that began expanding some 13.8 billion years ago and has continued to expand ever since. No one is entirely certain how extensive the Universe truly is, and no one is entirely sure how it will all end. But ongoing research and study has taught us a great deal in the course of human history.
Definition:
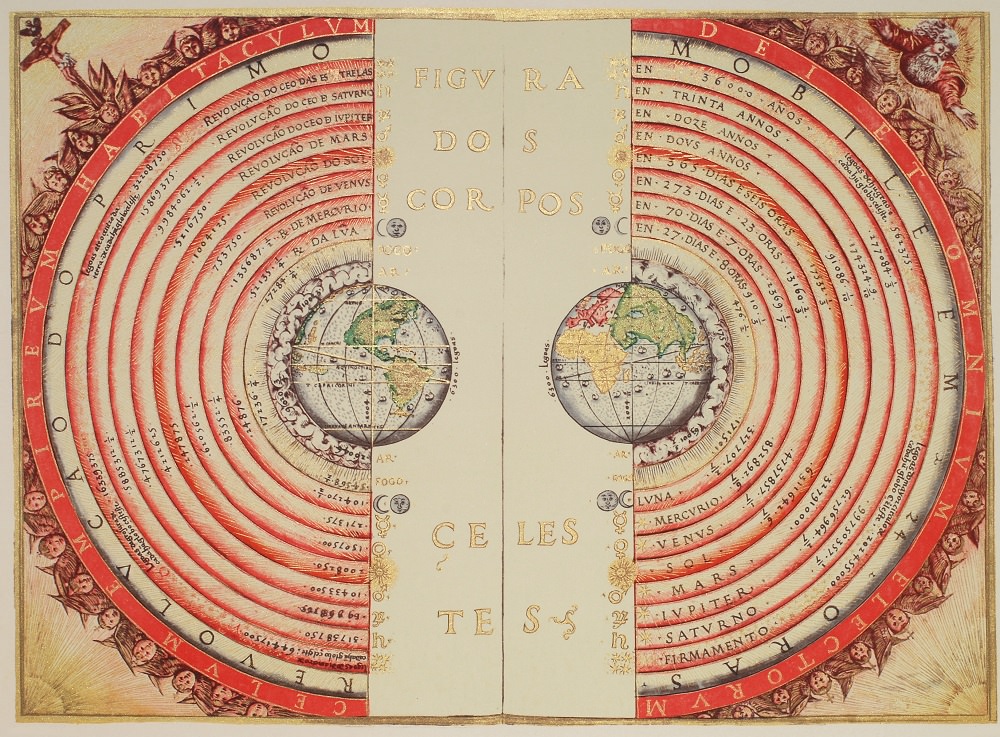
The term “the Universe” is derived from the Latin word “universum”, which was used by Roman statesman Cicero and later Roman authors to refer to the world and the cosmos as they knew it. This consisted of the Earth and all living creatures that dwelt therein, as well as the Moon, the Sun, the then-known planets (Mercury, Venus, Mars, Jupiter, Saturn) and the stars.
Illuminated illustration of the Ptolemaic geocentric conception of the Universe by Portuguese cosmographer and cartographer Bartolomeu Velho (?-1568) in his work Cosmographia (1568). Credit: Bibilotèque nationale de France, Paris
The term “cosmos” is often used interchangeably with the Universe. It is derived from the Greek word kosmos, which literally means “the world”. Other words commonly used to define the entirety of existence include “Nature” (derived from the Germanic word natur) and the English word “everything”, who’s use can be seen in scientific terminology – i.e. “Theory Of Everything” (TOE).
Today, this term is often to used to refer to all things that exist within the known Universe – the Solar System, the Milky Way, and all known galaxies and superstructures. In the context of modern science, astronomy and astrophysics, it also refers to all spacetime, all forms of energy (i.e. electromagnetic radiation and matter) and the physical laws that bind them.
Origin of the Universe:
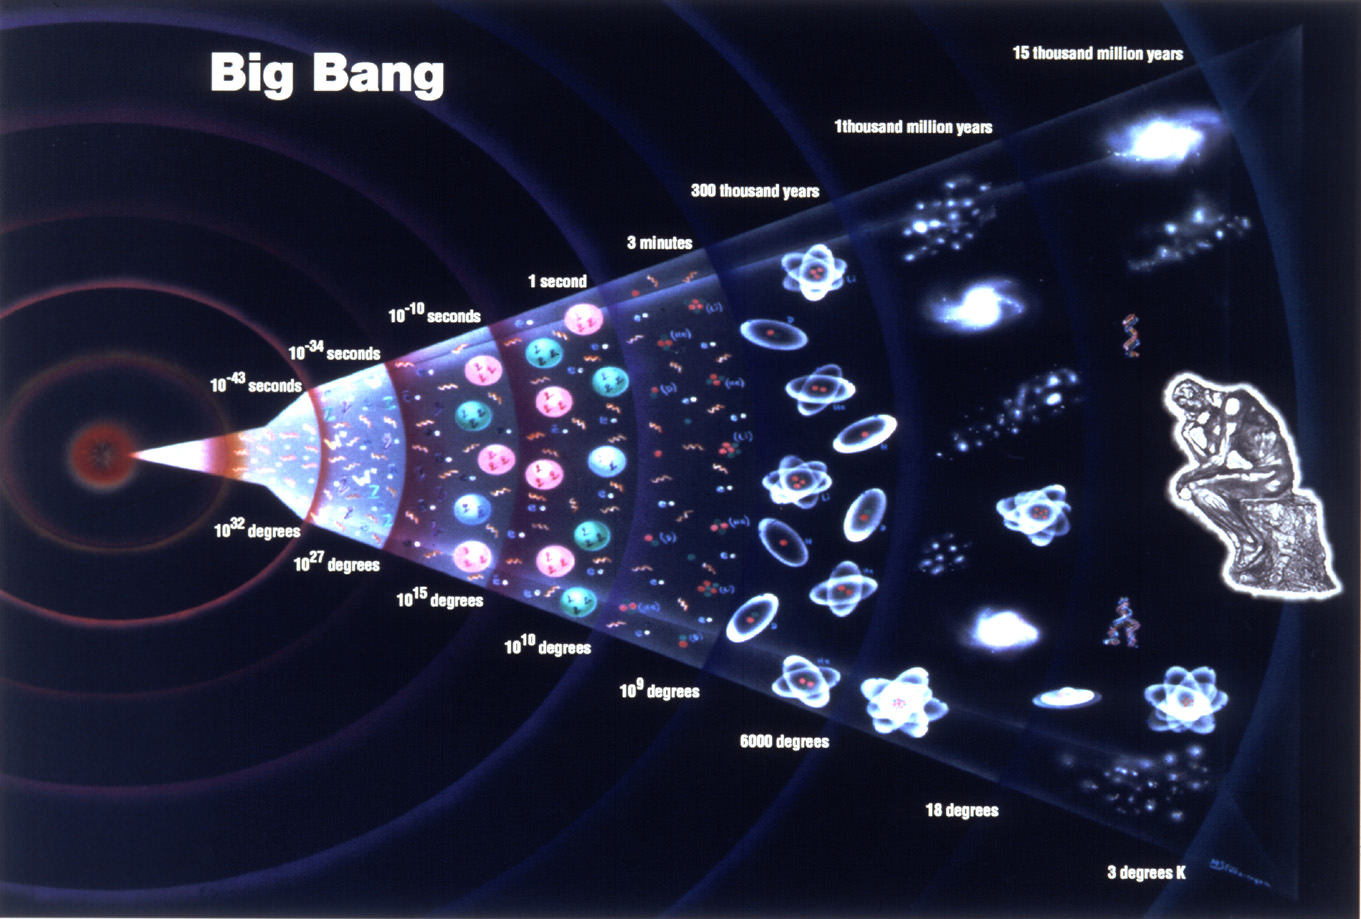
The current scientific consensus is that the Universe expanded from a point of super high matter and energy density roughly 13.8 billion years ago. This theory, known as the Big Bang Theory, is not the only cosmological model for explaining the origins of the Universe and its evolution – for example, there is the Steady State Theory or the Oscillating Universe Theory.
It is, however, the most widely-accepted and popular. This is due to the fact that the Big Bang theory alone is able to explain the origin of all known matter, the laws of physics, and the large scale structure of the Universe. It also accounts for the expansion of the Universe, the existence of the Cosmic Microwave Background, and a broad range of other phenomena.
The Big Bang Theory: A history of the Universe starting from a singularity and expanding ever since. Credit: grandunificationtheory.com
Working backwards from the current state of the Universe, scientists have theorized that it must have originated at a single point of infinite density and finite time that began to expand. After the initial expansion, the theory maintains that Universe cooled sufficiently to allow for the formation of subatomic particles, and later simple atoms. Giant clouds of these primordial elements later coalesced through gravity to form stars and galaxies.
This all began roughly 13.8 billion years ago, and is thus considered to be the age of the Universe. Through the testing of theoretical principles, experiments involving particle accelerators and high-energy states, and astronomical studies that have observed the deep Universe, scientists have constructed a timeline of events that began with the Big Bang and has led to the current state of cosmic evolution.
However, the earliest times of the Universe – lasting from approximately 10-43 to 10-11 seconds after the Big Bang – are the subject of extensive speculation. Given that the laws of physics as we know them could not have existed at this time, it is difficult to fathom how the Universe could have been governed. What’s more, experiments that can create the kinds of energies involved are in their infancy.
Still, many theories prevail as to what took place in this initial instant in time, many of which are compatible. In accordance with many of these theories, the instant following the Big Bang can be broken down into the following time periods: the Singularity Epoch, the Inflation Epoch, and the Cooling Epoch.
Also known as the Planck Epoch (or Planck Era), the Singularity Epoch was the earliest known period of the Universe. At this time, all matter was condensed on a single point of infinite density and extreme heat. During this period, it is believed that the quantum effects of gravity dominated physical interactions and that no other physical forces were of equal strength to gravitation.
This Planck period of time extends from point 0 to approximately 10-43 seconds, and is so named because it can only be measured in Planck time. Due to the extreme heat and density of matter, the state of the Universe was highly unstable. It thus began to expand and cool, leading to the manifestation of the fundamental forces of physics. From approximately 10-43 second and 10-36, the Universe began to cross transition temperatures.
It is here that the fundamental forces that govern the Universe are believed to have began separating from each other. The first step in this was the force of gravitation separating from gauge forces, which account for strong and weak nuclear forces and electromagnetism. Then, from 10-36 to 10-32 seconds after the Big Bang, the temperature of the Universe was low enough (1028 K) that electromagnetism and weak nuclear force were able to separate as well.
With the creation of the first fundamental forces of the Universe, the Inflation Epoch began, lasting from 10-32 seconds in Planck time to an unknown point. Most cosmological models suggest that the Universe at this point was filled homogeneously with a high-energy density, and that the incredibly high temperatures and pressure gave rise to rapid expansion and cooling.
This began at 10-37 seconds, where the phase transition that caused for the separation of forces also led to a period where the Universe grew exponentially. It was also at this point in time that baryogenesis occurred, which refers to a hypothetical event where temperatures were so high that the random motions of particles occurred at relativistic speeds.
As a result of this, particle–antiparticle pairs of all kinds were being continuously created and destroyed in collisions, which is believed to have led to the predominance of matter over antimatter in the present Universe. After inflation stopped, the Universe consisted of a quark–gluon plasma, as well as all other elementary particles. From this point onward, the Universe began to cool and matter coalesced and formed.
As the Universe continued to decrease in density and temperature, the Cooling Epoch began. This was characterized by the energy of particles decreasing and phase transitions continuing until the fundamental forces of physics and elementary particles changed into their present form. Since particle energies would have dropped to values that can be obtained by particle physics experiments, this period onward is subject to less speculation.
For example, scientists believe that about 10-11 seconds after the Big Bang, particle energies dropped considerably. At about 10-6 seconds, quarks and gluons combined to form baryons such as protons and neutrons, and a small excess of quarks over antiquarks led to a small excess of baryons over antibaryons.
Since temperatures were not high enough to create new proton-antiproton pairs (or neutron-anitneutron pairs), mass annihilation immediately followed, leaving just one in 1010 of the original protons and neutrons and none of their antiparticles. A similar process happened at about 1 second after the Big Bang for electrons and positrons.
After these annihilations, the remaining protons, neutrons and electrons were no longer moving relativistically and the energy density of the Universe was dominated by photons – and to a lesser extent, neutrinos. A few minutes into the expansion, the period known as Big Bang nucleosynthesis also began.
Thanks to temperatures dropping to 1 billion kelvin and energy densities dropping to about the equivalent of air, neutrons and protons began to combine to form the Universe’s first deuterium (a stable isotope of hydrogen) and helium atoms. However, most of the Universe’s protons remained uncombined as hydrogen nuclei.
After about 379,000 years, electrons combined with these nuclei to form atoms (again, mostly hydrogen), while the radiation decoupled from matter and continued to expand through space, largely unimpeded. This radiation is now known to be what constitutes the Cosmic Microwave Background (CMB), which today is the oldest light in the Universe.
As the CMB expanded, it gradually lost density and energy, and is currently estimated to have a temperature of 2.7260 ± 0.0013 K (-270.424 °C/ -454.763 °F ) and an energy density of 0.25 eV/cm3 (or 4.005×10⁻¹⁴ J/m3; 400–500 photons/cm3). The CMB can be seen in all directions at a distance of roughly 13.8 billion light years, but estimates of its actual distance place it at about 46 billion light years from the center of the Universe.
Evolution of the Universe:
Over the course of the several billion years that followed, the slightly denser regions of the Universe’s matter (which was almost uniformly distributed) began to become gravitationally attracted to each other. They therefore grew even denser, forming gas clouds, stars, galaxies, and the other astronomical structures that we regularly observe today.
This is what is known as the Structure Epoch, since it was during this time that the modern Universe began to take shape. This consisted of visible matter distributed in structures of various sizes (i.e. stars and planets to galaxies, galaxy clusters, and super clusters) where matter is concentrated, and which are separated by enormous gulfs containing few galaxies.
The details of this process depend on the amount and type of matter in the Universe. Cold dark matter, warm dark matter, hot dark matter, and baryonic matter are the four suggested types. However, the Lambda-Cold Dark Matter model (Lambda-CDM), in which the dark matter particles moved slowly compared to the speed of light, is the considered to be the standard model of Big Bang cosmology, as it best fits the available data.
In this model, cold dark matter is estimated to make up about 23% of the matter/energy of the Universe, while baryonic matter makes up about 4.6%. The Lambda refers to the Cosmological Constant, a theory originally proposed by Albert Einstein that attempted to show that the balance of mass-energy in the Universe remains static.
In this case, it is associated with dark energy, which served to accelerate the expansion of the Universe and keep its large-scale structure largely uniform. The existence of dark energy is based on multiple lines of evidence, all of which indicate that the Universe is permeated by it. Based on observations, it is estimated that 73% of the Universe is made up of this energy.
During the earliest phases of the Universe, when all of the baryonic matter was more closely space together, gravity predominated. However, after billions of years of expansion, the growing abundance of dark energy led it to begin dominating interactions between galaxies. This triggered an acceleration, which is known as the Cosmic Acceleration Epoch.
When this period began is subject to debate, but it is estimated to have began roughly 8.8 billion years after the Big Bang (5 billion years ago). Cosmologists rely on both quantum mechanics and Einstein’s General Relativity to describe the process of cosmic evolution that took place during this period and any time after the Inflationary Epoch.
Through a rigorous process of observations and modeling, scientists have determined that this evolutionary period does accord with Einstein’s field equations, though the true nature of dark energy remains illusive. What’s more, there are no well-supported models that are capable of determining what took place in the Universe prior to the period predating 10-15 seconds after the Big Bang.
However, ongoing experiments using CERN’s Large Hadron Collider (LHC) seek to recreate the energy conditions that would have existed during the Big Bang, which is also expected to reveal physics that go beyond the realm of the Standard Model.
Any breakthroughs in this area will likely lead to a unified theory of quantum gravitation, where scientists will finally be able to understand how gravity interacts with the three other fundamental forces of the physics – electromagnetism, weak nuclear force and strong nuclear force. This, in turn, will also help us to understand what truly happened during the earliest epochs of the Universe.
Structure of the Universe:
The actual size, shape and large-scale structure of the Universe has been the subject of ongoing research. Whereas the oldest light in the Universe that can be observed is 13.8 billion light years away (the CMB), this is not the actual extent of the Universe. Given that the Universe has been in a state of expansion for billion of years, and at velocities that exceed the speed of light, the actual boundary extends far beyond what we can see.
Our current cosmological models indicate that the Universe measures some 91 billion light years (28 billion parsecs) in diameter. In other words, the observable Universe extends outwards from our Solar System to a distance of roughly 46 billion light years in all directions. However, given that the edge of the Universe is not observable, it is not yet clear whether the Universe actually has an edge. For all we know, it goes on forever!
Diagram showing the Lambda-CBR Universe, from the Big Bang to the the current era. Credit: Alex Mittelmann/Coldcreation
Within the observable Universe, matter is distributed in a highly structured fashion. Within galaxies, this consists of large concentrations – i.e. planets, stars, and nebulas – interspersed with large areas of empty space (i.e. interplanetary space and the interstellar medium).
Things are much the same at larger scales, with galaxies being separated by volumes of space filled with gas and dust. At the largest scale, where galaxy clusters and superclusters exist, you have a wispy network of large-scale structures consisting of dense filaments of matter and gigantic cosmic voids.
In terms of its shape, spacetime may exist in one of three possible configurations – positively-curved, negatively-curved and flat. These possibilities are based on the existence of at least four dimensions of space-time (an x-coordinate, a y-coordinate, a z-coordinate, and time), and depend upon the nature of cosmic expansion and whether or not the Universe is finite or infinite.
A positively-curved (or closed) Universe would resemble a four-dimensional sphere that would be finite in space and with no discernible edge. A negatively-curved (or open) Universe would look like a four-dimensional “saddle” and would have no boundaries in space or time.
Various possible shapes of the observable Universe – where mass/energy density is too high; too low – or just right, so that Euclidean geometry where the three anles of a triable do add up to 180 degrees. Credit: Wikipedia Commons
In the former scenario, the Universe would have to stop expanding due to an overabundance of energy. In the latter, it would contain too little energy to ever stop expanding. In the third and final scenario – a flat Universe – a critical amount of energy would exist and its expansion woudl only halt after an infinite amount of time.
Fate of the Universe:
Hypothesizing that the Universe had a starting point naturally gives rise to questions about a possible end point. If the Universe began as a tiny point of infinite density that started to expand, does that mean it will continue to expand indefinitely? Or will it one day run out of expansive force, and begin retreating inward until all matter crunches back into a tiny ball?
Answering this question has been a major focus of cosmologists ever since the debate about which model of the Universe was the correct one began. With the acceptance of the Big Bang Theory, but prior to the observation of dark energy in the 1990s, cosmologists had come to agree on two scenarios as being the most likely outcomes for our Universe.
In the first, commonly known as the “Big Crunch” scenario, the Universe will reach a maximum size and then begin to collapse in on itself. This will only be possible if the mass density of the Universe is greater than the critical density. In other words, as long as the density of matter remains at or above a certain value (1-3 ×10-26 kg of matter per m³), the Universe will eventually contract.
Alternatively, if the density in the Universe were equal to or below the critical density, the expansion would slow down but never stop. In this scenario, known as the “Big Freeze”, the Universe would go on until star formation eventually ceased with the consumption of all the interstellar gas in each galaxy. Meanwhile, all existing stars would burn out and become white dwarfs, neutron stars, and black holes.
Very gradually, collisions between these black holes would result in mass accumulating into larger and larger black holes. The average temperature of the Universe would approach absolute zero, and black holes would evaporate after emitting the last of their Hawking radiation. Finally, the entropy of the Universe would increase to the point where no organized form of energy could be extracted from it (a scenarios known as “heat death”).
Modern observations, which include the existence of dark energy and its influence on cosmic expansion, have led to the conclusion that more and more of the currently visible Universe will pass beyond our event horizon (i.e. the CMB, the edge of what we can see) and become invisible to us. The eventual result of this is not currently known, but “heat death” is considered a likely end point in this scenario too.
Other explanations of dark energy, called phantom energy theories, suggest that ultimately galaxy clusters, stars, planets, atoms, nuclei, and matter itself will be torn apart by the ever-increasing expansion. This scenario is known as the “Big Rip”, in which the expansion of the Universe itself will eventually be its undoing.
History of Study:
Strictly speaking, human beings have been contemplating and studying the nature of the Universe since prehistoric times. As such, the earliest accounts of how the Universe came to be were mythological in nature and passed down orally from one generation to the next. In these stories, the world, space, time, and all life began with a creation event, where a God or Gods were responsible for creating everything.
Astronomy also began to emerge as a field of study by the time of the Ancient Babylonians. Systems of constellations and astrological calendars prepared by Babylonian scholars as early as the 2nd millennium BCE would go on to inform the cosmological and astrological traditions of cultures for thousands of years to come.
By Classical Antiquity, the notion of a Universe that was dictated by physical laws began to emerge. Between Greek and Indian scholars, explanations for creation began to become philosophical in nature, emphasizing cause and effect rather than divine agency. The earliest examples include Thales and Anaximander, two pre-Socratic Greek scholars who argued that everything was born of a primordial form of matter.
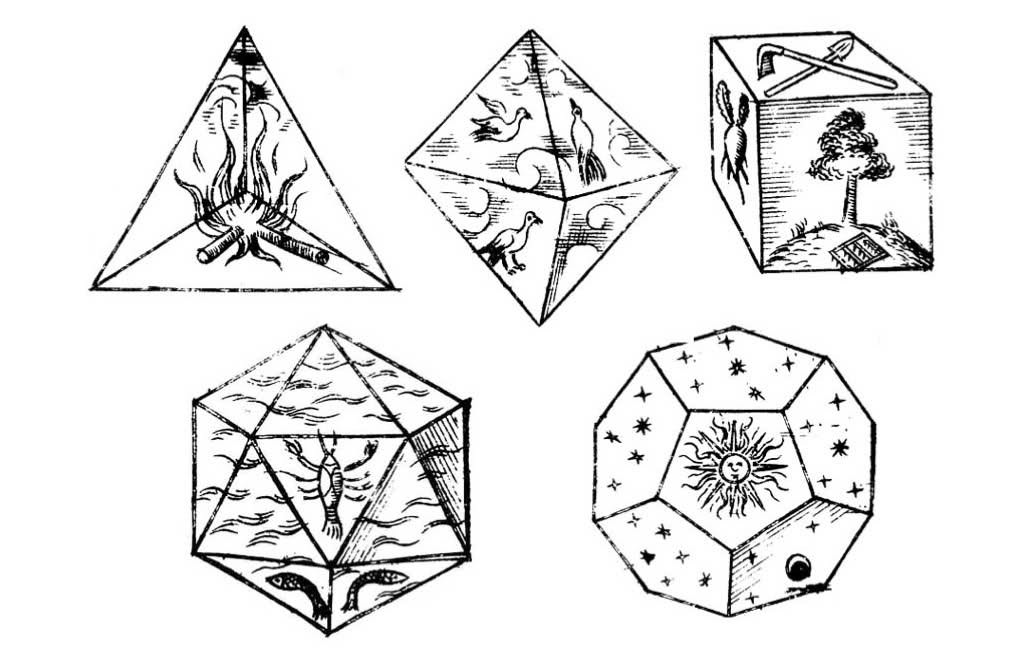
By the 5th century BCE, pre-Socratic philosopher Empedocles became the first western scholar to propose a Universe composed of four elements – earth, air, water and fire. This philosophy became very popular in western circles, and was similar to the Chinese system of five elements – metal, wood, water, fire, and earth – that emerged around the same time.
Early atomic theory stated that different materials had differently shaped atoms. Credit: github.com
It was not until Democritus, the 5th/4th century BCE Greek philosopher, that a Universe composed of indivisible particles (atoms) was proposed. The Indian philosopher Kanada (who lived in the 6th or 2nd century BCE) took this philosophy further by proposing that light and heat were the same substance in different form. The 5th century CE Buddhist philosopher Dignana took this even further, proposing that all matter was made up of energy.
The notion of finite time was also a key feature of the Abrahamic religions – Judaism, Christianity and Islam. Perhaps inspired by the Zoroastrian concept of the Day of Judgement, the belief that the Universe had a beginning and end would go on to inform western concepts of cosmology even to the present day.
Between the 2nd millennium BCE and the 2nd century CE, astronomy and astrology continued to develop and evolve. In addition to monitoring the proper motions of the planets and the movement of the constellations through the Zodiac, Greek astronomers also articulated the geocentric model of the Universe, where the Sun, planets and stars revolve around the Earth.
These traditions are best described in the 2nd century CE mathematical and astronomical treatise, the Almagest, which was written by Greek-Egyptian astronomer Claudius Ptolemaeus (aka. Ptolemy). This treatise and the cosmological model it espoused would be considered canon by medieval European and Islamic scholars for over a thousand years to come.
A comparison of the geocentric and heliocentric models of the Universe. Credit: history.ucsb.edu
However, even before the Scientific Revolution (ca. 16th to 18th centuries), there were astronomers who proposed a heliocentric model of the Universe – where the Earth, planets and stars revolved around the Sun. These included Greek astronomer Aristarchus of Samos (ca. 310 – 230 BCE), and Hellenistic astronomer and philosopher Seleucus of Seleucia (190 – 150 BCE).
During the Middle Ages, Indian, Persian and Arabic philosophers and scholars maintained and expanded on Classical astronomy. In addition to keeping Ptolemaic and non-Aristotelian ideas alive, they also proposed revolutionary ideas like the rotation of the Earth. Some scholars – such as Indian astronomer Aryabhata and Persian astronomers Albumasar and Al-Sijzi – even advanced versions of a heliocentric Universe.
By the 16th century, Nicolaus Copernicus proposed the most complete concept of a heliocentric Universe by resolving lingering mathematical problems with the theory. His ideas were first expressed in the 40-page manuscript titled Commentariolus (“Little Commentary”), which described a heliocentric model based on seven general principles. These seven principles stated that:
Celestial bodies do not all revolve around a single point
The center of Earth is the center of the lunar sphere—the orbit of the moon around Earth; all the spheres rotate around the Sun, which is near the center of the Universe
The distance between Earth and the Sun is an insignificant fraction of the distance from Earth and Sun to the stars, so parallax is not observed in the stars
The stars are immovable – their apparent daily motion is caused by the daily rotation of Earth
Earth is moved in a sphere around the Sun, causing the apparent annual migration of the Sun
Earth has more than one motion
Earth’s orbital motion around the Sun causes the seeming reverse in direction of the motions of the planets.
Frontispiece and title page of the Dialogue, 1632. Credit: moro.imss.fi.it
A more comprehensive treatment of his ideas was released in 1532, when Copernicus completed his magnum opus – De revolutionibus orbium coelestium(On the Revolutions of the Heavenly Spheres). In it, he advanced his seven major arguments, but in more detailed form and with detailed computations to back them up. Due to fears of persecution and backlash, this volume was not released until his death in 1542.
His ideas would be further refined by 16th/17th century mathematicians, astronomer and inventor Galileo Galilei. Using a telescope of his own creation, Galileo would make recorded observations of the Moon, the Sun, and Jupiter which demonstrated flaws in the geocentric model of the Universe while also showcasing the internal consistency of the Copernican model.
His observations were published in several different volumes throughout the early 17th century. His observations of the cratered surface of the Moon and his observations of Jupiter and its largest moons were detailed in 1610 with his Sidereus Nuncius (The Starry Messenger) while his observations were sunspots were described in On the Spots Observed in the Sun (1610).
Galileo also recorded his observations about the Milky Way in the Starry Messenger, which was previously believed to be nebulous. Instead, Galileo found that it was a multitude of stars packed so densely together that it appeared from a distance to look like clouds, but which were actually stars that were much farther away than previously thought.
In 1632, Galileo finally addressed the “Great Debate” in his treatise Dialogo sopra i due massimi sistemi del mondo (Dialogue Concerning the Two Chief World Systems), in which he advocated the heliocentric model over the geocentric. Using his own telescopic observations, modern physics and rigorous logic, Galileo’s arguments effectively undermined the basis of Aristotle’s and Ptolemy’s system for a growing and receptive audience.
Johannes Kepler advanced the model further with his theory of the elliptical orbits of the planets. Combined with accurate tables that predicted the positions of the planets, the Copernican model was effectively proven. From the middle of the seventeenth century onward, there were few astronomers who were not Copernicans.
When viewed in an inertial reference frame, an object either remains at rest or continues to move at a constant velocity, unless acted upon by an external force.
The vector sum of the external forces (F) on an object is equal to the mass (m) of that object multiplied by the acceleration vector (a) of the object. In mathematical form, this is expressed as: F=ma
When one body exerts a force on a second body, the second body simultaneously exerts a force equal in magnitude and opposite in direction on the first body.
Animated diagram showing the spacing of the Solar Systems planet’s, the unusually closely spaced orbits of six of the most distant KBOs, and the possible “Planet 9”. Credit: Caltech/nagualdesign
Together, these laws described the relationship between any object, the forces acting upon it, and the resulting motion, thus laying the foundation for classical mechanics. The laws also allowed Newton to calculate the mass of each planet, calculate the flattening of the Earth at the poles and the bulge at the equator, and how the gravitational pull of the Sun and Moon create the Earth’s tides.
His calculus-like method of geometrical analysis was also able to account for the speed of sound in air (based on Boyle’s Law), the precession of the equinoxes – which he showed were a result of the Moon’s gravitational attraction to the Earth – and determine the orbits of the comets. This volume would have a profound effect on the sciences, with its principles remaining canon for the following 200 years.
Another major discovery took place in 1755, when Immanuel Kant proposed that the Milky Way was a large collection of stars held together by mutual gravity. Just like the Solar System, this collection of stars would be rotating and flattened out as a disk, with the Solar System embedded within it.
Astronomer William Herschel attempted to actually map out the shape of the Milky Way in 1785, but he didn’t realize that large portions of the galaxy are obscured by gas and dust, which hides its true shape. The next great leap in the study of the Universe and the laws that govern it did not come until the 20th century, with the development of Einstein’s theories of Special and General Relativity.
Einstein’s groundbreaking theories about space and time (summed up simply as E=mc²) were in part the result of his attempts to resolve Newton’s laws of mechanics with the laws of electromagnetism (as characterized by Maxwell’s equations and the Lorentz force law). Eventually, Einstein would resolve the inconsistency between these two fields by proposing Special Relativity in his 1905 paper, “On the Electrodynamics of Moving Bodies“.
Basically, this theory stated that the speed of light is the same in all inertial reference frames. This broke with the previously-held consensus that light traveling through a moving medium would be dragged along by that medium, which meant that the speed of the light is the sum of its speed through a medium plus the speed of that medium. This theory led to multiple issues that proved insurmountable prior to Einstein’s theory.
Special Relativity not only reconciled Maxwell’s equations for electricity and magnetism with the laws of mechanics, but also simplified the mathematical calculations by doing away with extraneous explanations used by other scientists. It also made the existence of a medium entirely superfluous, accorded with the directly observed speed of light, and accounted for the observed aberrations.
Between 1907 and 1911, Einstein began considering how Special Relativity could be applied to gravity fields – what would come to be known as the Theory of General Relativity. This culminated in 1911 with the publications of “On the Influence of Gravitation on the Propagation of Light“, in which he predicted that time is relative to the observer and dependent on their position within a gravity field.
He also advanced what is known as the Equivalence Principle, which states that gravitational mass is identical to inertial mass. Einstein also predicted the phenomenon of gravitational time dilation – where two observers situated at varying distances from a gravitating mass perceive a difference in the amount of time between two events. Another major outgrowth of his theories were the existence of Black Holes and an expanding Universe.
In 1915, a few months after Einstein had published his Theory of General Relativity, German physicist and astronomer Karl Schwarzschild found a solution to the Einstein field equations that described the gravitational field of a point and spherical mass. This solution, now called the Schwarzschild radius, describes a point where the mass of a sphere is so compressed that the escape velocity from the surface would equal the speed of light.
In 1931, Indian-American astrophysicist Subrahmanyan Chandrasekhar calculated, using Special Relativity, that a non-rotating body of electron-degenerate matter above a certain limiting mass would collapse in on itself. In 1939, Robert Oppenheimer and others concurred with Chandrasekhar’s analysis, claiming that neutron stars above a prescribed limit would collapse into black holes.
Another consequence of General Relativity was the prediction that the Universe was either in a state of expansion or contraction. In 1929, Edwin Hubble confirmed that the former was the case. At the time, this appeared to disprove Einstein’s theory of a Cosmological Constant, which was a force which “held back gravity” to ensure that the distribution of matter in the Universe remained uniform over time.
To this, Edwin Hubble demonstrated using redshift measurements that galaxies were moving away from the Milky Way. What’s more, he showed that the galaxies that were farther from Earth appeared to be receding faster – a phenomena that would come to be known as Hubble’s Law. Hubble attempted to constrain the value of the expansion factor – which he estimated at 500 km/sec per Megaparsec of space (which has since been revised).
And then in 1931, Georges Lemaitre, a Belgian physicist and Roman Catholic priest, articulated an idea that would give rise to the Big Bang Theory. After confirming independently that the Universe was in a state of expansion, he suggested that the current expansion of the Universe meant that the father back in time one went, the smaller the Universe would be.
In other words, at some point in the past, the entire mass of the Universe would have been concentrated on a single point. These discoveries triggered a debate between physicists throughout the 1920s and 30s, with the majority advocating that the Universe was in a steady state (i.e. the Steady State Theory). In this model, new matter is continuously created as the Universe expands, thus preserving the uniformity and density of matter over time.
After World War II, the debate came to a head between proponents of the Steady State Model and proponents of the Big Bang Theory – which was growing in popularity. Eventually, the observational evidence began to favor the Big Bang over the Steady State, which included the discovery and confirmation of the CMB in 1965. Since that time, astronomers and cosmologists have sought to resolve theoretical problems arising from this model.
In the 1960s, for example, Dark Matter (originally proposed in 1932 by Jan Oort) was proposed as an explanation for the apparent “missing mass” of the Universe. In addition, papers submitted by Stephen Hawking and other physicists showed that singularities were an inevitable initial condition of general relativity and a Big Bang model of cosmology.
In 1981, physicist Alan Guth theorized a period of rapid cosmic expansion (aka. the “Inflation” Epoch) that resolved other theoretical problems. The 1990s also saw the rise of Dark Energy as an attempt to resolve outstanding issues in cosmology. In addition to providing an explanation as to the Universe’s missing mass (along with Dark Matter) it also provided an explanation as to why the Universe is still accelerating, and offered a resolution to Einstein’s Cosmological Constant.
Significant progress has been made in our study of the Universe thanks to advances in telescopes, satellites, and computer simulations. These have allowed astronomers and cosmologists to see farther into the Universe (and hence, farther back in time). This has in turn helped them to gain a better understanding of its true age, and make more precise calculations of its matter-energy density.
Illustration of the depth by which Hubble imaged galaxies in prior Deep Field initiatives, in units of the Age of the Universe. Credit: NASA and A. Feild (STScI)
For example, in June of 2016, NASA announced findings that indicate that the Universe is expanding even faster than previously thought. Based on new data provided by the Hubble Space Telescope (which was then compared to data from the WMAP and the Planck Observatory) it appeared that the Hubble Constant was 5% to 9% greater than expected.
Next-generation telescopes like the James Webb Space Telescope (JWST) and ground-based telescopes like the Extremely Large Telescope (ELT) are also expected to allow for additional breakthroughs in our understanding of the Universe in the coming years and decades.
Without a doubt, the Universe is beyond the reckoning of our minds. Our best estimates say hat it is unfathomably vast, but for all we know, it could very well extend to infinity. What’s more, its age in almost impossible to contemplate in strictly human terms. In the end, our understanding of it is nothing less than the result of thousands of years of constant and progressive study.
And in spite of that, we’ve only really begun to scratch the surface of the grand enigma that it is the Universe. Perhaps some day we will be able to see to the edge of it (assuming it has one) and be able to resolve the most fundamental questions about how all things in the Universe interact. Until that time, all we can do is measure what we don’t know by what we do, and keep exploring!
To speed you on your way, here is a list of topics we hope you will enjoy and that will answer your questions. Good luck with your exploration!
This illustration shows Cassini above Saturn's northern hemisphere prior to one of its 22 Grand Finale dives. Credit: NASA/JPL-Caltech
The Cassini spacecraft is nearing the end of its lifespan. This September, after spending the past twenty years in space – twelve and a half of which were dedicated to studying Saturn and its system of moons – the probe will be crash into Saturn’s atmosphere. But between now and then, the probe will be making its “Grand Finale” – the final phase of its mission where it will dive between the planet and its rings 22 times.
In addition to exploring this region of Saturn (something no other mission has done), the probe will also be using this opportunity to study Saturn’s hexagonal polar jet stream in greater detail. This persistent storm, which rages around Saturn’s northern polar region, has been a subject of interest for decades. And now that it enjoys full sunlight, Cassini will be able to directly image it with every pass it makes over Saturn’s north pole.
This persistent storm was first noticed in images sent back by the Voyager1 and 2 missions, which flew by Saturn in 1980 and 1981, respectively. As storms go, it is extremely massive, with each side measuring about 13,800 km (8,600 mi) in length – longer than the diameter of the Earth. It also rotates with a period of 10 hours 39 minutes and 24 seconds, which is assumed to be equal to the rotation of Saturn’s interior.
Image of Saturn’s hexagonal polar jet stream, taken by Cassini on Jan. 22nd, 2017. Credit: NASA/JPL-Caltech/Space Science Institute
When the Cassini spacecraft arrived around Saturn in 2004 to conduct the first part of its mission, this region was in shadow. This was due to the fact that the northern hemisphere was still coming out of winter, and was hence tilted away from the Sun. However, since Saturn began its summer solstice in May of 2017, the northern polar region is now fully illuminated – at least by Saturn’s standards.
In truth, between its distance from the Sun (an average of 9.5549 AU) and its axial tilt (26.73°), the northern polar region only gets about 1% as much sunlight as Earth does. And from the perspective of the north pole, the Sun is very low in the sky. Nevertheless, the sunlight falling on the north pole at this point is enough to allow the Cassini mission to directly image the region by capturing its reflected light.
Images of the hexagonal jet stream (like the one above) will be taken by Cassini’s wide-angle camera, which uses special filters that admit wavelengths of near-infrared light. Already, Cassini has captured some impressive imagery during its first plunge between Saturn and its rings (which took place on April 26th, 2017). The rapid-fire images acquired by one of Cassini’s cameras were then stitched together to create a movie (posted below).
As you can see, the movie begins with a view of the vortex at the center of the hexagon, then heads past the outer boundary of the jet stream and continues further southward. Toward the end of the movie, the spacecraft reorients itself to direct its saucer-shaped antenna in the direction of the spacecraft’s motion, which is apparent from the way the camera frame rotates.
The images that make up this movie were captured as the Cassini spacecraft dropped in altitude from 72,400 to 6,700 km (45,000 to 4,200 miles) above Saturn’s cloud tops. As this happened, the features which the camera could resolve changed drastically – going from 8.7 km (5.4 mi) per pixel to 810 meters (0.5 mi) per pixel.
The movie was produced by Kunio Sayanagi and John Blalock – an associate of the Cassini imaging team and a graduate research assistant (respectively) at Hampton University in Virginia – who collaborated with the Cassini imaging team. And thanks to this video, new insights are already being made into the hexagonal jet stream and the mechanisms that power it.
For example, as Sayanagi indicated in a NASA press release, the video captured the boundary regions of the jet stream rather nicely, which allowed him to note an interesting fact about them. “I was surprised to see so many sharp edges along the hexagon’s outer boundary,” he said. “Something must be keeping different latitudes from mixing to maintain those edges.”
Andrew Ingersoll, a member of the Cassini imaging team based at Caltech, expressed how similar movies will result from future plunges taken as part of the Grand Finale. “The images from the first pass were great, but we were conservative with the camera settings,” he said. “We plan to make updates to our observations for a similar opportunity on June 29th that we think will result in even better views.”
Between now and the end of the mission, who knows what we might learn about this mysterious storm? The next plunge – aka. Grand Finale Dive No. 4 – will take place on Sunday, May 15th at 4:42 p.m. UTC (12:42 p.m EDT; 9:42 a.m. PDT). A total of 22 dives will be made on a weekly basis before the probe takes the final plunge – the one that will cause it to breakup in Saturn’s atmosphere – on Friday, September 15th, 2017.
For more information, consult Cassini’s Grand Finale Orbit Guide. And be sure to enjoy this video of the final phase of the probe’s mission, courtesy of NASA:
Mining asteroids might be necessary for humanity to expand into the Solar System. But what effect would asteroid mining have on the world's economy? Credit: ESA.
Yesterday (on May 8th, 2017), an asteroid swung past Earth on its way towards the Sun. This Near Earth Object (NEO), known as 2017 HX4, measures between 10 and 33 meters (32.8 and 108 feet) and made its closest approach to Earth at 11:58 am UT (7:58 am EDT; 4:58 am PT). Naturally, there were surely those who wondered if this asteroid would hit us and trigger a terrible cataclysm!
But of course, like most NEOs that periodically make a close pass to Earth, 2017 HX4 passed us by at a very safe distance. In fact, the asteroid’s closest approach to Earth was estimated to be at a distance of 3.7 Lunar Distances (LD) – i.e. almost four times the distance between the Earth and the Moon. This, and other pertinent information was tweeted in advance by the International Astronomical Union’s Minor Planet Center (IAU MPC) on April 29th.
This object was first spotted on April 26th, 2017, using the 1.8 meter Panoramic Survey Telescope and Rapid Response System (Pan-STARRS), located at the summit of Haleakala in Hawaii. Since that time, it has been monitored by multiple telescopes around the world, and its tracking data and information about its orbit and other characteristics has been provided by the IAU MPC.
Interactive Orbit Sketch, showing the orbit of the Near Earth Object (NEO) known as 2017 HX4. Credit: IAU MPC
With funding provided by NASA’s Near-Earth Object Observations program, the IAU MPC maintains a centralized database that is responsible for the identification, designation and orbit computations of all the minor planets, comets and outer satellites of the Solar System. Since it’s inception, it has been maintaining information on 16,202 Near-Earth Objects, 729,626 Minor Planets, and 3,976 comets.
But it is the NEOs that are of particular interest, since they periodically make close approaches to Earth. In the case of 2017 HX4, the object has been shown to have an orbital period of 2.37 years, following a path that takes it from beyond the orbit of Venus to well beyond the orbit of Mars. In other words, it orbits our Sun at an average distance (semi-major axis) of 1.776 AU, ranging from about 0.88 AU at perihelion to 2.669 AU at aphelion.
PS1 at dawn. The mountain in the distance is Mauna Kea, about 130 kilometers southeast. Credit: pan-starrs.ifa.hawaii.edu
From these combined observations, the IAU MPC was able to compile information on the object’s orbital period, when it would cross Earth’s orbit, and just how close it would come to us in the process. So, as always, there was nothing to worry about here folks. These objects are always spotted before they cross Earth’s orbit, and their paths, periods and velocities and are known about in advance.
Even so, it’s worth noting that an object of this size was nowhere near to be large enough to cause an Extinction Level Event. In fact, the asteroid that struck Earth 65 millions year ago at the end of Cretaceous era – which created the Chicxulub Crater on the Yucatan Peninsula in Mexico and caused the extinction of the dinosaurs – was estimated to measure 10 km across.
At 10 to 33 meters (32.8 to 108 feet), this asteroid would certainly have caused considerable damage if it hit us. But the results would not exactly have been cataclysmic. Still, it might not be too soon to consider getting off this ball of rock. You know, before – as Hawking has warned – a single event is able to claim all of humanity in one fell swoop!
The MPC is currently tracking the 13 NEOs that were discovered during the month of May alone, and that’s just so far. Expect to hear more about rocks that might cross our path in the future.