One would think NASA was preparing for a some sword fights in space! At least, that’s the impression one might get when they see the new armor NASA is developing for the first time. Officially, they are referring to it as a new type of “space fabric“, one which will provide protection to astronauts, spaceships and deployable devices. But to the casual observer, it looks a lot like chain mail armor!
The new armor is the brainchild of Polit Casillas, a systems engineer from NASA’s Jet Propulsion Laboratory. Inspired by traditional textiles, this armor relies on advances made in additive manufacturing (aka. 3-D printing) to create woven metal fabrics that can fold and change shape quickly. And someday soon, it could be used for just about everything!
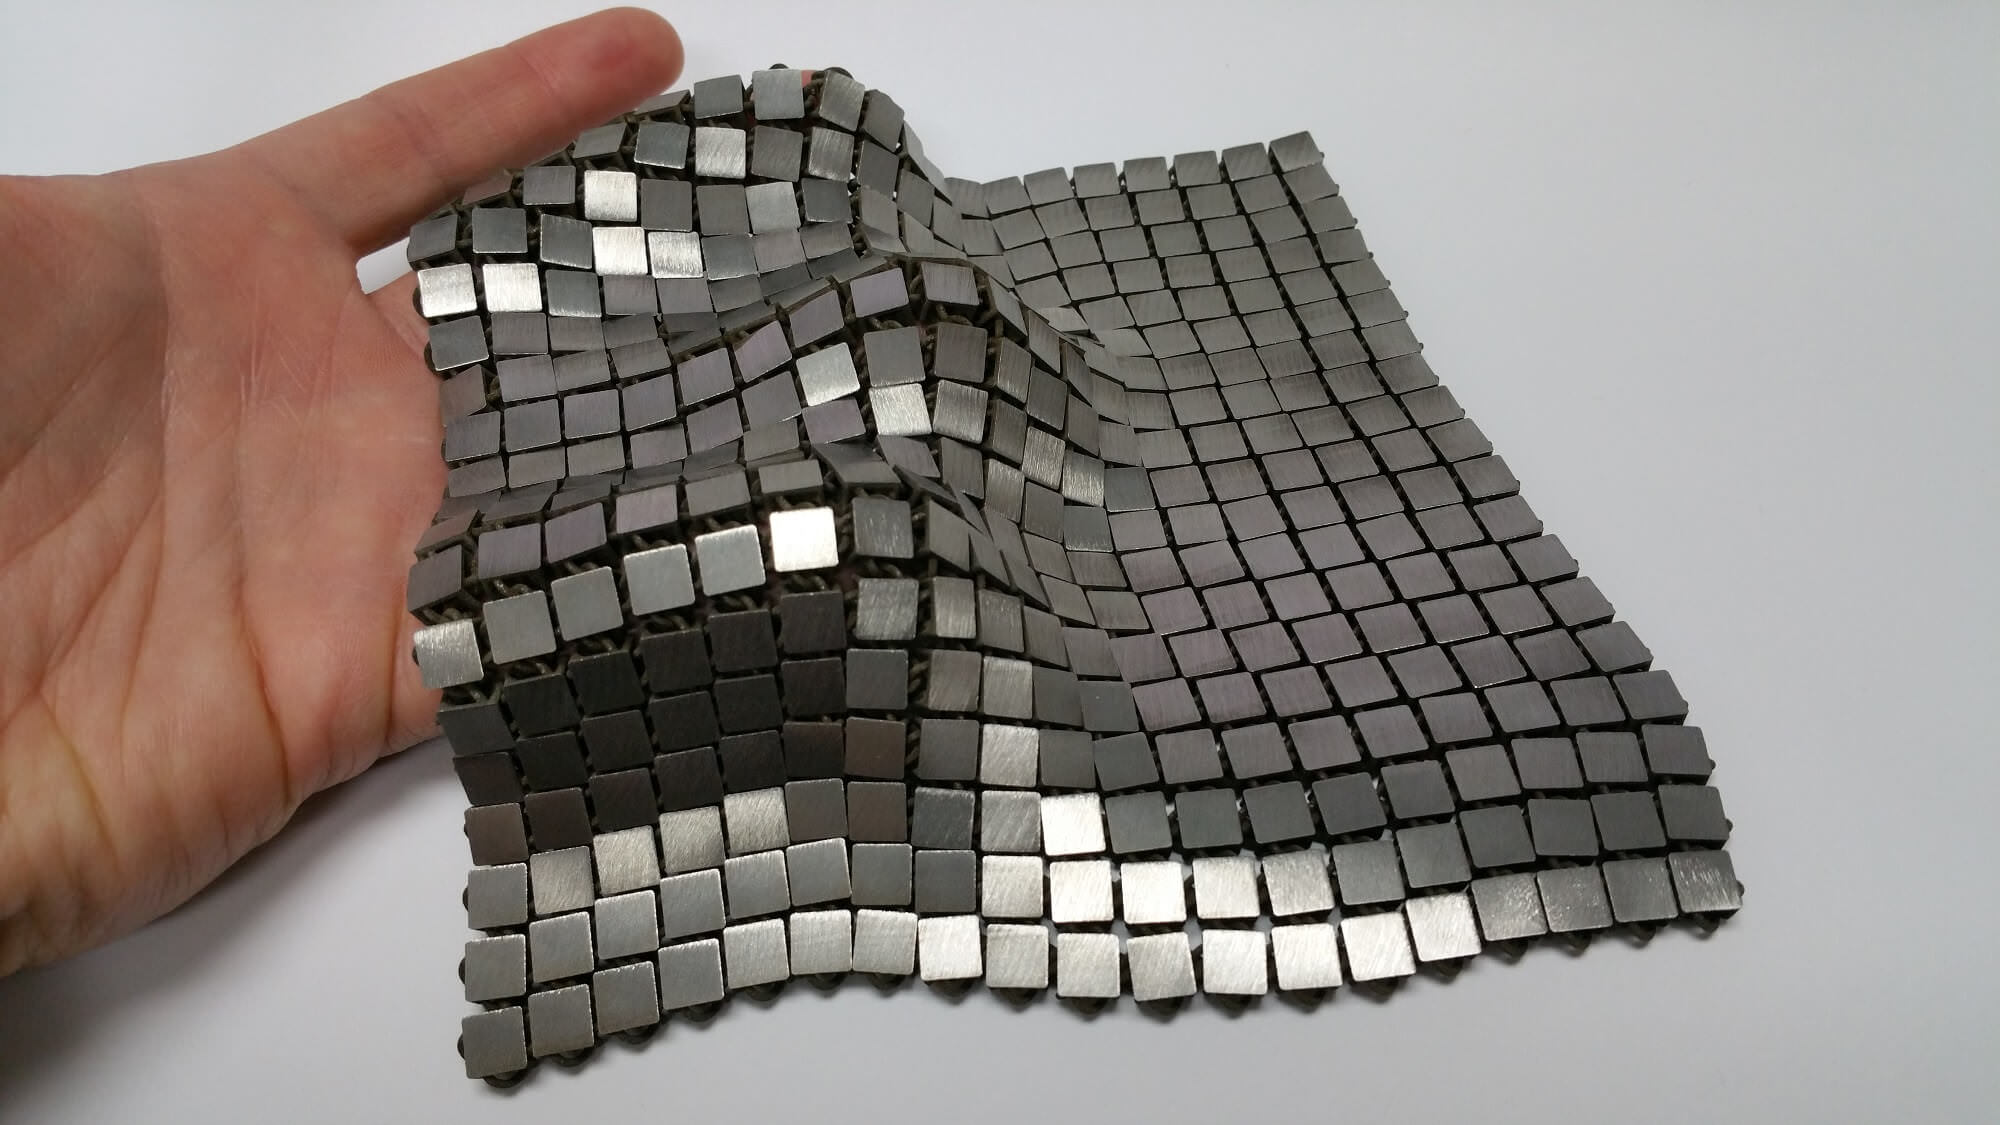
As the son of a fashion designer in Spain, Casillas grew up around fabrics and textiles, and was intrigued by how they are used for the sake of design. Much in the same way that textiles are produced by weaving together countless threads, Casilla’s prototype space fabric relies on 3-D printing to create metal squares in one piece, which are then strung together to form a coat of armor.

In addition to his work with this new space fabric, Casillas co-leads JPL’s Atelier workshop, which specialized in the rapid-prototyping of advanced concepts and systems. This fast-paced collaborative environment works with different technologies and looks for ways to incorporate new ones (such as 4-D printing) into existing designs. As Casillas described this concept in a NASA press release:
“We call it ‘4-D printing’ because we can print both the geometry and the function of these materials. If 20th Century manufacturing was driven by mass production, then this is the mass production of functions.”
The space fabrics have four essential functions, which includes reflectivity, passive heat management, foldability and tensile strength. With one side reflecting light and the other absorbing it, the material acts as a means of thermal control. It can also fold in many different ways and adapt to shapes, all the while maintaining tensile strength to ensure it can sustain forces pulling on it.
These fabrics could be used to protect astronauts and shield large antennas, deployable devices and spacecraft from meteorites and other hazards. In addition, they could be used to ensure that missions to extreme environments would be protected from the elements. Consider Jupiter’s moon Europa, which NASA is planning on exploring in the coming decade using a lander – aka. the Europa Clipper mission.
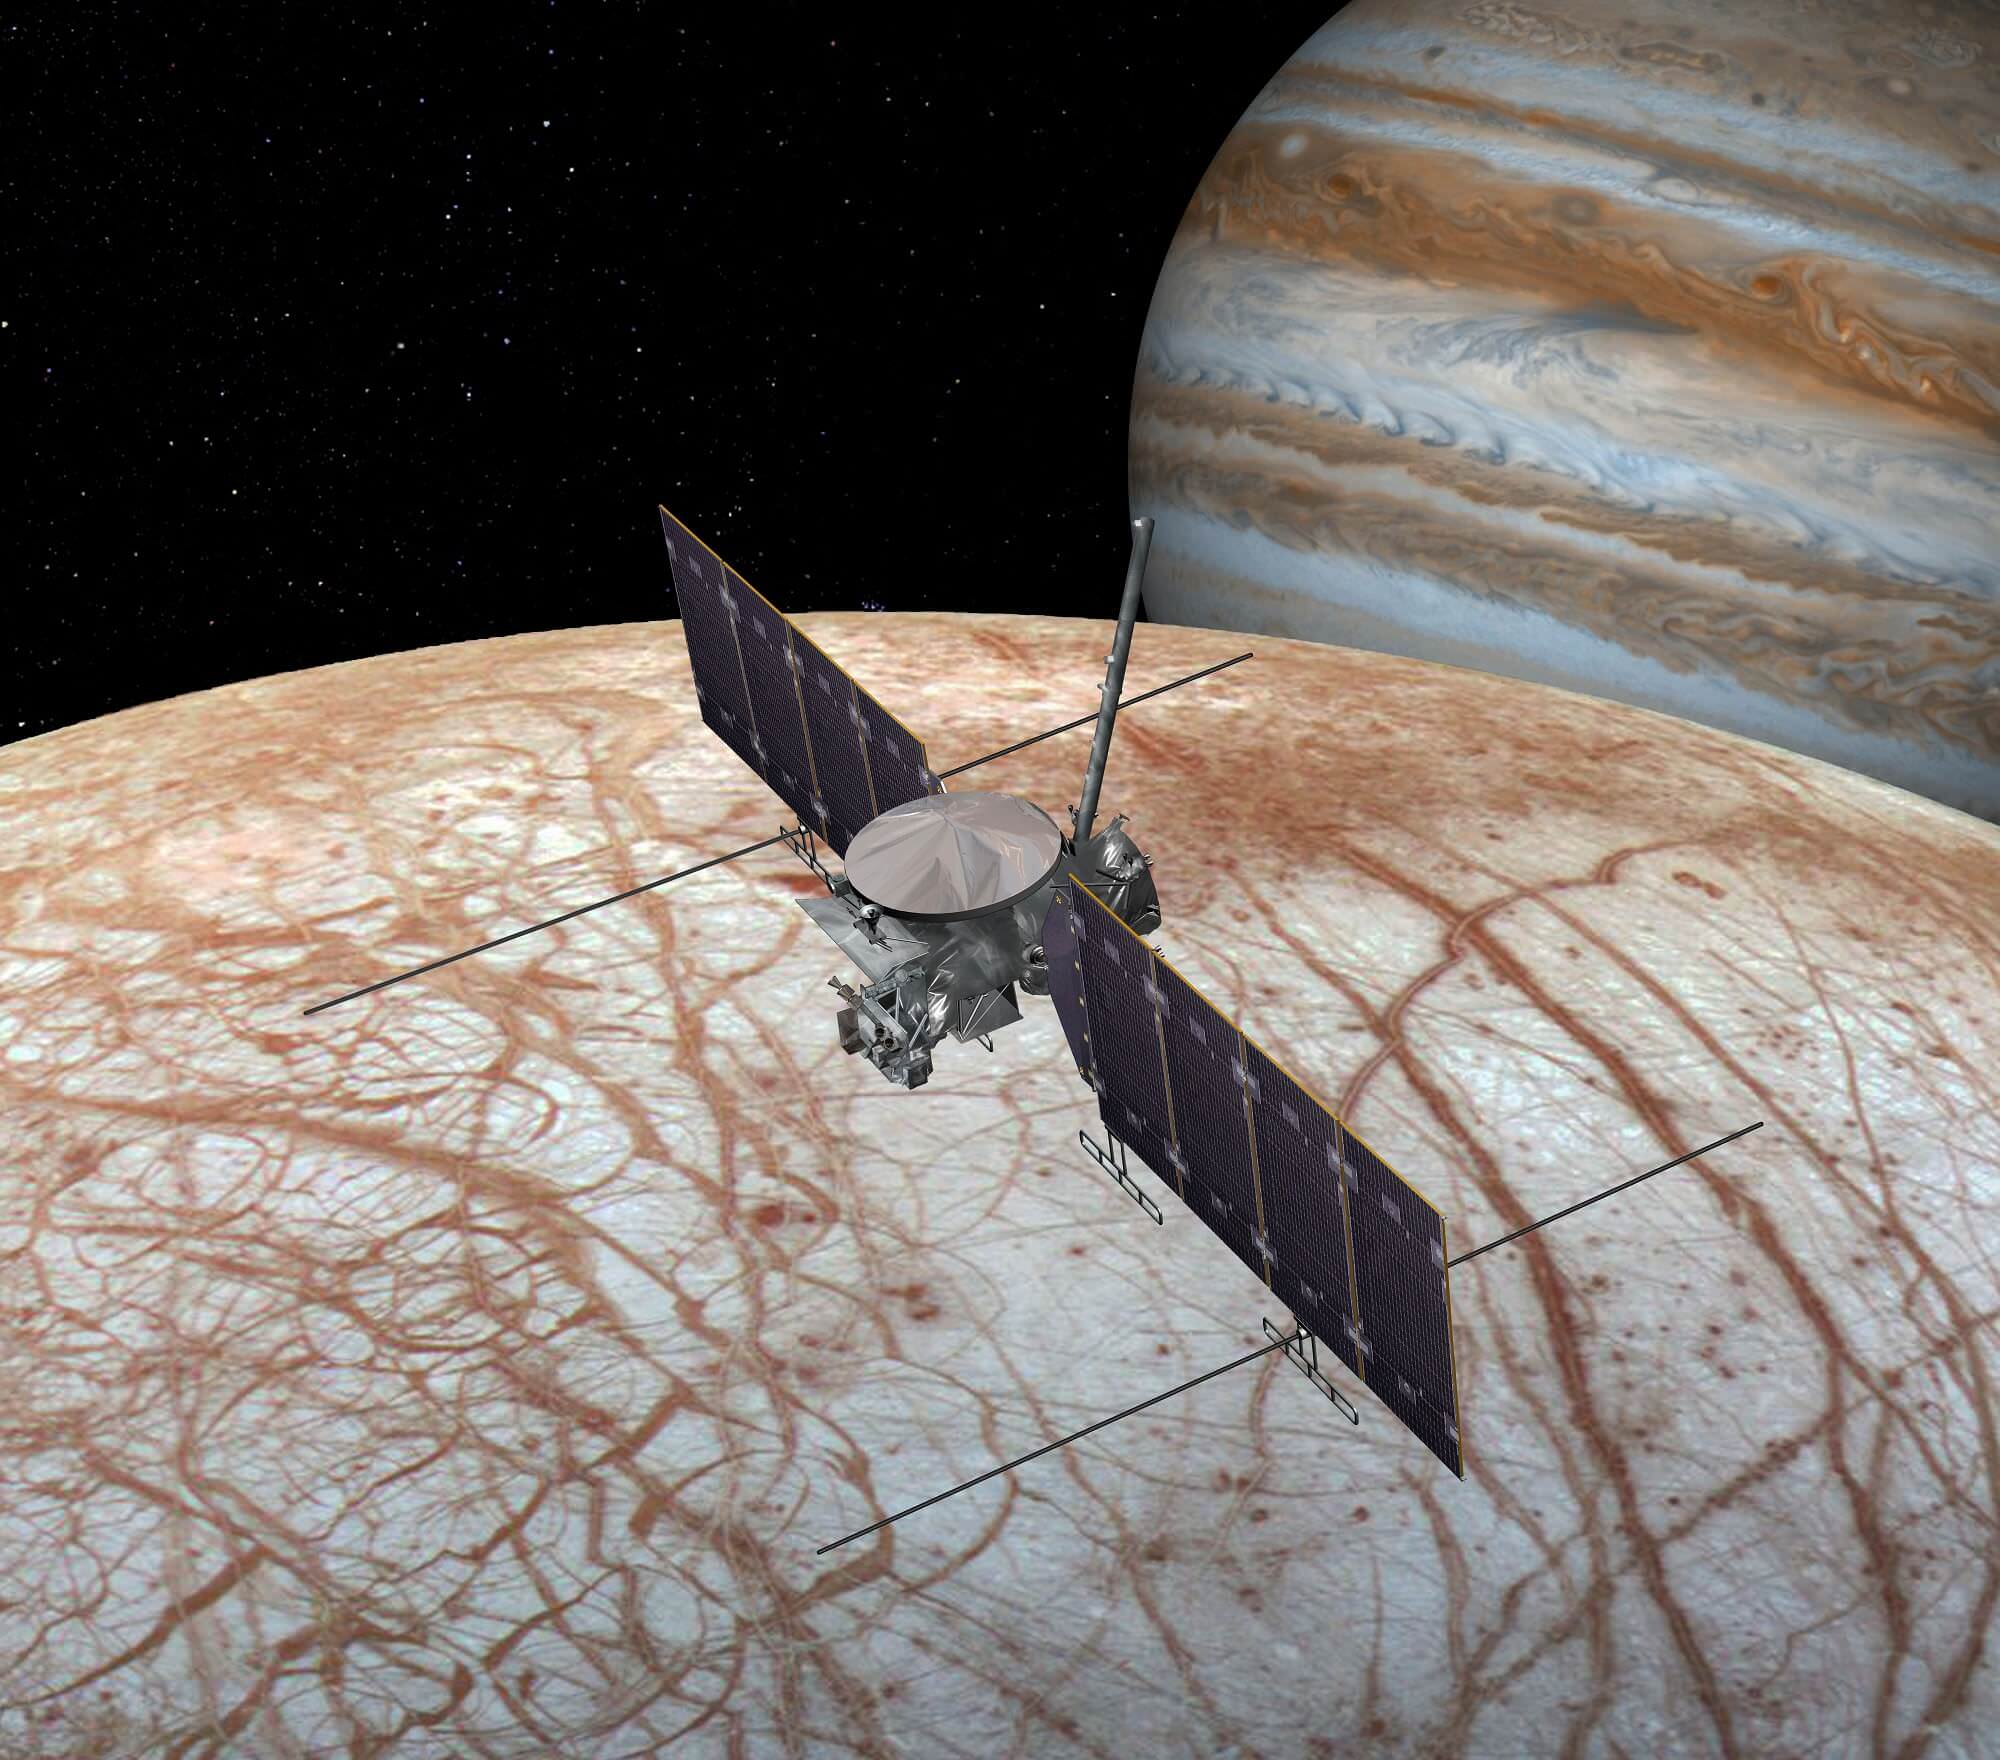
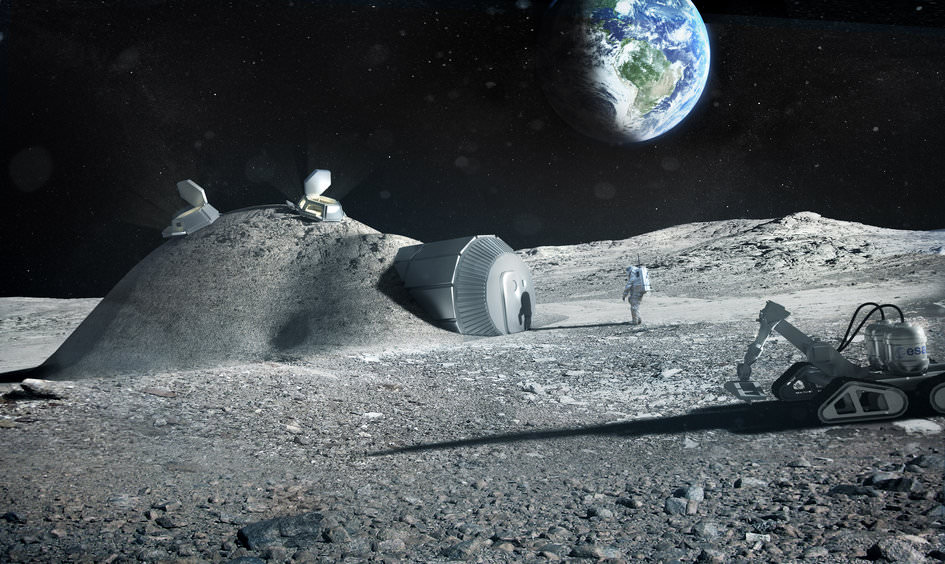
Here, and on other “ocean worlds” – like Ceres, Enceladus, Titan and Pluto – this sort of flexible armor could provide insulation for spacecraft. They could be used on landing struts to ensure that they could change shape to fit over uneven terrain as well. This kind of material could also be used to build habitats for Mars or the Moon – like the South Pole-Aitken Basin, where permanently-shadowed craters allow for the existence of water ice.
Another benefit of this material is the fact that it is considerably cheaper to produce compared to materials made using traditional fabrication methods. Under ordinary conditions, designing and building spacecraft is a complex and costly process. But by adding multiple functions to a material at different stages of development, the whole process can be made cheaper and new designs can be implemented.
Andrew Shapiro-Scharlotta is a manager at the JPL’s Space Technology Office, an office responsible for funding early-stage technologies like the space fabric. As he put it, this sort of production process could enable all kinds of designs and new mission concepts. “We are just scratching the surface of what’s possible,” he said. “The use of organic and non-linear shapes at no additional costs to fabrication will lead to more efficient mechanical designs.”
In keeping with how 3-D printing has been developed for use aboard the ISS, the JPL team not only wants to use this fabric in space, but also manufacture it in space as well. In the future, Casillas also envisions a process whereby tools and structural materials can be printed from recycled materials, offering additional cost-savings and enabling rapid, on-demand production of necessary components.
Such a production process could revolutionize the way spacecraft and space systems are created. Instead of ships, suits, and robotic craft created from many different parts (which then have to be assembled), they could be printed out like “whole cloth”. The manufacturing revolution, it seems, loometh!
Further Reading: NASA