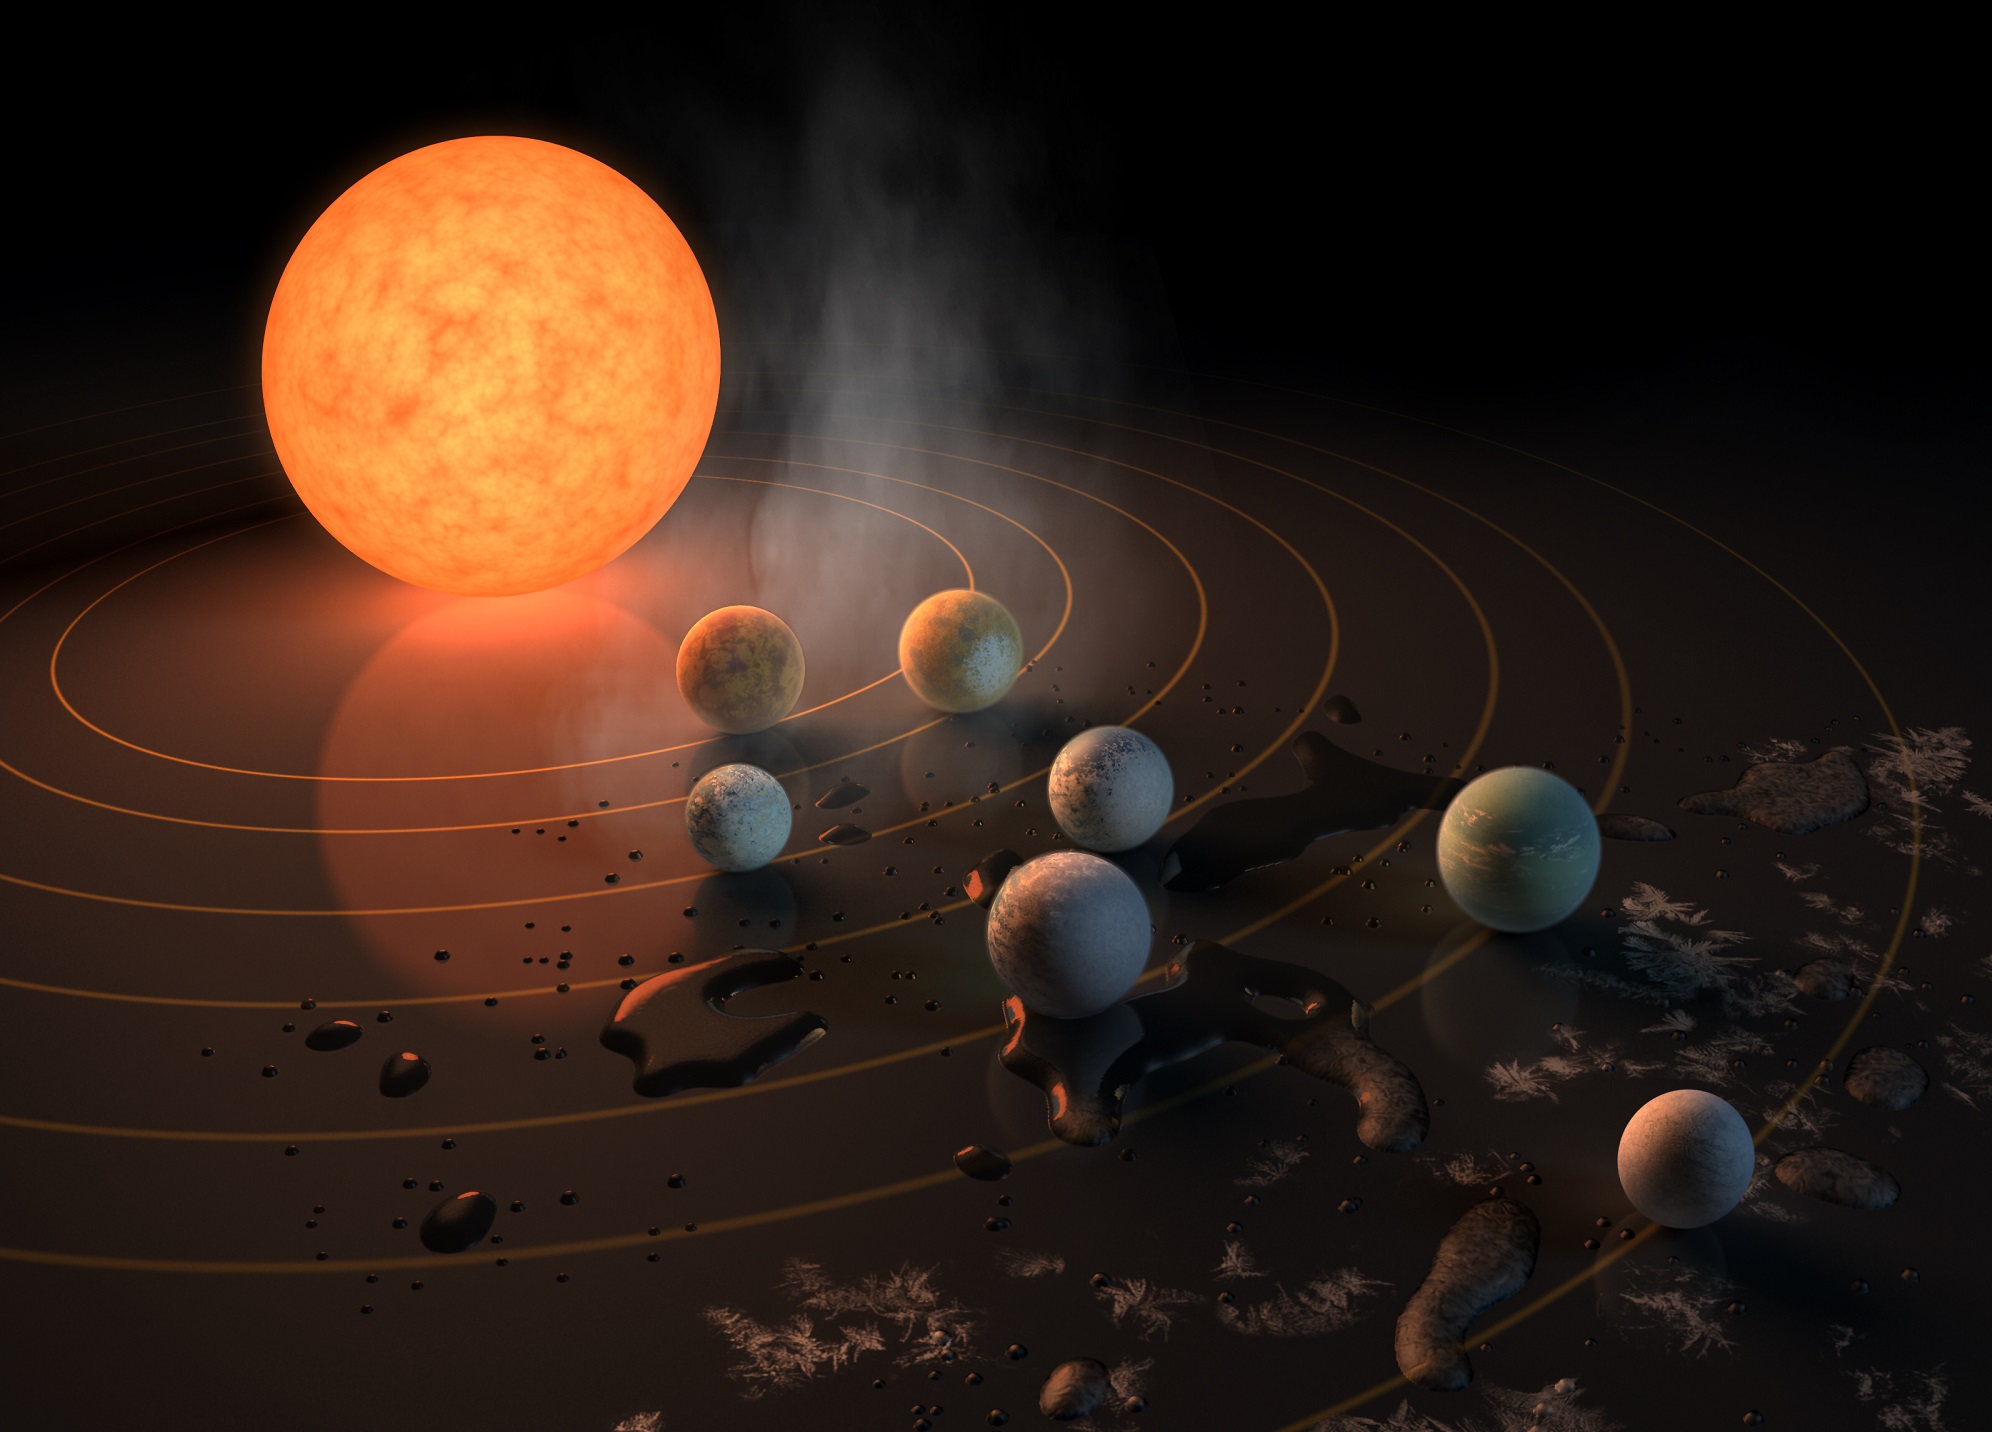
Artist's concept of the TRAPPIST-1 star system, an ultra-cool dwarf that has seven Earth-size planets orbiting it. We're going to keep finding more and more solar systemsl like this, but we need observatories like WFIRST, with starshades, to understand the planets better. Credits: NASA/JPL-Caltech
Ever since scientists confirmed the existence of seven terrestrial planets orbiting TRAPPIST-1, this system has been a focal point of interest for astronomers. Given its proximity to Earth (just 39.5 light-years light-years away), and the fact that three of its planets orbit within the star’s “Goldilocks Zone“, this system has been an ideal location for learning more about the potential habitability of red dwarf stars systems.
This is especially important since the majority of stars in our galaxy are red dwarfs (aka. M-type dwarf stars). Unfortunately, not all of the research has been reassuring. For example, two recent studies performed by two separate teams from the Harvard-Smithsonian Center for Astrophysics (CfA) indicate that the odds of finding life in this system are less likely than generally thought.
A NASA WB-57F on the ramp at Ellington Field near Houston ready to chase totality next month during the historic August 21st total solar eclipse. Credit: NASA/JSC
In a classic swords-to-plowshares move, two converted WB-57F aircraft flown by NASA’s Airborne Science Program will greet the shadow of the Moon as it rushes across the contiguous United States on Monday, August 21st on a daring mission of science.
“We are going to be observing the total solar eclipse with two aircraft, each carrying infrared and visible light cameras taking high definition video,” Southwest Research Institute (SwRI) Principal Investigator on the project Amir Caspi told Universe Today. “These will be the highest quality observations of their kind to date, looking for fast dynamic motion in the solar corona.”
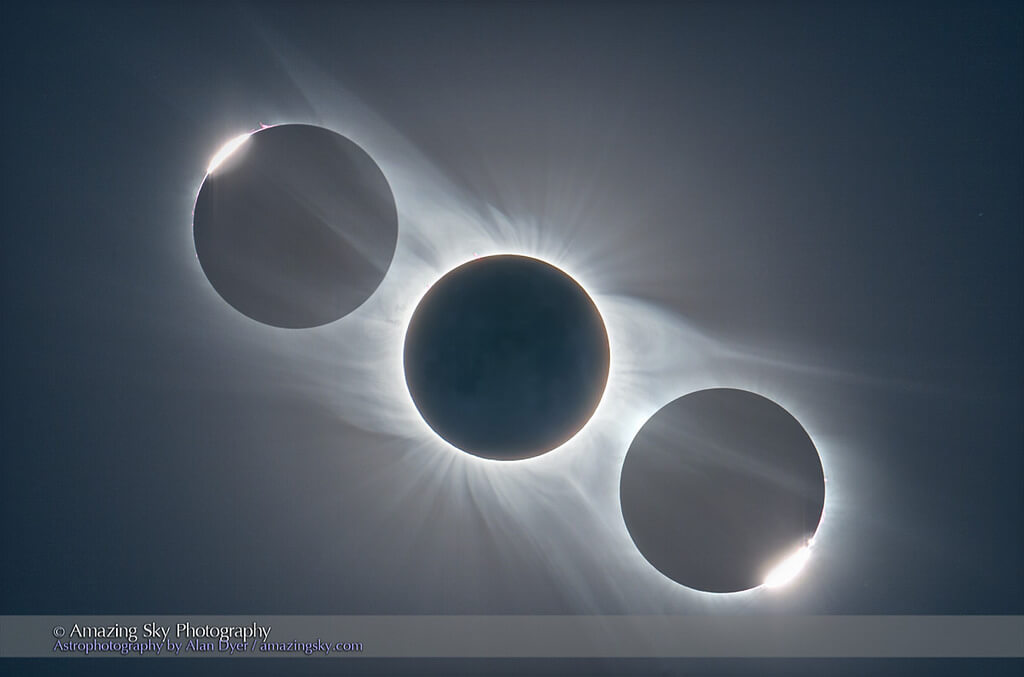
Total solar eclipses provide researchers with a unique opportunity to study the solar corona – the ghostly glow of the Sun’s outer atmosphere seen only during totality. NASA plans a battery of experiments during the eclipse, including plans to intercept the Moon’s shadow using two aircraft near the point of greatest totality over Carbondale, Illinois. Flying out of Ellington Field near Houston Texas and operated by NASA’s Johnson Spaceflight Center, NASA is the only remaining operator of the WB-57F aircraft.
Group photo of NASA’s three WB-57F aircraft fleet. Credit: NASA/Robert Markowitz
Flying at an altitude of 50,000 feet, the aircraft will intercept the 70 mile wide shadow of the Moon. The shadow will be moving at 1,400 miles per hour – twice the speed of sound – versus the WB-57F aircraft’s max speed of 470 miles per hour. The flight will extend the length of totality from the 2 minutes 40 seconds seen on the ground, to a total of about 8 minutes between the two aircraft.
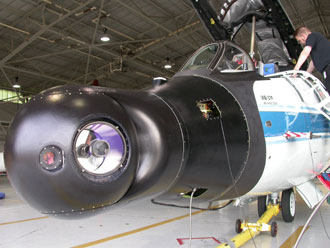
The two converted WB-57F Canberra tactical bombers will track the eclipse using DyNAMITE (Day Night Airbourne Motion Imagery for Terrestrial Environments), two tandem gimbal-mounted 8.7-inch imagers, one for visible light and one for infrared. These are located in the nose of the aircraft and will shoot 30 frames per second.
The new DyNAMITE system mounted in the nose of NASA’s WB-57F aircraft. Credit: NASA/Amir Caspi
This system was originally designed about a decade ago to chase down the U.S. Space Shuttle during reentry following the 2003 Columbia disaster and has, on occasion, provided amazing footage SpaceX Falcon-9 Stage 1 returns during reentry.
The WAVE system, a precursor to DyNAMITE, seen up close. NASA/JSC
The solar corona is about as bright as the Full Moon, and the team plans to make a precise ‘map’ of the solar corona in an effort to understand just how the corona interacts with the solar photosphere and the chromosphere. Of particular interest is understanding how wave energy and ‘nanoflares’ heat the solar corona.
“What we’re hoping to learn is what makes the corona so hot, with temperatures of 1 to 2 million degrees Celsius — or even 4 to 10 million degrees Celsius in some regions — far hotter than the photosphere below,” Caspi told Universe Today. “What keeps it organized in terms of structure? Why don’t we see a snarled, tangled mess?”
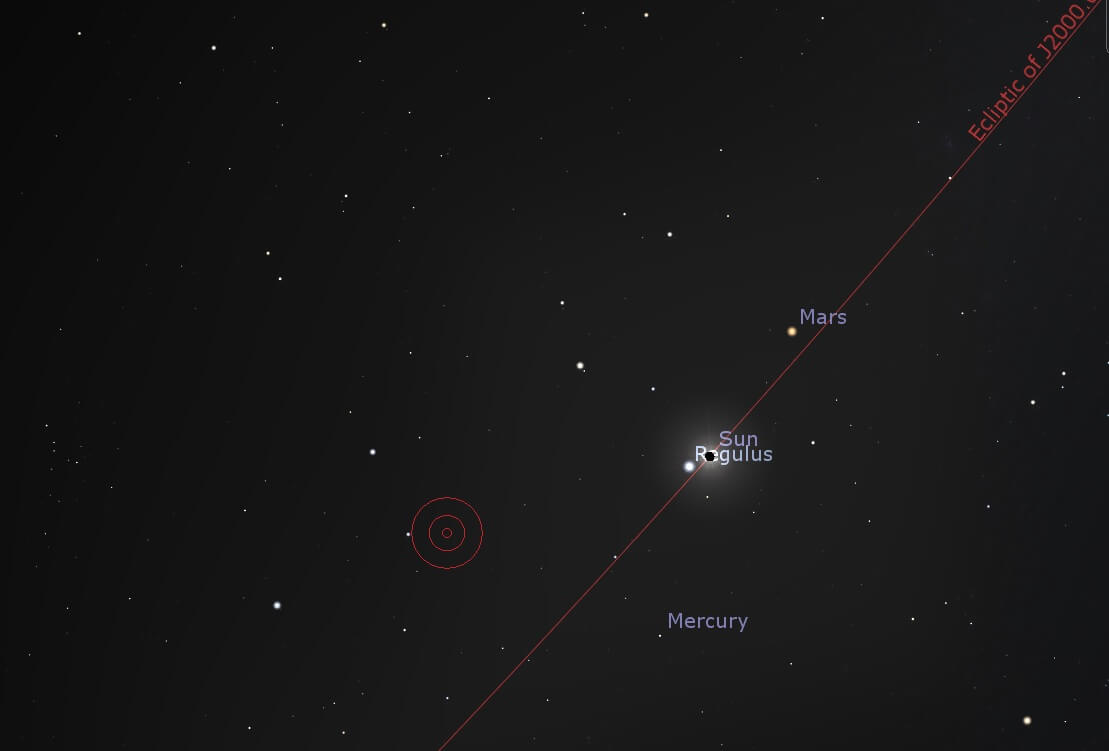
As a secondary objective, the team will also make observations of the planet Mercury in the infrared 30 minutes before and after totality, located 11 degrees to the east of the Sun during the eclipse. Mercury never strays far from the Sun, making it a tough target to study in the infrared as seen from the Earth.
And of course, all of this has to happen during the scant few minutes up to and during totality. Each aircraft will fly just inside opposite ends of the shadow of the Moon in a challenging long distance precision formation.
The WB-57F aircraft will also participate in a tertiary objective, hunting for Vulcanoid asteroids near the Sun during the eclipse. Though the 19th century idea of a tiny inter-Mercurial world perturbing Mercury’s orbit was banished to the dust bin of astronomical history by Einstein’s general theory of relativity, there’s still room for undiscovered asteroids dubbed ‘Vulcanoids’ close in to the Sun. NASA flew observations hunting for Vulcanoids aboard modified F-18 Hornet aircraft in 2002 scanning twilight realms near the Sun, and came up with naught.
Eclipse chaser Landon Curt Noll noted during an interview with Universe Today in 2015 that NASA’s Solar Heliospheric Observatory SOHO mission has pretty much ruled out objects brighter than +8th magnitude near the Sun, which translates into asteroids 60 kilometers in diameter or larger.
“We have searched down to magnitude +13.5,” Noll told Universe Today. “Assuming the objects are ‘Mercury like’ in reflectivity (in) the Vulcanoid zone (0.08 to 0.18 AU from the Sun), the search has looked for and failed to find objects as small as 2 to 6 kilometers in diameter.” NASA’s Mercury Messenger carried out a similar search en route to the innermost planet.
Mercury versus the Sun during totality. Credit: Stellarium.
Knoll has scoured the sky near the eclipsed Sun with a specialized near-infrared telescope rig during the 2006 total solar eclipse over Libya. Next month, he plans to continue his quest from a site near Jackson Hole, Wyoming.
The action leading up to the the long awaited August 21st total solar eclipse begins at 17:16 Universal Time (UT)/ 10:16 AM Pacific Daylight Saving Time (PDT), when the Moon’s dark inner shadow or umbra touches down along the Oregon Pacific coast. From there, the 70 mile wide shadow will race eastward, gracing 14 states (just nicking Iowa and Montana) before departing land over the Atlantic coast of South Carolina 92 minutes later. Viewers along the path will witness a maximum totality of 2 minutes and 40 seconds, centered on a location very near Carbondale, Illinois. Millions are expected to make the pilgrimage to the eclipse path, while those outside the path in the remainder of North America as well as northern South America, western Africa, Europe and northeast Asia will see varying levels of a partial solar eclipse.
This is the end of a long “total solar eclipse drought” for the United States, marking the first time totality touched the continental United States since February 26, 1979, (totality crossed Hawaii on July 11th, 1991). The last total solar eclipse to cross the United States from coast-to-coast was June 8th, 1918.
NASA has a long history of airborne astronomy campaigns. Noll notes that NASA’s Stratospheric Observatory for Infrared Astronomy (SOFIA) flying observatory based out of Armstrong research center would make an ideal platform for Vulcanoid hunting during totality. Looking at SOFIA’s flight schedule, however, reveals no plans to carry out such a chase on August 21st. SOFIA’s predecessor, the Kuiper Observatory built into a U.S. Air Force C-141 Starlifter discovered the rings of Uranus during a stellar occultation in 1977.
“This is the first use of DyNAMITE and NASA’s WB-57F platform for astronomy,” Caspi told Universe Today. “This showcases the potential for the platform for possible future observations.”
The DyNAMITE/WB-57B campaign will also be part of the live NASA TV webcast on eclipse day.
Airborne total solar eclipse chasing goes all the way back to August 19th 1887, when Dmitri Mendeleev (he of the periodic table) observed totality from aloft. There’s a great old video of an effort to chase a 1925 total solar eclipse using the airship the USS Los Angeles:
A team also chased a total solar eclipse across North Africa on June 30th, 1973 aboard a supersonic Concorde:
Today, you can even book a ticket for an eclipse-chasing experience aloft. Alaska Airlines plans to attempt to duplicate its 2016 success, and will once again chase totality with a lucky few observers aboard next month.
As for us, we’re planning on watching the eclipse from terra firma at the Pisgah Astronomical Research Institute (PARI) in North Carolina while intrepid researchers fly high above. Watch for our complete eclipse guide out around July 21st on Universe Today and an update on weather prospects, solar activity etc. about a week prior. Finally, we’ll have an after action report out post total solar eclipse, with reader images from across the country.
-This promises to be a total solar eclipse for the ages. Don’t miss the Great American Eclipse!
-Read more about the August 21st total solar eclipse and the true tale of Vulcan, Totality and Edison’s Chickens in our free e-guide to 101 Astronomical Events for 2017, out from Universe Today.
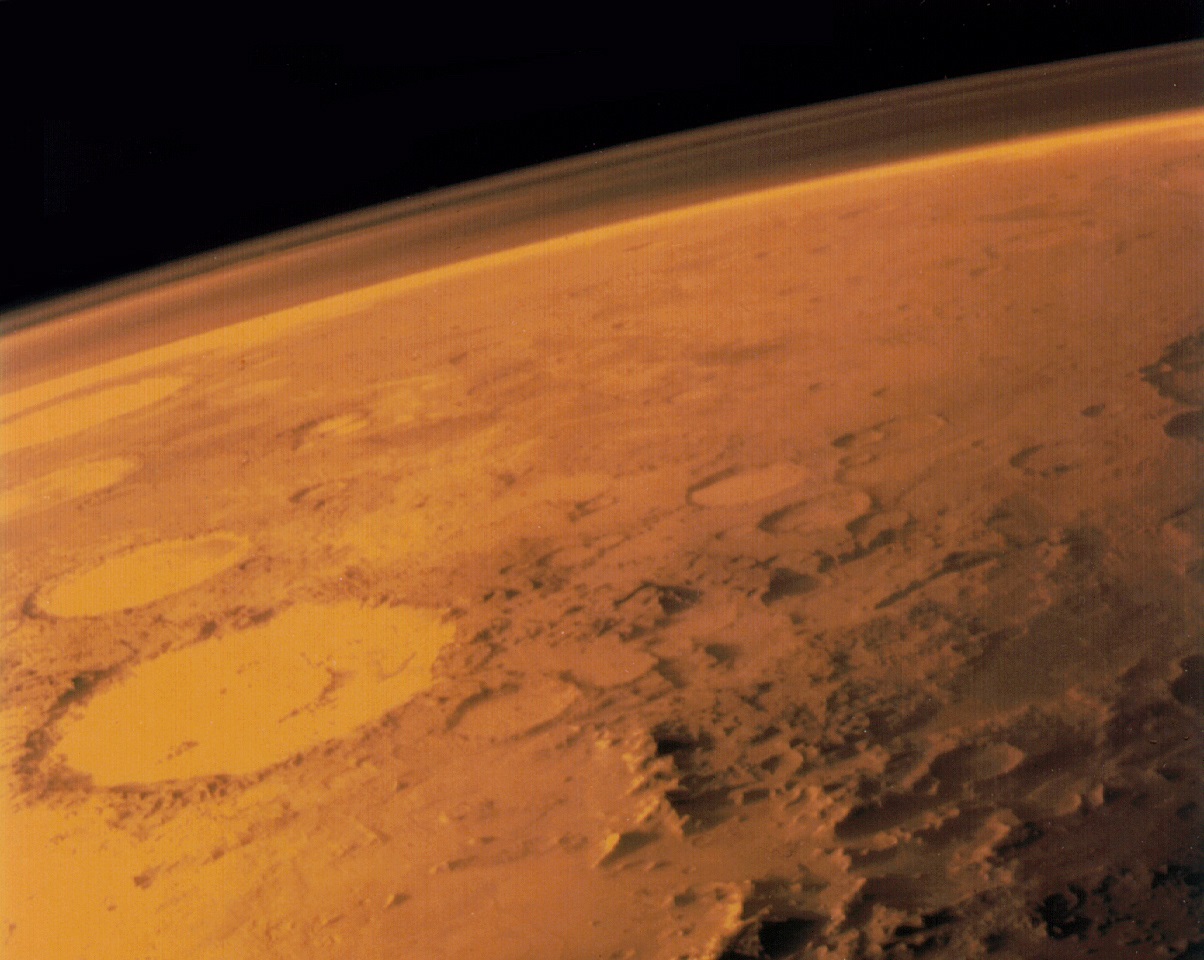
Image taken by the Viking 1 orbiter in June 1976, showing Mars thin atmosphere and dusty, red surface. Credits: NASA/Viking 1
One of the most significant finds to come from our ongoing exploration and research efforts of Mars is the fact that the planet once had a warmer, wetter environment. Between 4.2 and 3.7 billion years ago, the planet had a thicker atmosphere and was able to maintain liquid water on its surface. As such, it has been ventured that life could have once existed there, and might still exist there in some form.
However, according to some recent lab tests by a pair of researchers from the UK Center for Astrobiology at the University of Edinburgh, Mars may be more hostile to life than previously thought. Not only does this not bode well for those currently engaged in the hunt for life on Mars (sorry Curiosity!), it could also be bad news for anyone hoping to one day grow things on the surface (sorry Mark Watney!).
Their study, titled “Perchlorates on Mars Enhance the Bacteriocidal Effects of UV Light“, was recently published in the journal Science Reports. Performed by Jennifer Wadsworth and Charles Cockell – a postgraduate student and a professor of astrobiology at the UK Center for Astrobiology, respectively – the purpose of this study was to see how perchlorates (a chemical compound that is common to Mars) behaved under Mars-like conditions.
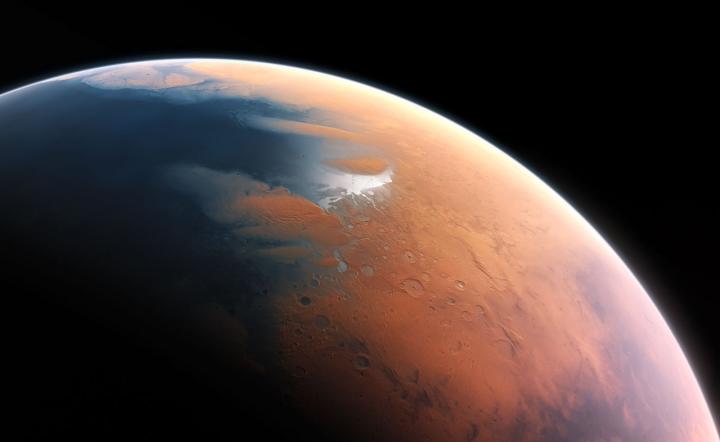
An artist’s impression of what Mars might have looked like with water, when any potential Martian microbes would have evolved. Credit: ESO/M. Kornmesser
Basically, perchlorates are a negative ion of chlorine and oxygen that are found on Earth. When the Pheonix lander touched down on Mars in 2008, it found that this chemical was also found on the Red Planet. While stable at room temperature, perchlorates become active when exposed to high levels of heat energy. And under the kinds of conditions associated with Mars, they become rather toxic.
Interestingly enough, the presence of perchlorates on the surface of Mars was presented in 2015 as evidence of there being liquid water there in the past. This was due to the fact that these compounds were found both in-situ and as part of what are known as “brine sweeps”. In other words, some of the discovered perchlorates took the form of streaky lines that were thought to have been the result of water evaporating.
Water, as we all know, is also an essential ingredient to life as we know it, and it’s discovery of Mars was seen as evidence that life could have once existed there. Hence, as Jennifer Wadsworth (the study’s lead author) told Universe Today via email, she and Dr. Cockell were interested to see how such compounds would behave under conditions that are particular to Mars:
“There is a relatively large amount of perchlorate on Mars (0.6 weight percent) and it was confirmed to be a component of a Martian brine by NASA in 2015. It has been speculated that these brines may be habitable. There has been previous work done showing that perchlorates can be ‘activated’ by ionizing radiation which leads them to chlorinate amino acids and degrade organics. We wanted to test whether perchlorate could be activated by UV under Martian environmental conditions to directly kill bacteria. We thought it would be interesting to investigate in light of the discussions of brine habitability.”
Scientists were able to gauge the rate of water loss on Mars by measuring the ratio of water
After recreating the temperature conditions that are common to the Martian surface, Wadsworth and Cockell began exposing the samples to ultra-violet light – which the surface of Mars gets plenty of exposure to. What they found was that under cold conditions, the samples became activated when exposed to UV radiation. And As Wadsworth explained, the results were less than encouraging:
“The main results were that perchlorate, that is usually only activated at high temperatures, can be activated by only using UV light. This is interesting because this compound is abundant on Mars (where it’s very cold), so we might have previously thought it wouldn’t be possible to activate it under Martian conditions. We also found the bactericidal effect increased when bacteria were irradiated with perchlorate and other Martian compounds (iron oxide and hydrogen peroxide). This is important because it is lethal to bacteria when activated. So, if we want to find life on Mars, we have to take this into consideration.”
Iron oxide – aka. rust – and hydrogen peroxide are two compounds that are also found in abundance on the surface of Mars. In fact, it is the prevalence of iron oxide in the soil that gives Mars its distinct, reddish appearance. When Wadsworth and Cockell added these compounds to the perchlorates, the result was nothing less than a 10.8-fold increase in the death of bacterial cells, when compared to perchlorates alone.
While the surface of Mars has long been suspected of having toxic effects, this study shows that it could actually be very hostile to living cells. Thanks to the toxic combination that is created when these three chemical compounds come together and are activated by UV light, the most basic of life forms may be unable to survive there. For those researchers attempting to determine if Mars could in fact be habitable, this is not good news!
Sorry, Mark Watney. Turns out, your potatoes are growing in dirt that is toxic to lifeforms. Credit: Twentieth Century Fox Film Corporation
It is also bad news as far as the existence of liquid water is concerned. While the presence of liquid water in Mars’ past was seen as compelling evidence for past habitability, this water would not have been particularly supportive for life as we know it. Not if these compounds were present in Mars’ surface water, which this study would seem to suggest. Luckily, this research does present a few silver linings.
On the one hand, the fact that perchlorates became hostile to B. subtilis in the presence of UV does not necessarily mean that the Martian surface is hostile to all life. Second, the presence of these bacteria-killing compounds means that contaminants left behind by robotic explorers are not likely to survive long. So the risk of contaminating Mars’ environment (always a going concern for any mission) is very low.
As Wadsworth explained, there are unanswered questions, and more research is necessary:
“We don’t know exactly how far reaching the effect of UV and perchlorate would penetrate the surface layers, as the precise mechanism isn’t understood. If it’s the case of altered forms of perchlorate (such as chlorite or hypochlorite) diffusing through the environment, that might extend the uninhabitable zone. If you’re looking for life you have to additionally keep the ionizing radiation in mind that can penetrate the top layers of soil, so I’d suggest digging at least a few meters into the ground to ensure the levels of radiation would be relatively low. At those depths, it’s possible Martian life may survive.”
As for all the potential Mark Watney’s out there (the protoganist from The Martian), there might be some good news as well. “Perchlorate can be dangerous to humans so we’d just have to make sure we keep it out of the austronauts’ living quarters,” said Wadsworth. “We could potentially use it in sterilization processes. I think the more immediate threat to Martian colonies would be the amount of radiation reaching the surface.”
So maybe we don’t need to cancel our tickets to Mars just yet! However, as the day draws nearer to where people like Elon Musk and Bas Lansdorp are able to make commercial trips to the Red Planet a reality, we will need to know precisely how terrestrial organisms will fare on the planet – and that includes us! And if the prospects don’t look good, we better make certain we have some decent counter-measures in place.
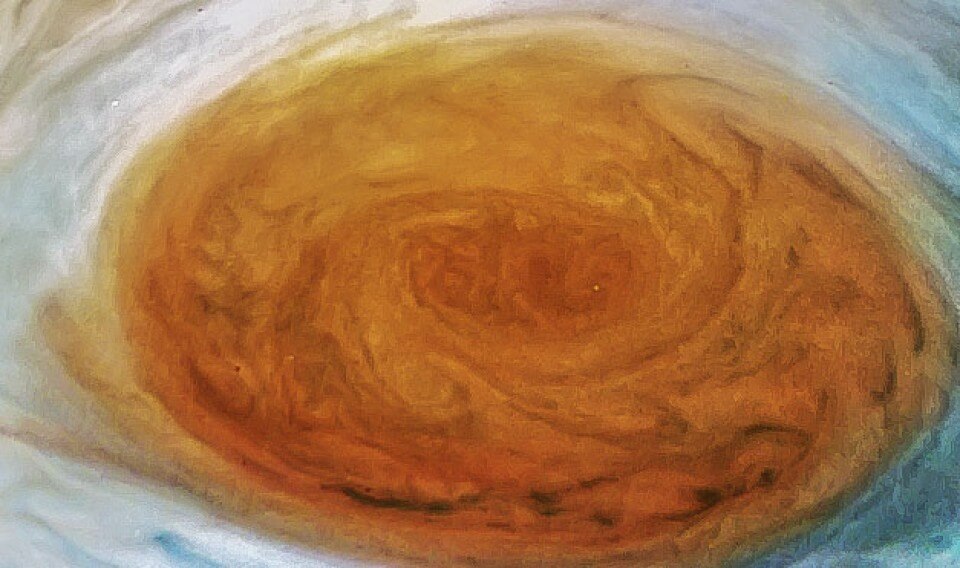
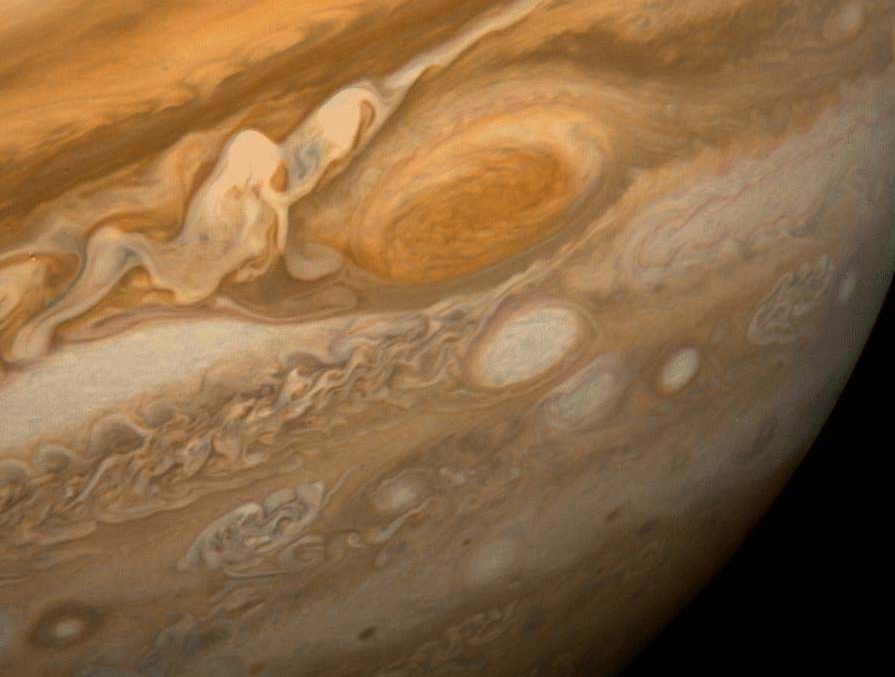
Jupiter's Great Red Spot, as imaged by the Juno spacecraft's JunoCam at a distance of just 9,000 km (5,600 mi) from the atmosphere. Credit : NASA/SwRI/MSSS/TSmith
Earlier this week, on Monday, July 10th, the Juno mission accomplished an historic feet as it passed directly over Jupiter’s most famous feature – the Great Red Spot. This massive anticyclonic storm has been raging for centuries, and Juno’s scheduled flyby was the closest any mission has ever come to it. It all took place at 7:06 p.m. PDT (11:06 p.m. EDT), just days after the probe celebrated its first year of orbiting the planet.
And today – Wednesday, July 12th, a few days ahead of schedule – NASA began releasing the pics that Juno snapped with its imager – the JunoCam – to the public. As part of the missions’ seventh orbit around the planet (perijove 7) these images are the closest and most detailed look of Jupiter’s Great Red Spot to date. And as you can clearly see by going to the JunoCam website, the pictures are a sight to behold!
And as always, citizen scientists and amateur astronomers are already busy processing the images. This level of public involvement in a NASA mission is something quite new. Prior to every perijove, NASA has asked for public input on what features they would like to see imaged. These Points of Interest (POIs), as they are called, are then photographed, and the public has had the option of helping to process them for public consumption.
As Scott Bolton – the associate VP at the Southwest Research Institute (SwRI) and the Principle Investigator (PI) of the Juno mission – said in a NASA press release, “For generations people from all over the world and all walks of life have marveled over the Great Red Spot. Now we are finally going to see what this storm looks like up close and personal.” And in just the past two days, several processed images have already come in.
Consider the images that were processed by Jason Major – an amateur astronomer and graphic designer who created the astronomy website Lights in the Dark. In the image above (his own work), we see a cropped version of the original JunoCam image in order to put Jupiter’s Great Red Spot center-frame. It was then color-adjusted and enhanced to mark the boundaries of the storm’s “eye” and the swirling clouds that surround it more clearly.
On his website, Major described the method he used to bring this image to life:
“[T]he image above is my first rendering made from a map-projected PNG file which centers and fully-frames the giant storm in contrast- and color-enhanced detail… The resolution is low but this is what my “high-speed” workflow is set up for—higher resolution images will take more time and I’m anticipating some incredible versions to be created and posted later today and certainly by tomorrow and Friday by some of the processing superstars in the imaging community (Kevin, Seán, Björn, Gerald, I’m looking at you!)”
Above is another one of Major’s processed images, which was released shortly after the first one. This image shows the GRS in a larger context, using the full JunoCam image, and similarly processed to show contrasts. The same image was processed and submitted to the Juno website by amateur astronomers Amadeo Bellotti and Oliver Jenkins – though their submissions are admittedly less clear and colorful than Major’s work.
Other images include “Juno Eye“, a close up of Jupiter’s northern hemisphere that was processed by our good friend, Kevin M. Gill. Shown below, this image is a slight departure from the others (which focused intently on Jupiter’s Great Red Spot) to capture a close-up of the swirls in Jupiter’s northern polar atmosphere. Much like the GRS, these swirls are eddies that are created by Jupiter’s extremely high winds.
The Juno mission reached perijove – i.e. the point in its orbit where it is closest to Jupiter’s center – on July 10th at 6:55 p.m. PDT (9:55 p.m. EDT). At this time, it was about 3,500 km (2,200 mi) above Jupiter’s cloud tops. Eleven minutes and 33 seconds later, it was passing directly over the anticyclonic storm at a distance of about 9,000 km (5,600 mi); at which time, all eight of its instruments were trained on the feature.
In addition to the stunning array of images Juno has sent back, its suite of scientific instruments have gathered volumes of data on this gas giant. In fact, the early science results from the mission have shown just how turbulent and violent Jupiter’s atmosphere is, and revealed things about its complex interior structure, polar aurorae, its gravity and its magnetic field.
The Juno mission reached Jupiter on July 5th, 2016, becoming the second probe in history to establish orbit around the planet. By the time the mission is scheduled to end in 2018 (barring any mission extensions), scientist hope to have learned a great deal about the planet’s structure and history of formation.
Given that this knowledge is likely to reveal things about the early history and formation of the Solar System, the payoffs from this mission are sure to be felt for many years to come after it is decommissioned.
In the meantime, you can check out all the processed images by going to the JunoCam sight, which is being regularly updated with new photos from Perijove 7!
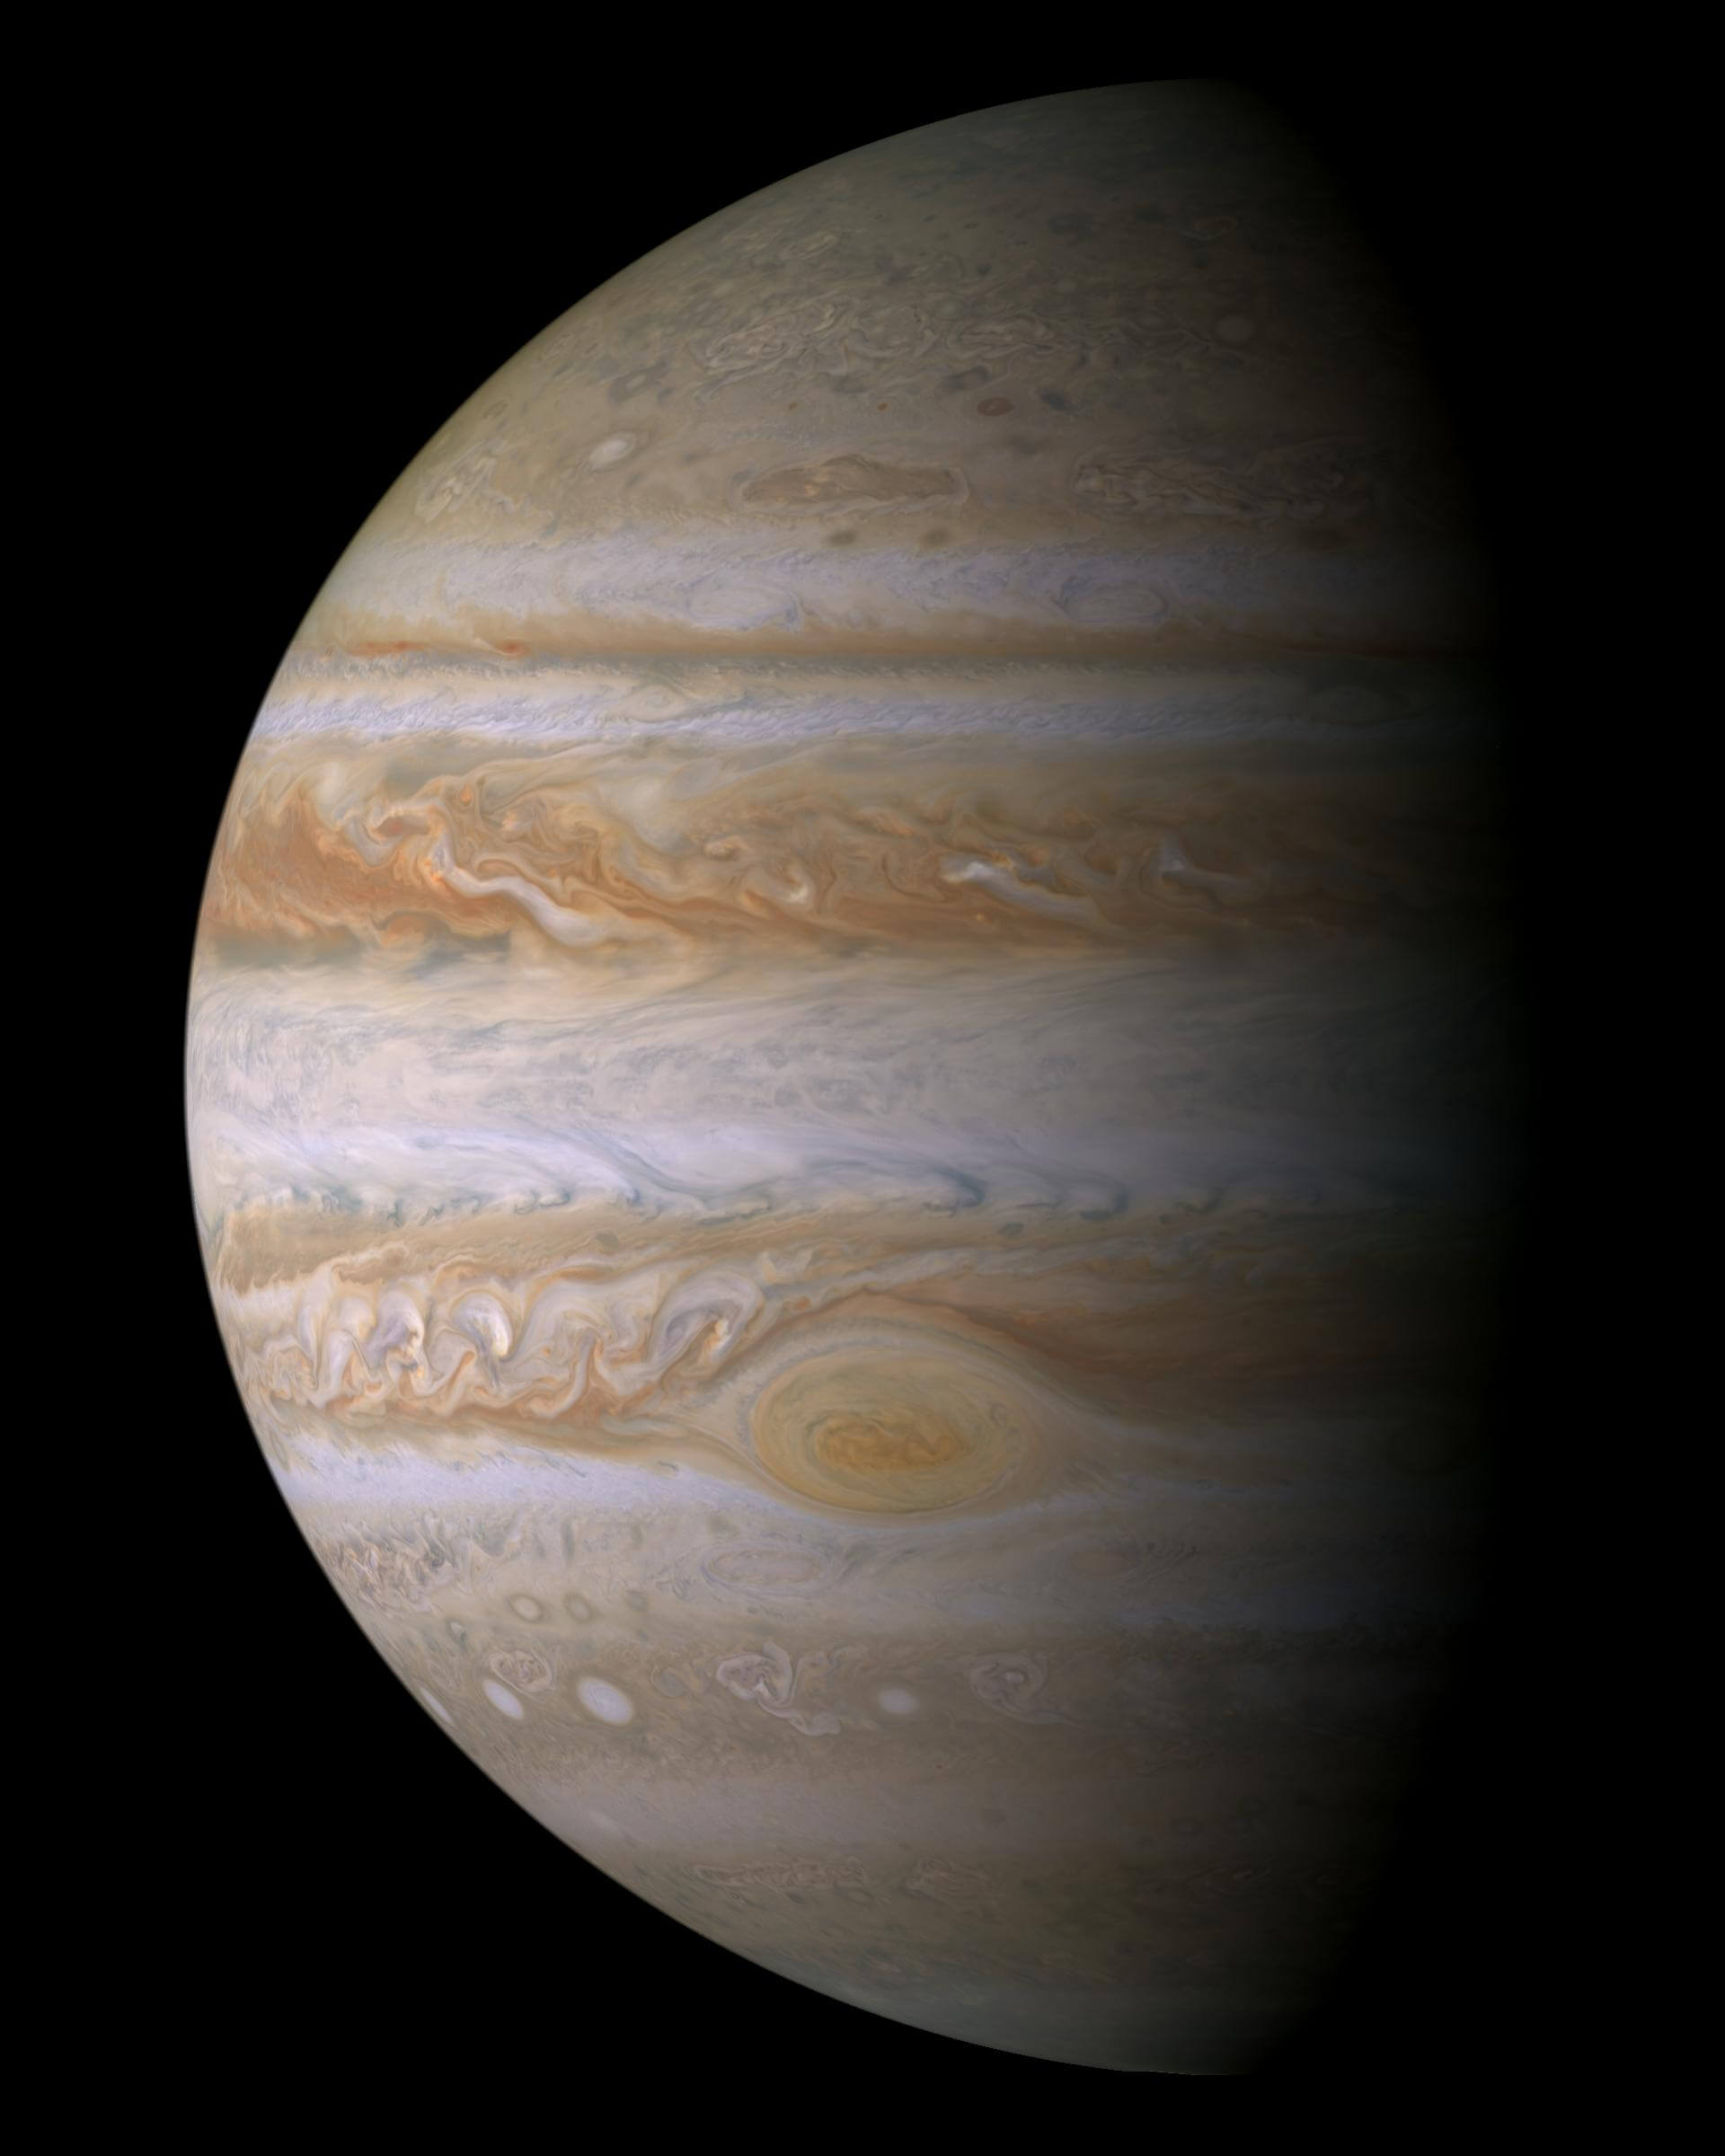
True color mosaic of Jupiter, based on images taken by the narrow angle camera onboard NASA's Cassini spacecraft on December 29, 2000, during its closest approach to the giant planet at a distance of approximately 10 million kilometers (6.2 million miles). Credits: NASA/JPL/Space Science Institute
When the Juno mission reached Jupiter on July 5th, 2016, it became the second mission in history to establish orbit around the Solar System’s largest planet. And in the course of it conducting its many orbits, it has revealed some interesting things about Jupiter. This has included information about its atmosphere, meteorological phenomena, gravity, and its powerful magnetic fields.
And just yesterday – on Monday, July 10th at 7:06 p.m. PDT (11:06 p.m. EDT) – just days after the probe celebrated its first year of orbiting the planet, the Juno mission passed directly over Jupiter’s most famous feature – the Great Red Spot. This massive anticyclonic storm has been a focal point for centuries, and Juno’s scheduled flyby was the closest any mission has ever come to it.
Jupiter’s Great Red Spot was first observed during the late 17th century, either by Robert Hooke or Giovanni Cassini. By 1830, astronomers began monitoring this anticyclonic storm, and have noted periodic expansions and regressions in its size ever since. Today, it is 16,000 kilometers (10,000 miles) in diameter and reaches wind speeds of 120 meters per second (432 km/h; 286 mph) at the edges.
The Juno spacecraft isn’t the first one to visit Jupiter. Galileo went there in the mid 90’s, and Voyager 1 snapped a nice picture of the clouds on its mission. Credit: NASA
As part of its sixth orbit of Jupiter’s turbulent cloud tops, Juno passed close to Jupiter’s center (aka. perijove), which took place at 6:55 p.m. PDT (9:55 p.m. EDT). Eleven minutes later – at 7:06 p.m. PDT (10:06 p.m. EDT) – the probe flew over the Great Red Spot. In the process, Juno was at a distance of just 9,000 km (5,600 miles) from the anticyclonic storm, which is the closest any spacecraft has ever flown to it.
During the flyby, Juno had all eight of its scientific instruments (as well its imager, the JunoCam) trained directly on the storm. With such an array aimed at this feature, NASA expects to learn more about what has been powering this storm for at least the past three and a half centuries. As Scott Bolton, the principal investigator of Juno at the Southwest Research Institute (SwRI), said prior to the event in a NASA press release:
“Jupiter’s mysterious Great Red Spot is probably the best-known feature of Jupiter. This monumental storm has raged on the Solar System’s biggest planet for centuries. Now, Juno and her cloud-penetrating science instruments will dive in to see how deep the roots of this storm go, and help us understand how this giant storm works and what makes it so special.”
This perijove and flyby of the Giant Red Spot also comes just days after Juno celebrated its first anniversary around Jupiter. This took place on July 4th at 7:30 p.m. PDT (10:30 p.m. EDT), at which point, Juno had been in orbit around the Jovian planet for exactly one year. By this time, the spacecraft had covered a distance of 114.5 million km (71 million mi) while orbiting around the planet.
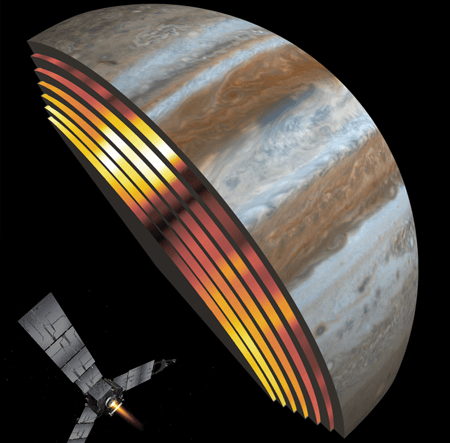
This artist’s illustration shows Juno’s Microwave Radiometer observing deep into Jupiter’s atmosphere. The image shows real data from the 6 MWR channels, arranged by wavelength. Credit: NASA/SwRI/JPL
The information that Juno has collected in that time with its advanced suite of instruments has already provided fresh insights into Jupiter’s interior and the history of its formation. And this information, it is hoped, will help astronomers to learn more about the Solar System’s own history of formation. And in the course of making its orbits, the probe has been put through its paces, absorbing radiation from Jupiter’s powerful magnetic field.
As Rick Nybakken, the project manager for Juno at NASA’s Jet Propulsion Laboratory, put it:
“The success of science collection at Jupiter is a testament to the dedication, creativity and technical abilities of the NASA-Juno team. Each new orbit brings us closer to the heart of Jupiter’s radiation belt, but so far the spacecraft has weathered the storm of electrons surrounding Jupiter better than we could have ever imagined.”
The Juno mission is set to conclude this coming February, after completing 6 more orbits of Jupiter. At this point, and barring any mission extensions, the probe will be de-orbited to burn up in Jupiter’s outer atmosphere. As with the Galileo spacecraft, this is meant to avoid any possibility of impact and biological contamination with one of Jupiter’s moons.
A photo of the full moon, taken from Apollo 11 on its way home to Earth, from about 18,520 km (10,000 nm) away. Credit: NASA
The Moon has been around since the earliest days of the Solar System. To human beings, there has never been a time when we couldn’t look up in the night sky and either see the Moon hanging there, or know that it would be back the very next night (i.e. a New Moon). And thanks to the development of modern astronomy and space exploration, our understanding of the Moon has grown immensely.
For instance, we know that the Moon formed early in Earth’s history, and that it may have played an important role in the development of life here on Earth. We’ve also learned that Moon is tidally-locked with Earth, which means that one side is constantly facing towards it. But how long is a day on the Moon? With one side facing the Earth and the other side facing out, what constitutes a single day on the lunar surface?
To break it down simply, a day on the Moon lasts as long as 29.5 Earth days. In other words, if you were standing on the surface of the Moon, it would take 29.5 days for the Sun to move all the way across the sky and return to its original position again. However, as with all bodies in the Solar System, distinguishing between different types of days (based on different types of periods) is necessary.
Orbit and Rotation:
Since ancient times, lunar calendars have been based on thirteen months of 28 days each, reflecting the lunar cycle. But as astronomers have discovered from centuries of studying the Moon’s behavior, the Moon’s orbital period (i.e. the time it takes for the Moon to complete a single orbit around the Earth) is actually the equivalent of about 27.3 Earth days – or 27 days 7 hours 43 minutes and 11.5 seconds, to be precise.
And while the Moon rotates on its own axis, the speed at which it rotates (aka. it’s sidereal rotation) is very slow. In fact, it takes the Moon the equivalent of 27.3 Earth days to complete a single rotation on its axis, the same amount of time it takes to complete a single orbit around Earth. What this means is that the Moon is tidally-locked with Earth.
In other words, the Moon always points the same face towards the Earth, which is why human beings are so familiar with the “face” of the Moon, and refer to the side that faces away from us as the “the dark side”. Therefore, if you were standing on the surface of the Moon, you would always see the Earth in exactly the same position, while the stars and the Sun would continue to move around in the sky.
Sidereal vs. Synodic Day:
However, the Moon’s sidereal rotation is not where we get a the value of a single lunar day from. While it takes 27.3 days for it to orbit the Earth, we have to keep in mind that the Earth is also orbiting the Sun. The Earth returns to its same position in orbit every 365 days. So in order for the Sun to catch up to its same position in the sky from the perspective of the Moon, it has to turn a little more.
The extra 2.2 days is the time for the Moon to catch up in its rotation. And while the amount of time the Moon takes to complete one turn on its axis with respect to the stars is 27.3 days (a sidereal day), the amount of time it takes for the Sun to return to the same position in the sky is called a synodic day, and that’s what takes 29.5 days.
Ergo, a single day on the Moon, with respect to the Sun returning to the same position in the sky, is actually about as long as an average month here on Earth. So if people are planning on living there someday, and aren’t living in the permanently shadowed craters that exist in the southern and norther polar regions, that’s something they might have to get used to.
As with all the bodies of the Solar System, it all comes down to a matter of perspective. And if you’re living on the Moon, your perspective on what constitutes a day will be vastly different from that of a person who was born on Earth.
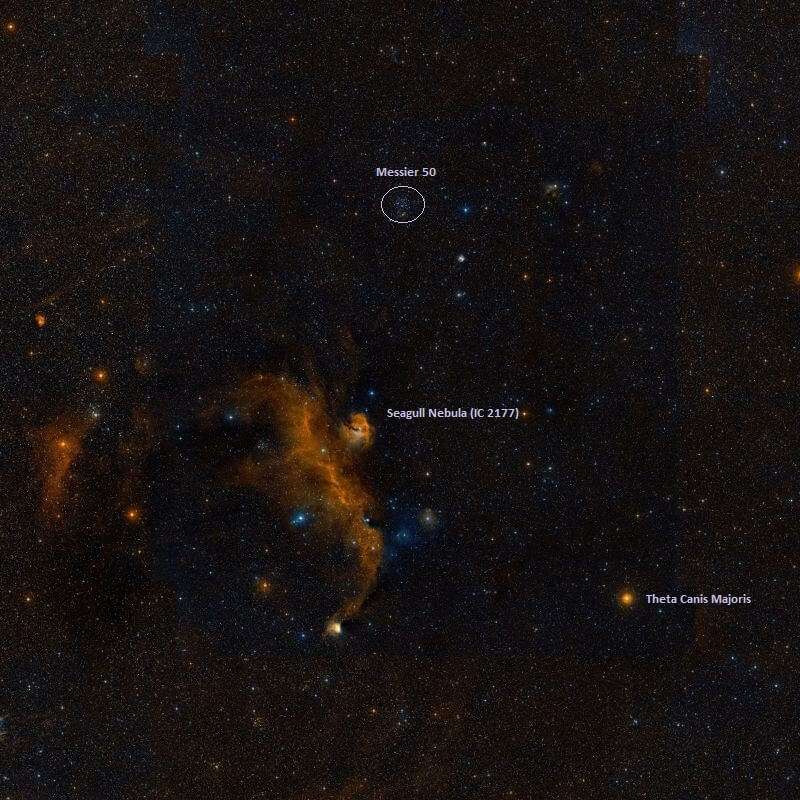
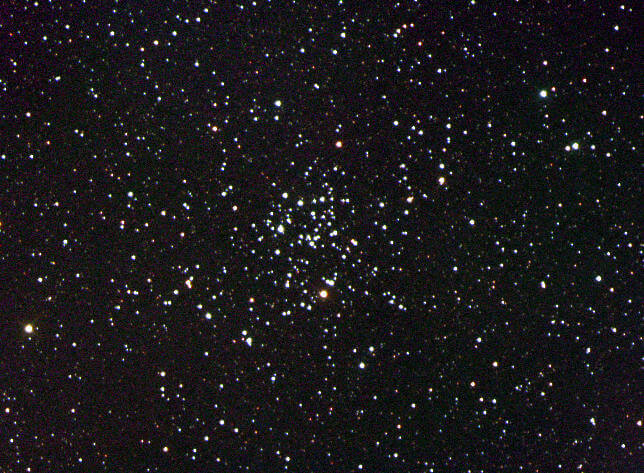
The Messier 50 open star cluster, shown in proximity to the Seagull Nebula (IC 2177). Credit: Wikisky
Welcome back to Messier Monday! We continue our tribute to our dear friend, Tammy Plotner, by looking at the open star cluster of Messier 50. Enjoy!
In the 18th century, while searching the night sky for comets, French astronomer Charles Messier kept noting the presence of fixed, diffuse objects in the night sky. In time, he would come to compile a list of approximately 100 of these objects, with the purpose of making sure that astronomers did not mistake them for comets. However, this list – known as the Messier Catalog – would go on to serve a more important function.
One of these objects is the open star cluster known as Messier 50 (aka. NGC 2323). Located at a distance of about 3,200 light-years from Earth, this object sits near the border between the Monoceros and Canis Major constellations. It is described as a ‘heart-shaped’ figure, occupies an area about half the size of the full Moon, and is easy to find because of its proximity to Sirius (the brightest star in the night sky).
Description:
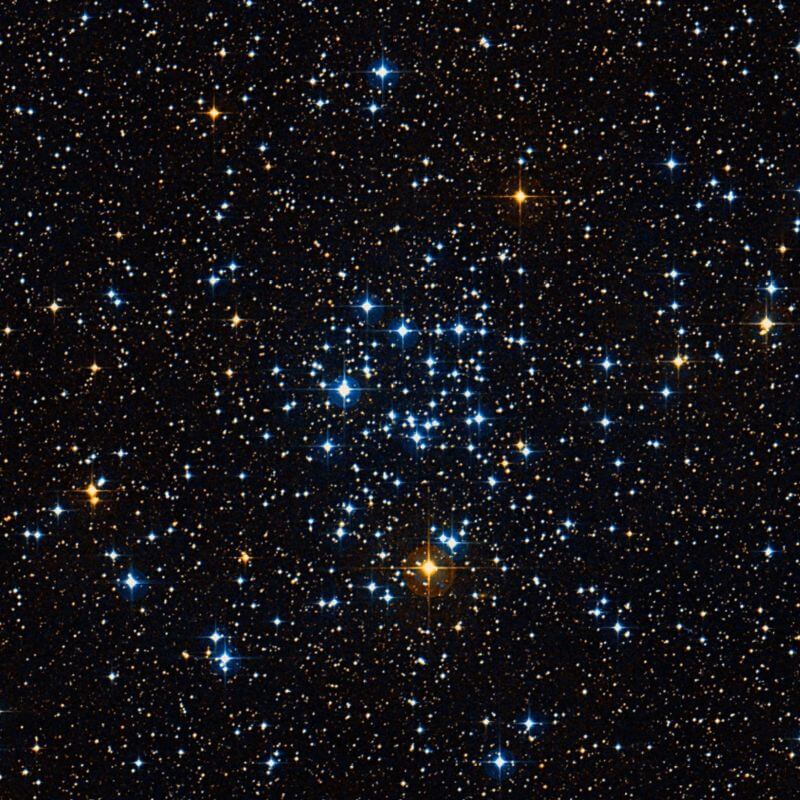
Located about 3,200 light years from our solar system, this stellar gathering could be perhaps as much as 20 light years across, but the central concentration is believed to only span across roughly 10 light years. While that doesn’t seem that large, it’s lit by the candlepower of what could be 200 stars! And picking such a group of stars out of a well-known OB1 association isn’t easy. It requires photometry. As J.J. Claria (et al) remarked in a 1997 study:
“UBV and DDO photoelectric photometry in the field of the open cluster NGC 2323 is presented. The analysis yields 109 probable members; one of them being a red giant, and 3 possible members. The basic cluster parameters are derived. NGC 2323 appears not to be physically connected to the CMa OB1 association.”
Close up of the Messier 50 open star cluster. Credit: Wikisky
In this region of the sky are vast molecular clouds compressing into star forming regions known as OB1 associations. The stars spawned by these vast clouds form into open clusters containing dozens to thousands of members and, over time, disassociate with not only the molecular cloud, but their sibling star clusters as well. Sure, it took 100-120 million years for it to happen, but as the group of stars cut away from the field, each member also aged differently.
By studying open clusters like M50 and its relative M35, we can learn more about the dynamics of star clusters which formed roughly at the same time in the same area. As Jasonjot Kalirai (et al) indicated in their 2003 study:
“The color-magnitude diagrams for the clusters exhibit clear main sequences stretching over 14 mag in the (V, B-V)-plane. Comparing these long main sequences with those of earlier clusters in the survey, as well as with the Hyades, has allowed for accurate distances to be established for each cluster. Analysis of the luminosity and mass functions suggests that, despite their young ages, both clusters are somewhat dynamically relaxed, exhibiting signs of mass segregation. This is especially interesting in the case of NGC 2323, which has an age of only 1.3 times the dynamical relaxation time. The present photometry is also deep enough to detect all of the white dwarfs in both clusters. We discuss some interesting candidates that may be the remnants of quite massive (M>=5Msolar) progenitor stars. The white dwarf cooling age of NGC 2168 is found to be in good agreement with the main-sequence turnoff age. These objects are potentially very important for setting constraints on the white dwarf initial-final mass relationship and the upper mass limit for white dwarf production.”
So, did age or movement produce the colorful display of stars we can observe in M50 – or was it simply the chemical ingredients responsible? According to a 2005 study conducted by Bragaglia and Monica:
“We describe a long-term project aimed at deriving information on the chemical evolution of the Galactic disk from a large sample of open clusters. The main property of this project is that all clusters are analyzed in a homogeneous way to guarantee the robustness of the ranking in age, distance, and metallicity. Special emphasis is devoted to the evolution of the earliest phases of the Galactic disk evolution, for which clusters have superior reliability with respect to other types of evolution indicators. The project is twofold: on one hand we derive the age, distance, and reddening (and indicative metallicity) by interpreting deep and accurate photometric data with stellar evolution models, and on the other hand, we derive the chemical abundances from high-resolution spectroscopy. The importance of quantifying the theoretical uncertainties by deriving the cluster parameters with various sets of stellar models is emphasized. Stellar evolution models assuming overshooting from convective regions appear to better reproduce the photometric properties of the cluster stars. The examined clusters show a clear metallicity dependence on the galactocentric distance and no dependence on age. The tight relation between cluster age and magnitude difference between the main-sequence turnoff and the red clump is confirmed.”
The M50 open cluster. Credit: Ole Nielsen
History of Observation:
While M50 was possibly discovered by G.D. Cassini 1711, it was independently recovered by Charles Messier on the night of April 5th, 1772. In his notes, he wrote of his discovery:
“Cluster of small stars, more or less brilliant, above the right loins of the Unicorn, above the star Theta of the ear of Canis Major, & near a star of 7th magnitude. It was while observing the Comet of 1772 that M. Messier observed this cluster. He has reported it on the chart of that comet, on which its trace has been drawn.”
It would later be observed by William Hershel, but not until his son John cataloged it before anyone began to notice colors in the stars. However, Admiral Smyth did!
“This is an irregularly round and very rich mass, occupying with its numerous outliers more than the field, and composed of stars from the 8th to the 16th magnitudes; and there are certain spots of splendour which indicate minute masses beyond the power of my telescope. The most decided points are, a red star towards the southern verge, and a pretty little equilateral triangle of 10th sizers, just below, or north of it. The double star here noted was carefully estimated under a full knowledge of the vertical and parallel lines of the field of view: this was made triple by H. [John Herschel], whose 2357 of the Fifth Series it is; but he must be mistaken in calling it Struve 748, which is Theta Orionis. It is sufficiently conspicuous as a double star, and though I perceive an infinitesimal point exactly om the vertical of A, I cannot ascertain whether it is H.’s C. This superb object was discovered by Messier in 1771 [actually 1772], and registered “a mass of small stars more or less brilliant.” It is 9 deg north-north-east of Sirius, and rather more than one-third of the distance between that star and Procyon.”
Locating Messier 50:
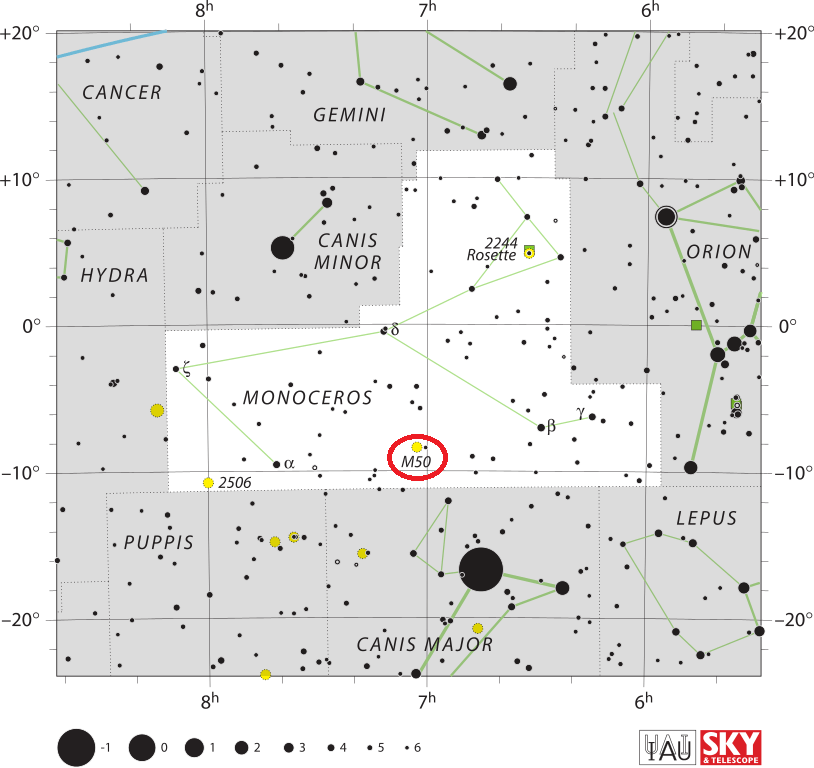
Because M50 is such a big and bright open star cluster, it’s relatively easy to find with complicated starhop instructions. Actually, the constellation of Monoceros is more difficult! Begin by identifying the brightest star in northern hemisphere skies – Alpha Canis Major – Sirius. Roughly a handspan to the northeast you’ll see another prominent bright star – Alpha Canis Minor – Procyon.
The location of Messier 50 in the Monoceros constellation. Credit: IAU/Sky & Telescope magazine (Roger Sinnott & Rick Fienberg)
Between these two lay the faint and indistinguishable constellation of Monoceros, and slightly southwest of the center point is Messier 50. In small binoculars and a telescope finderscope, you’ll quickly spot a compression in the starfield, and may even be able to see it as a slight contrast change with the unaided eye. In larger binoculars and small telescopes, it blooms into a cloud of stars, well resolved against the grainy backdrop of fainter stars.
In large aperture telescopes, even more stars resolve and colors begin to appear. Because of magnitude and the nature of star clusters, Messier 50 makes an outstanding target for high light pollution areas, moonlit nights and even less than perfect sky conditions.
Enjoy your own “colorful” observations of this rich and beautiful star cluster!
And as always, here are the quick facts on this Messier Object to help you get started:
Object Name: Messier 50 Alternative Designations: M50, NGC 2323 Object Type: Open Galactic Star Cluster Constellation: Monoceros Right Ascension: 07 : 03.2 (h:m) Declination: -08 : 20 (deg:m) Distance: 3.2 (kly) Visual Brightness: 5.9 (mag) Apparent Dimension: 16.0 (arc min)
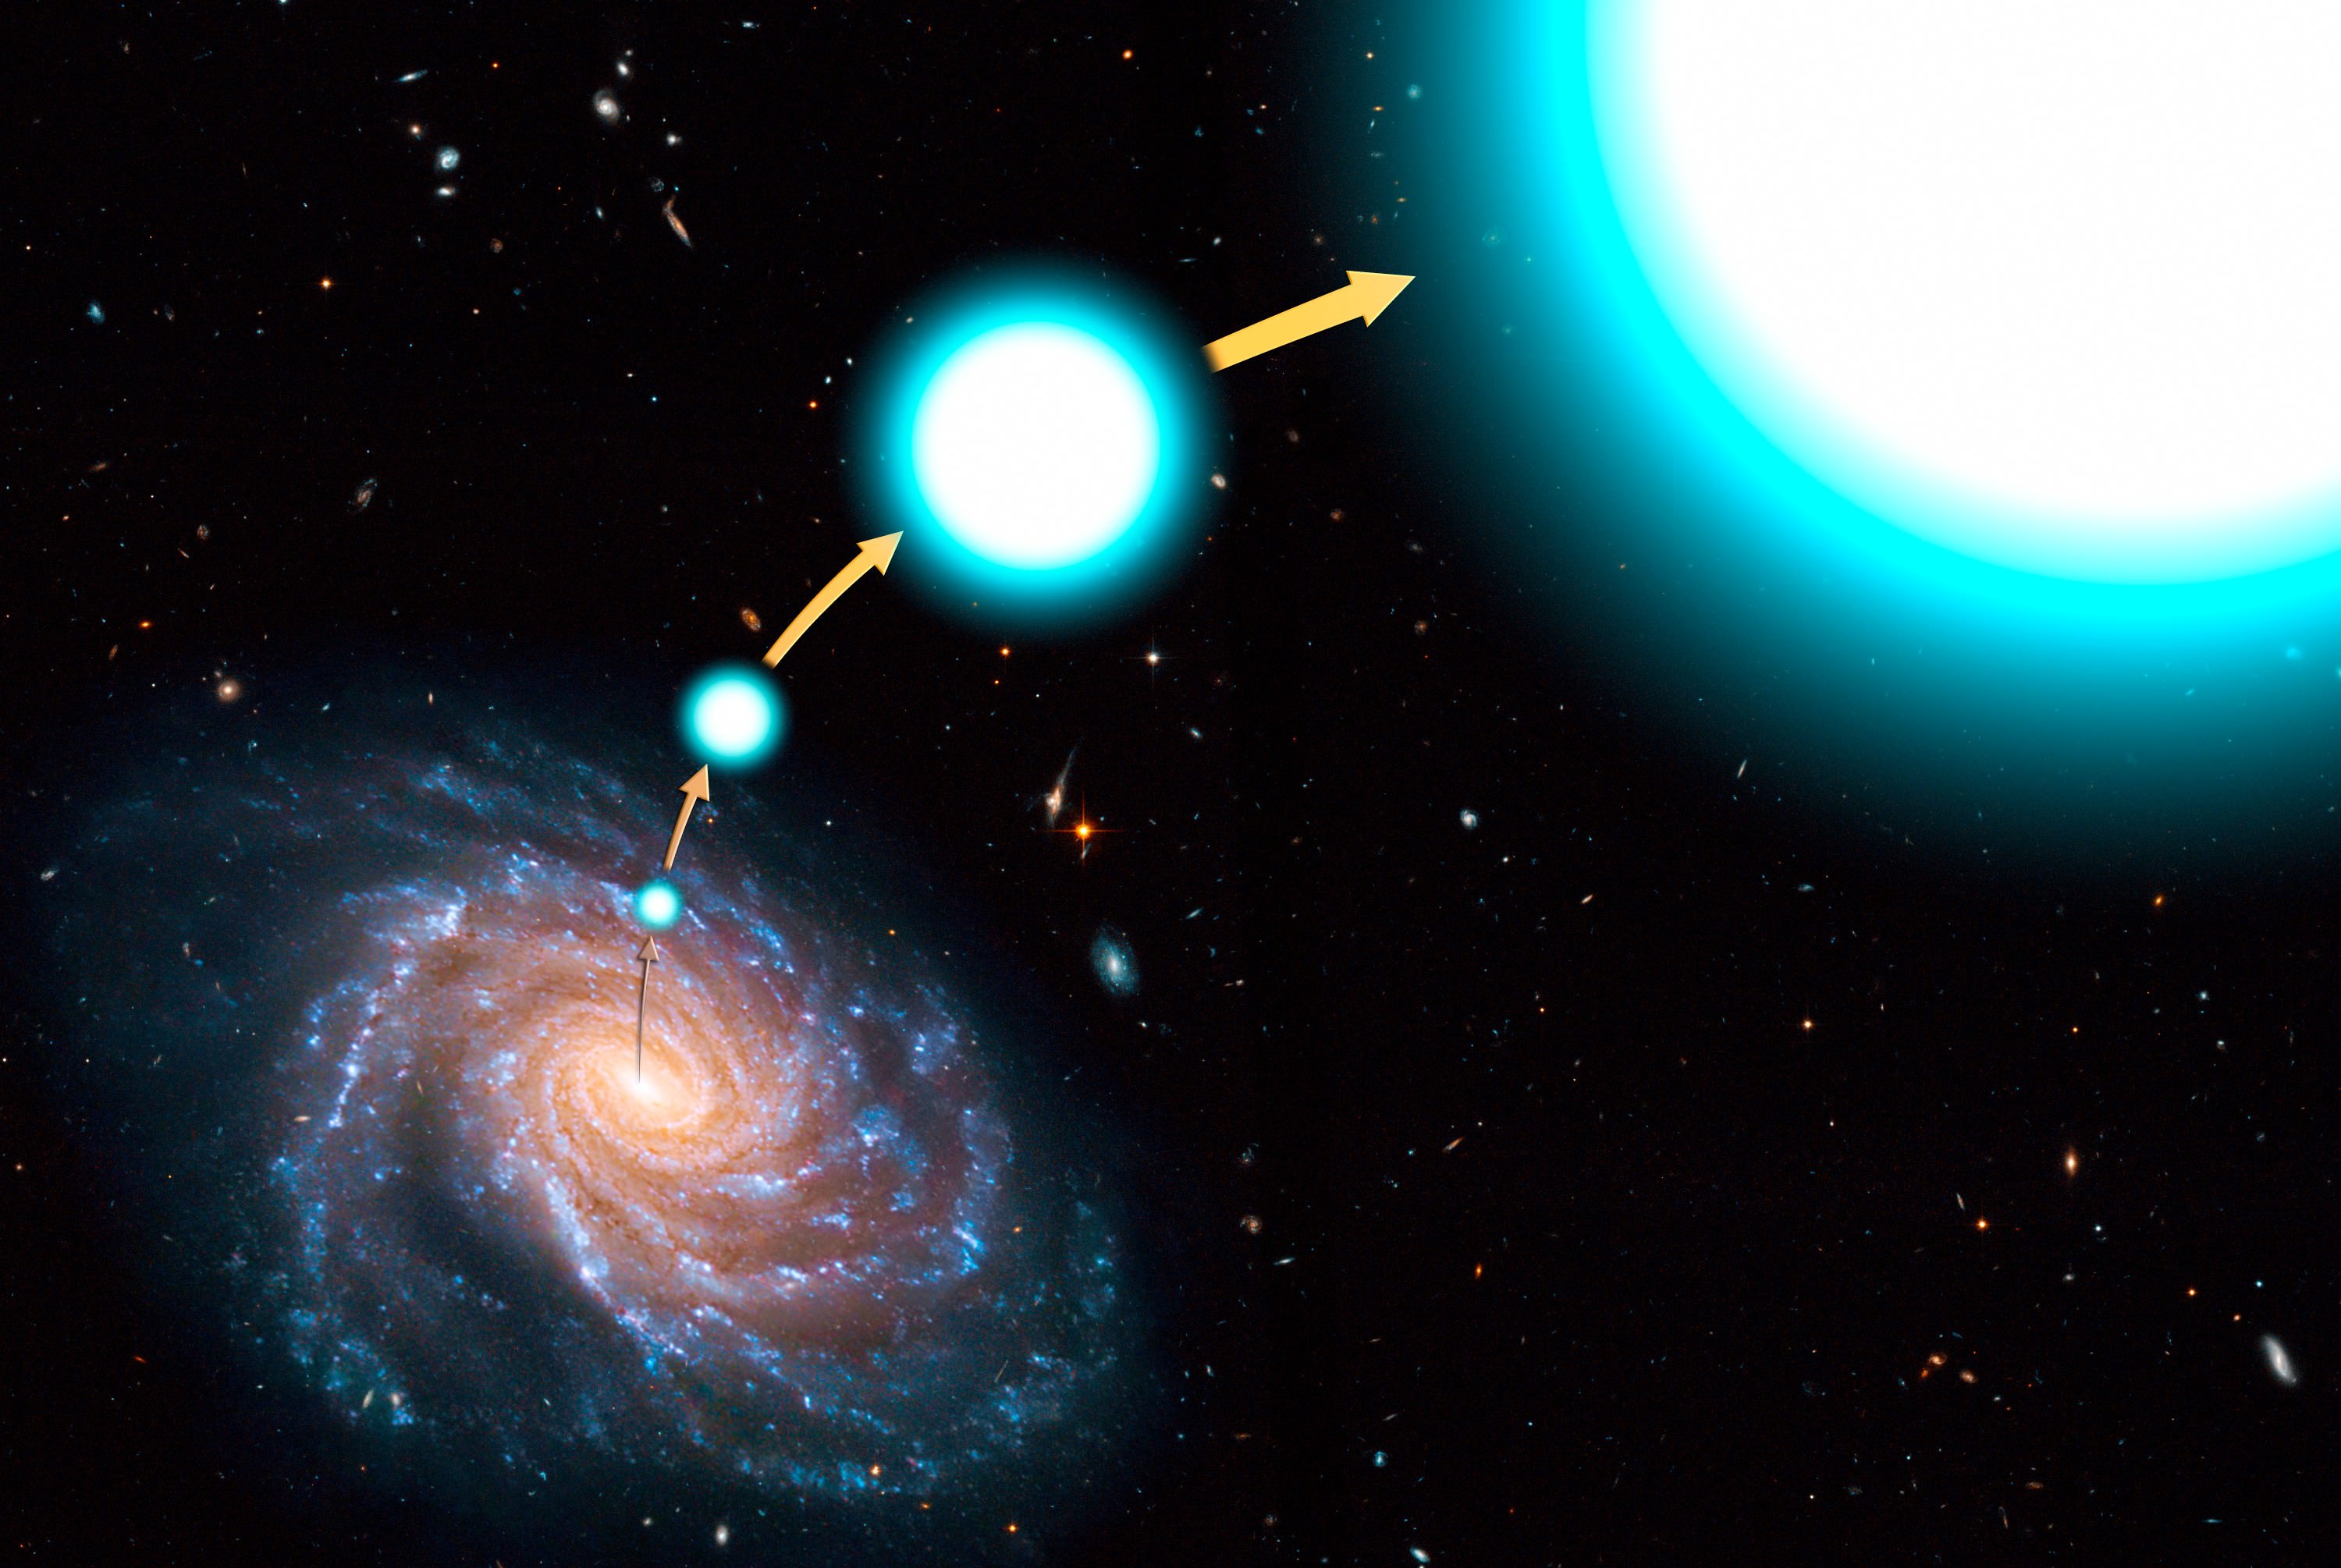
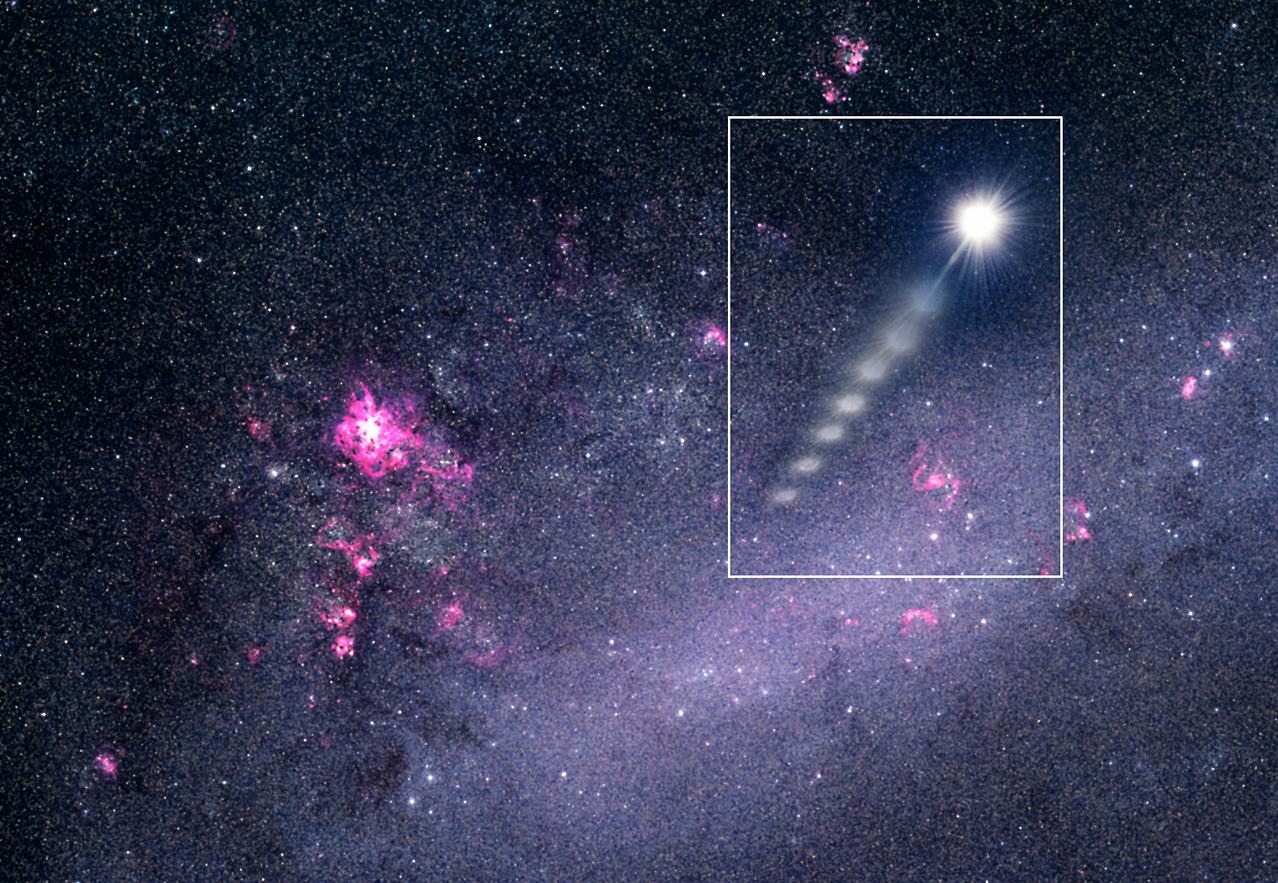
An artist's conception of a hypervelocity star that has escaped the Milky Way. Credit: NASA
In 2013, the European Space Agency launched the Gaia spacecraft. As the successor to the Hipparcos mission, this space observatory has spent the past three and a half years gathering data on the cosmos. Before it retires sometime next year (though the mission could be extended), this information will be used to construct the largest and most precise 3D astronomical map ever created.
In the course of surveying the cosmos, Gaia has also revealed some very interesting things along the way. For example, after examining the Gaia catalog with a specially-designed artificial neural network, a team of European researchers recently detected six new hypervelocity stars in the Milky Way. And one of these stars is moving so fast that it may eventually leave our galaxy.
Artist’s conception of the Gaia telescope backdropped by a photograph of the Milky Way taken at the European Southern Observatory. Credit: ESA/ATG medialab; background: ESO/S. Brunier
Hypervelocity stars are a rare and fascinating thing. Whereas all stars in the Milky Way are in constant motion, orbiting around the center of our galaxy, some are accelerated to speeds of up to hundreds of kilometers per second. In the past, astronomers have deduced that these fast-moving stars are the result of a close stellar encounter or a supernova explosion of a stellar companion.
And a little over a decade ago, astronomers became aware of a new class of high-speed stars that are believed to have been accelerated from past interactions with the supermassive black hole (Sagittarius A*) that sits at the center of our galaxy. These stars are extremely important to the study of the overall structure of the Milky Way, as they are indicative of the kinds of events and forces that have shaped its history.
As Elena Maria Rossi, from Leiden University in the Netherlands and one of the co-authors on the paper, explained in an ESA press release:
“These are stars that have traveled great distances through the Galaxy but can be traced back to its core – an area so dense and obscured by interstellar gas and dust that it is normally very difficult to observe – so they yield crucial information about the gravitational field of the Milky Way from the centre to its outskirts.“
Artist’s impression of stars speeding through the Galaxy. Credit: ESA
Finding such stars is no easy task, mainly because their velocity makes them extremely difficult to spot in the vast and crowded disk of the Milky Way. As a result, scientists have relied on looking for young, massive stars (2.5 to 4 Solar masses) in the old stellar population of the Galactic. Basically, their young age and high masses are indications that they might not have originated there.
Combined with measurements of their past speeds and paths, this method has confirmed the existence of hypervelocity stars in the past. However, only 20 hypervelocity stars have been spotted to date, and they have all been young and massive in nature. Scientists believe that many more stars of other ages and masses are also being accelerated through the Milky Way, but were previously unable to spot them.
To address this, the European team – led by from Tomasso Marchetti of Leiden University in the Netherlands – began considering how to use Gaia‘s vast dataset to optimize the search for more hypervelocity stars. After testing various methods, they adopted the artificial neural net approach – i.e. using a machine learning algorithm – to search through the star census data Gaia is in the process of gathering.
Beginning in the first half of 2016, the team began developing and training this program to be ready for the first release of Gaia data – which occurred a few months later on Sept. 14th, 2016. As Tommaso Marchetti, a PhD student at Leiden University, described the process:
“In the end, we chose to use an artificial neural network, which is software designed to mimic how our brain works. After proper ‘training’, it can learn how to recognize certain objects or patterns in a huge dataset. In our case, we taught it to spot hypervelocity stars in a stellar catalogue like the one compiled with Gaia.”
Artist’s impression of a hypervelocity star that was detected using the ESO’s Very Large Telescope. Credit: ESO
In addition to a map with the positions of over a billion stars, this first data release included a smaller catalogue with the distances and motions for two million stars. This catalog – which is known as the Tycho-Gaia Astrometric Solution (TGAS) – combined data from both the first year of the Gaia mission and with data from the Hipparcos mission, and is essentially a taste of what’s to come from Gaia.
On the day of the catalog’s release, Marchetti and his team ran their algorithm on the two million stars within the TGAS, which revealed some interesting finds. “In just one hour, the artificial brain had already reduced the dataset to some 20 000 potential high-speed stars, reducing its size to about 1%,” said Rossi. “A further selection including only measurements above a certain precision in distance and motion brought this down to 80 candidate stars.”
The team then examined these 80 stars in more detail, and compared the information about their motions to data from other catalogues. Paired with additional observations, they eventually found six stars which appeared to be moving faster than 360 km/s. One even appeared to be exceeding 500 km/s, which means that it is no longer bound by the gravity of our Milky Way and will eventually leave it altogether.
But perhaps the sot significant aspect of this find is the fact these stars are not particularly massive like the previous 20 that had been discovered, and were comparable in mass to our Sun. In addition, the 5 slower stars are likely to become a focal point of study, as scientists are eager to determine what slowed them down. One possible explanation is that interaction with the galaxy’s dark matter might have been responsible.
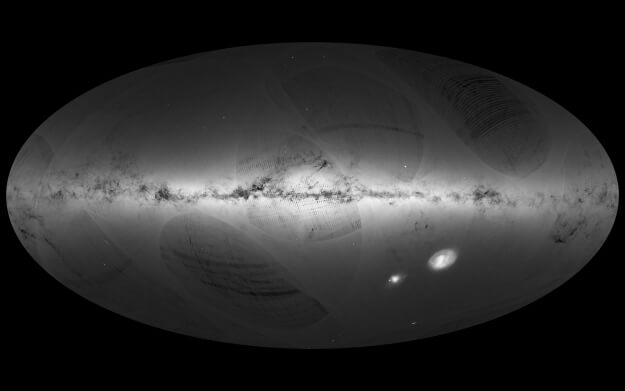
Gaia’s first sky map. Credit: ESA/Gaia/DPAC. Credit: A. Moitinho & M. Barros (CENTRA – University of Lisbon), on behalf of DPAC.
Much as the TGAS has been merely an early indication of the vast and valuable data Gaia will eventually provide, this study showcases the kinds of discoveries and research that this data will enable. By with not just 2 million, but a billion stars to study, astronomers are sure to reveal many new and exciting things about the dynamics of our Milky Way and the kinds of forces that have shaped it.
For this purpose, Marchetti and his team are upgrading their program to handle the much larger data set, which is scheduled to be released in April of 2018. This catalog will include distance and motions for over a billion stars, as well as velocities for a specific subset. From this, the team may find that fast-moving stars which are being booted out of the Milky Way are a lot more common than previously thought.
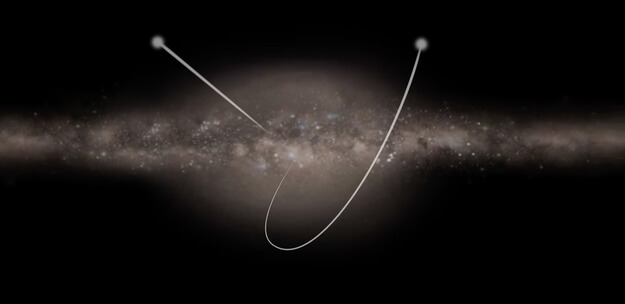
And be sure to enjoy this video that shows the paths of these six newly-discovered fast-moving stars, courtesy of the ESA:
Welcome to another edition of Constellation Friday! Today, in honor of the late and great Tammy Plotner, we take a look at the “Raven” – the Corvus constellation. Enjoy!
In the 2nd century CE, Greek-Egyptian astronomer Claudius Ptolemaeus (aka. Ptolemy) compiled a list of all the then-known 48 constellations. This treatise, known as the Almagest, would be used by medieval European and Islamic scholars for over a thousand years to come, effectively becoming astrological and astronomical canon until the early Modern Age.
One of these constellation is the Corvus constellation, a southern constellation whose name in Latin means “the Raven”. Bordered by the constellations of Virgo, Crater and Hydra, it is visible at latitudes between +60° and -90° and is best seen at culmination during the month of May. Today, it is one of the 88 modern constellations recognized by the International Astronomical Union (IAU).
Name and Meaning:
In classical mythology, Corvus represents the Raven, and is both a charming and sad tale. Legend tells us that the constellation of Crater is the cup of the gods. This cup belonged to the god of the skies himself, the venerable archer-god Apollo. And who holds this cup, dressed in black? The Raven, Corvus.
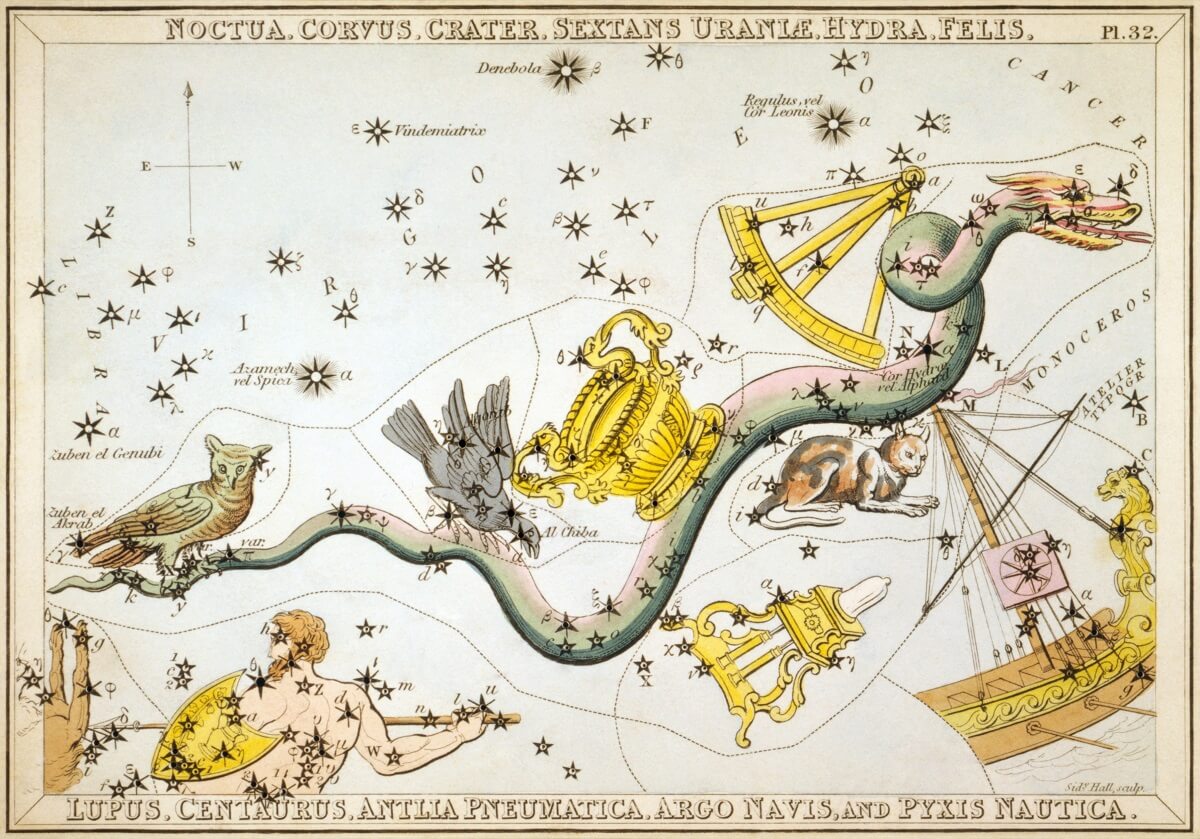
“Noctua, Corvus, Crater, Sextans Uraniæ, Hydra, Felis, Lupus, Centaurus, Antlia Pneumatica, Argo Navis, and Pyxis Nautica”, plate 32 in Urania’s Mirror, by Sidney Hall. Credit: Library of Congress
The story of a creature sent to fetch water for his master, only to stop to eat figs. Corvus tarried too long, waiting on a fig to ripen. When he realized his mistake, the Raven returned to Apollo with his cup and brought along the serpent Hydra in his claws as well, claiming that the snake prevented him from filling the cup.
Realizing his feathered-friend’s lie, Apollo became angry and tossed the cup (Crater), the snake (Hydra) and the raven (Corvus) into the sky, where they became constellations for all eternity. He further punished the raven by making sure the cup would be out of reach, thus ensuring he would forever be thirsty.
History of Observation:
As with most of the 48 constellations recorded by Ptolemy, the Corvus constellation has roots that go back to ancient Mesopotamia. In the Babylonian star catalogues (dated to ca. 1100 BCE), Corvus was called the Babylonian Raven (MUL.UGA.MUSHEN), which sat on the tail of the Serpent – which was associated with Ningishzida, the Babylonian god of the underworld. This constellation was also sacred to the god of rains and storm (Adad).
By about 500 BCE, this constellation was introduced to the Greeks, along with Crater, Hydra, Aquila and Piscis Austrinus constellations. By the 2nd century CE, they were included by Ptolemy in his Almagest, which would remain the definitive source on astronomy and astrology to Medieval European and Islamic astronomers for many centuries.
In Chinese astronomy, the stars that make up Corvus are located within the Vermilion Bird of the South (Nán Fang Zhu Què). The four main stars depict a chariot (Zhen) while Alpha and Eta mark the linchpins for the wheels, and Zeta represents a coffin (Changsha).
In Indian astronomy, the first five stars in Corvus correspond to the Hast nakshatra – a lunar zodiacal constellation. This is one of is one of the 27 or 28 divisions of the sky, identified by the prominent stars in them, that the Moon passes through during its monthly cycle. While it is Hindu, it is still very similar to the divisions of the ecliptic plane referred to as the zodiac. The Moon takes approximately one day to pass through each nakshatra.
Notable Objects:
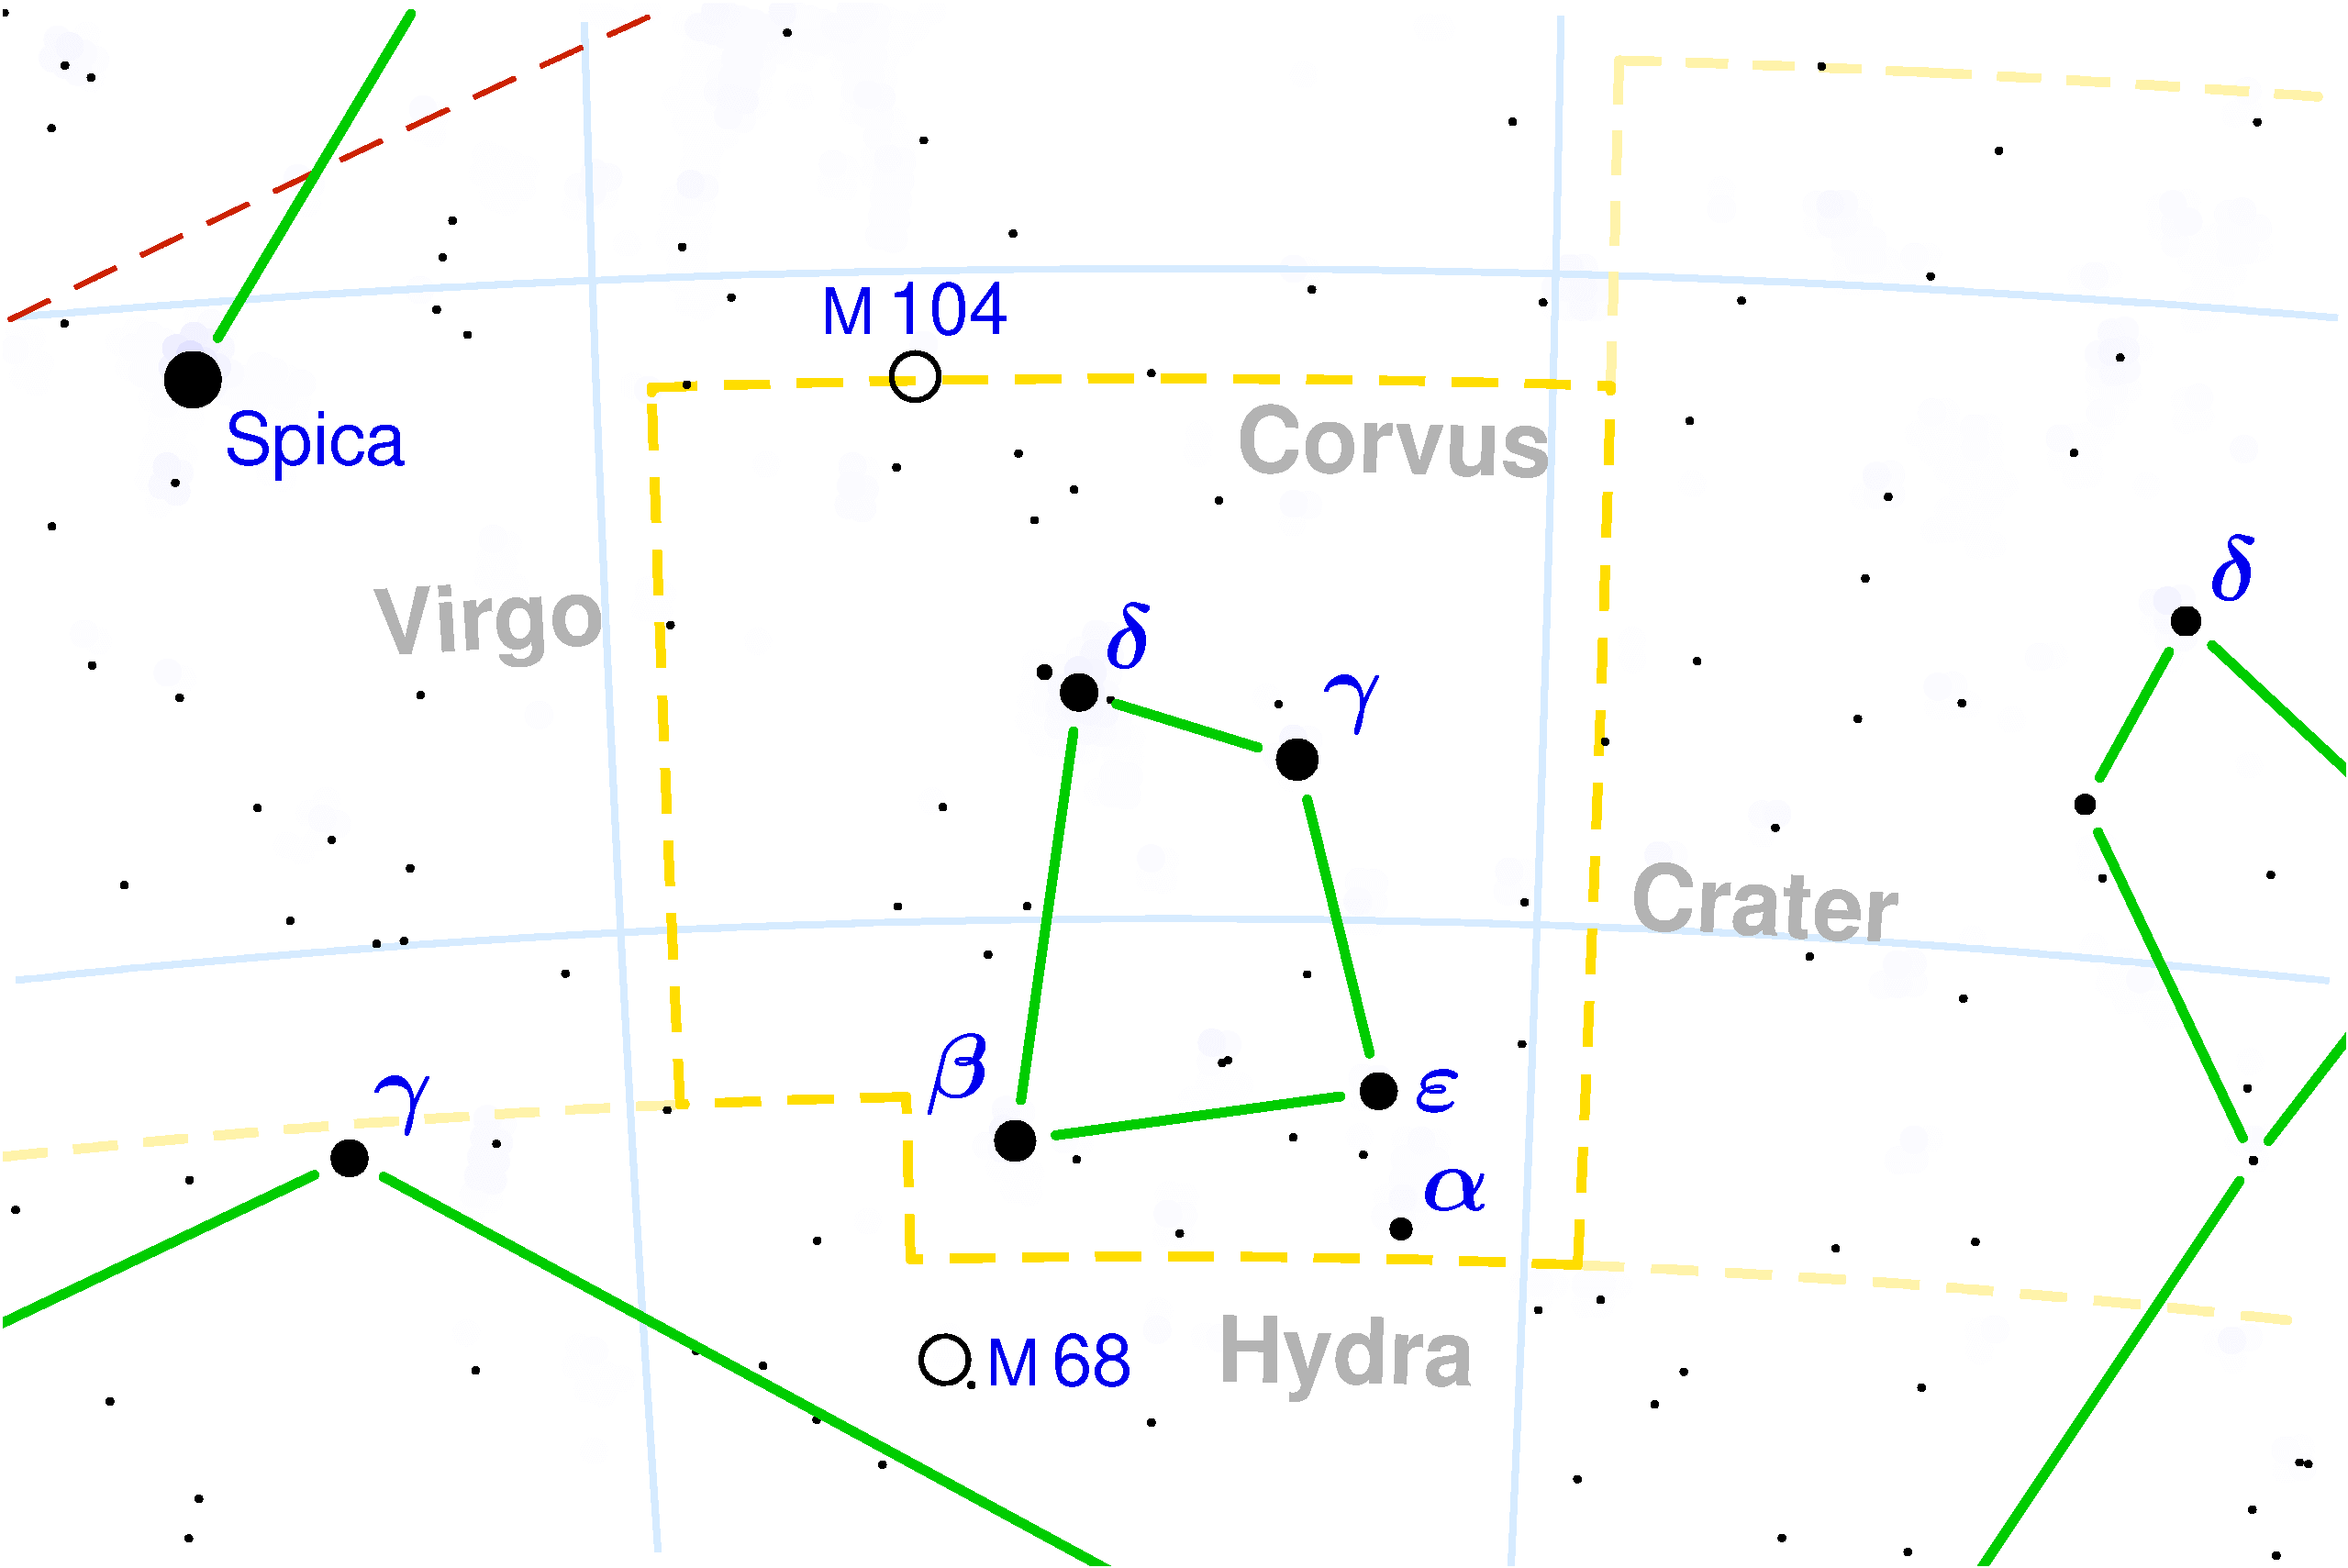
This small, box-like asterism has no bright star and consists of 11 stars which are visible to the unaided eye, yet Ptolemy only listed 7! There are 4 main stars and 10 which have Bayer/Flamsteed designations. For unaided eye observers, the Delta, Gamma, Epsilon and Beta (what appears to look like a figure 8, Y, E and B on the map) form an asterism that looks like a “sail”, and when connected seem to point to the bright star Spica.
The brightest star in Corvus is not even its alpha, but is Gamma Corvi. This giant star (which is thought to be a binary system) is located approximately 165 light years from Earth and is also known as Gienah, which comes from the Arabic phrase al-janah al-ghirab al-yaman (“the right wing of the crow”).
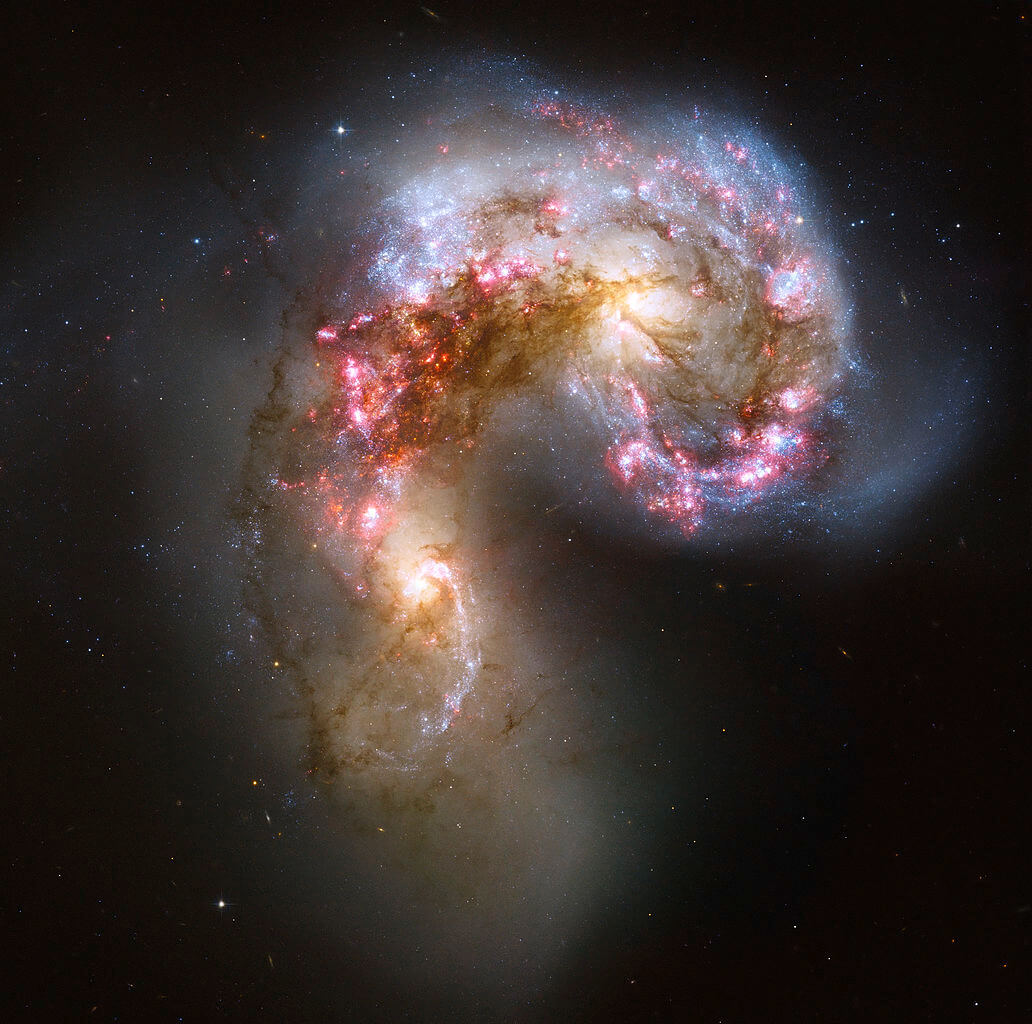
Antennae Galaxies – NGC 4038, NGC 4039. Credit: NASA, ESA, and the Hubble Heritage Team (STScI, AURA)-ESA, Hubble Collaboration
The second-brightest star, Beta Corvi, is a yellow-white G-type bright giant that is located about 140 light years from Earth. Its proper name, Kraz, was assigned to it in modern times, but the origin of the name is uncertain. Delta Corvi is a class A0 star in Corvus located approximately 87 light years distant from Earth whose traditional name (Algorab) comes from the Arabic word al-ghuraab – which means “the crow.”
Epsilon Corvi is a K2 III class star that is approximately 303 light-years from Earth. The star’s traditional name, (Minkar) comes from the Arabic word almánxar, which means “the nostril of the crow.” Alpha Corvi, which is only the fifth brightest star in the constellation, is a class F0 dwarf or subdwarf that is only 48.2 light years distant. The star’s traditional name (Alchiba) is derived from the Arabic al hibaa, which means “tent.”
Corvus is also home to many Deep Sky Objects. These include the Antennae Galaxies (NGC 4038/NGC 4039), a pair of interacting galaxies that were first discovered in the late 18th century. These colliding galaxies – which are located 45 million light years from Earth – are currently in the starburst stage, meaning they are experiencing an exceptionally high rate of star forming activity.
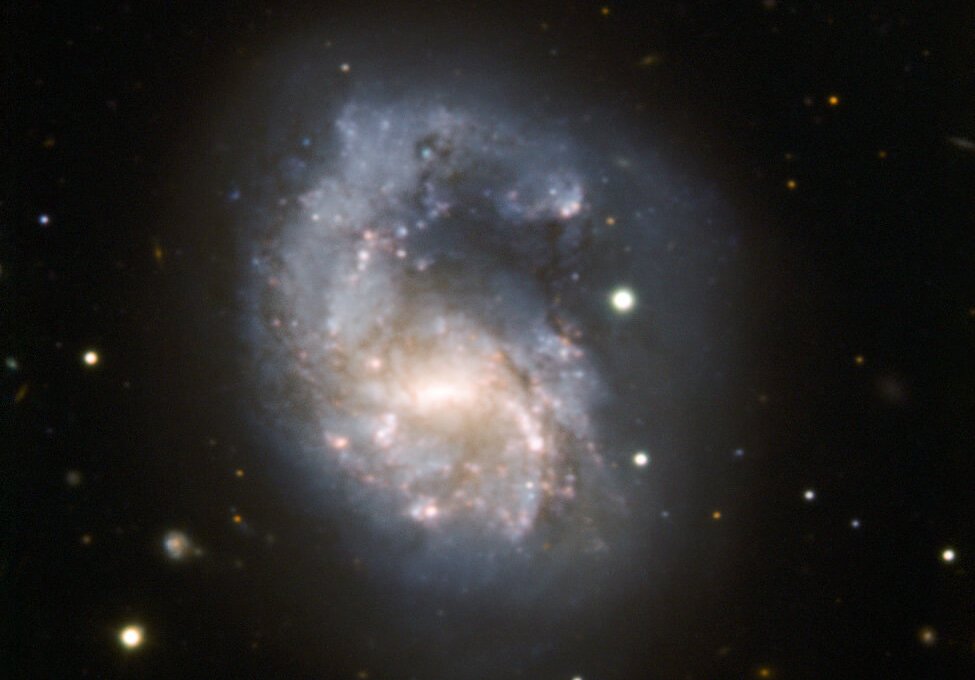
There’s also the NGC 4027 barred spiral galaxy, which is located about 83 million light years from Earth. This galaxy is peculiar, in that one of its spiral arm extends further than the other – possibly due to a past collision with another galaxy. Finally, there’s the large planetary nebula known as NGC 4361, which is located at the center of the constellation and resembled a faint elliptical galaxy.
The barred, spiral galaxy known as NGC 4027. Credit : ESO
Finding Corvus:
Let’s start with binoculars and look down at the southern corner, where we will find Alpha Corvi – aka. Alchiba. Alchiba belongs to the spectral class F0 and has apparent magnitude +4.00. This star is suspected of being a spectroscopic binary, although this has not yet been confirmed. Now take a look at Beta Corvi – aka. Kraz. Good old Kraz is approximately 140 light-years away and is a G-type bright giant star whose apparent visual magnitude varies between 2.60 and 2.66.
Head west and look at Epsilon. Although it doesn’t look any further away, spectral class K2 III – Minkar – is 303 light-years from Earth! Need a smile? Then take a look at Gamma, aka. Geinah. How about Delta? Algorab is a spectral class A0 and is about 87 light years from our solar system.
Now get out your telescope as we explore planetary nebula, NGC 4361 (RA 12 24 5 Dec -18 48). At around magnitude 10, this greenish disc is fairly easily spotted with smaller telescopes, but the 13th stellar magnitude central star requires larger aperture to be seen. It has a very symmetrical shape that is similar to a spiral galaxy.
For galaxy fans, have a look at interacting galaxy pair, NGC 4038 and NGC 4039 – the “Ringtail Galaxy” (RA 12 01 53 Dec -18 52-3). This peculiar galaxy (also referred to as the “Antennae Galaxies”) were both discovered by Friedrich Wilhelm Herschel in 1785. Even in relatively small telescopes, you can see two long tails of stars, gas and dust thrown out of the galaxies as a result of the collision that resemble the antennae of an insect.
Map of the Corvus Constellation. Credit: IAU and Sky&Telescope magazine
“The morphology of this object is complex given the highly filamentary structure of the envelope, which is confirmed to possess a low mass. The halo has a high expansion velocity that yields incompatible kinematic and evolutionary ages, unless previous acceleration of the nebular expansion is considered. However, the most remarkable result from the present observations is the detection of a bipolar outflow in NGC 4361, which is unexpected in a PN with a Population II low-mass-core progenitor. It is shown that shocks resulting from the interaction of the bipolar outflow with the outer shell are able to provide an additional heating source in this nebula.”
Most galaxies probably undergo at least one significant collision in their lifetimes. This is likely the future of our Milky Way when it collides with the Andromeda Galaxy. Two supernovae have been discovered in the galaxy: SN 2004GT and SN 2007sr. A recent study finds that these interacting galaxies are closer to the Milky Way than previously thought – at 45 million light-years instead of 65 million light-years. Geez… What’s 20 million light years between friends?
An artist's illustration of Pluto. Credit: NASA/New Horizons
Once held to be the outermost planet of the Solar System, Pluto‘s designation was changed by the International Astronomical Union in 2006, owing to the discovery of many new Kuiper Belt Objects that were comparable in size. In spite of this, Pluto remains a source of fascination and a focal point of much scientific interest. And even after the historic flyby conducted by the New Horizons probe in July of 2015, many mysteries remain.
What’s more, ongoing analysis of the NH data has revealed new mysteries. For instance, a recent study by a team of astronomers indicated that a survey by the Chandra X-ray Observatory revealed the presence of some rather strong x-rays emissions coming from Pluto. This was unexpected, and is causing scientists to rethink what they thought they knew about Pluto’s atmosphere and its interaction with solar wind.
In the past, many Solar bodies have been observed emitting x-rays, which were the result of interaction between solar wind and neutral gases (like argon and nitrogen). Such emissions have been detected from planets like Venus and Mars (due to the presence of argon and/or nitrogen in their atmospheres), but also with smaller bodies like comets – which acquire halos due to outgassing.
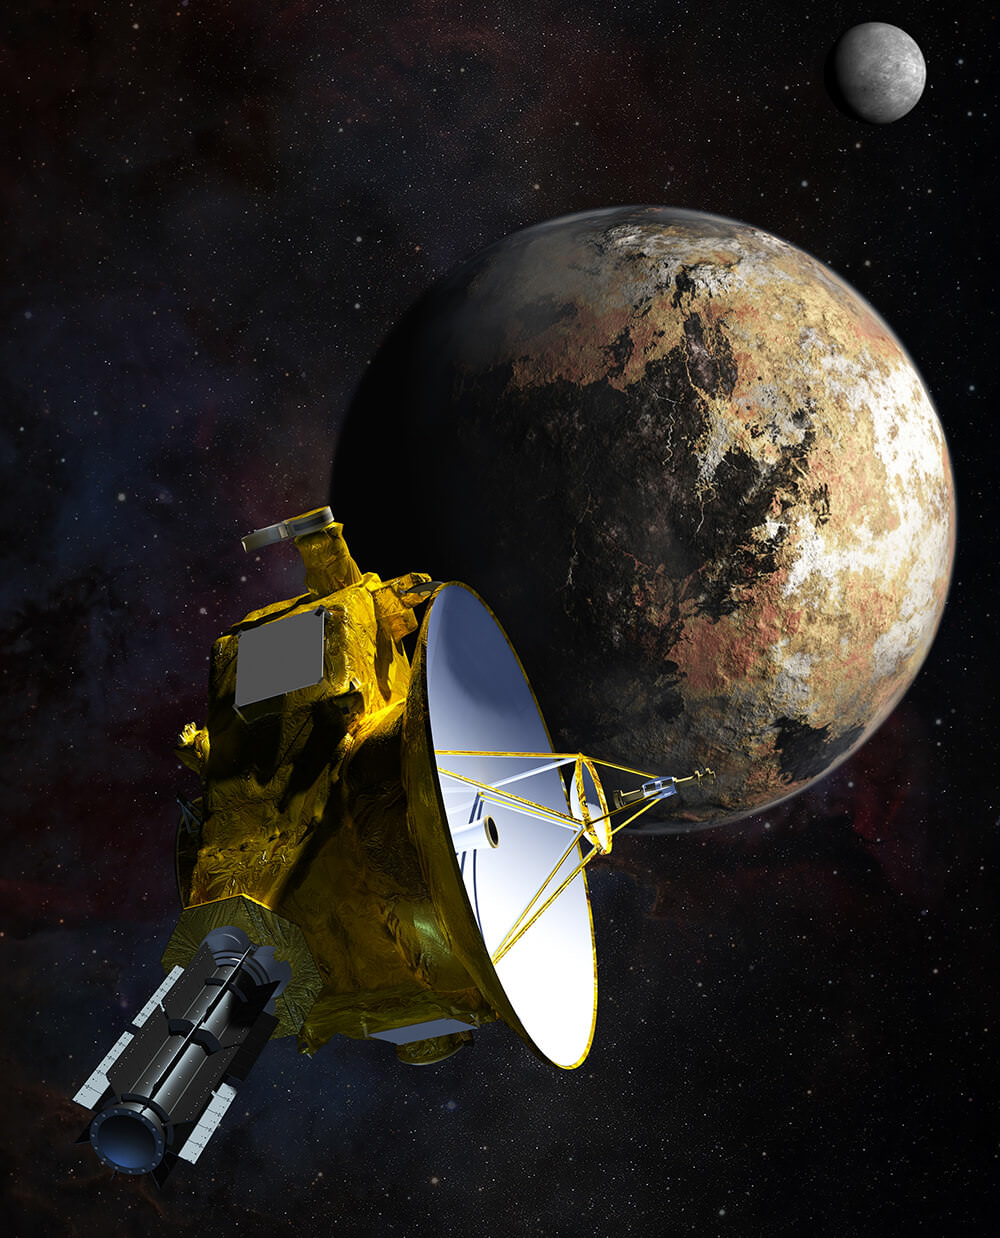
Artist’s impression of New Horizons’ close encounter with the Pluto–Charon system. Credit: NASA/JHU APL/SwRI/Steve Gribben
Ever since the NH probe conducted its flyby of Pluto in 2015, astronomers have been aware that Pluto has an atmosphere which changes size and density with the seasons. Basically, as the planet reaches perihelion during its 248 year orbital period – a distance of 4,436,820,000 km, 2,756,912,133 mi from the Sun – the atmosphere thickens due to the sublimation of frozen nitrogen and methane on the surface.
The last time Pluto was at perihelion was on September 5th, 1989, which means that it was still experiencing summer when NH made its flyby. While studying Pluto, the probe detected an atmosphere that was primarily composed of nitrogen gas (N²) along with methane (CH4) and carbon dioxide (CO²). Astronomers therefore decided to look for signs of x-ray emissions coming from Pluto’s atmosphere using the Chandra X-ray Observatory.
Prior to the NH mission’s flyby, most models of Pluto’s atmosphere expected it to be quite extended. However, the probe found that the atmosphere was less extended and that its rate of loss was hundreds of times lower than what these models predicted. Therefore, as the team indicated in their study, they expected to find x-ray emissions that were consistent with what the NH flyby observed:
“Given that most pre-encounter models of Pluto’s atmosphere had predicted it to be much more extended, with an estimated loss rate to space of ~1027 to 1028 mol/sec of N² and CH4… we attempted to detect X-ray emission created by [solar wind] neutral gas charge exchange interactions in the low density neutral gas surrounding Pluto,” they wrote.
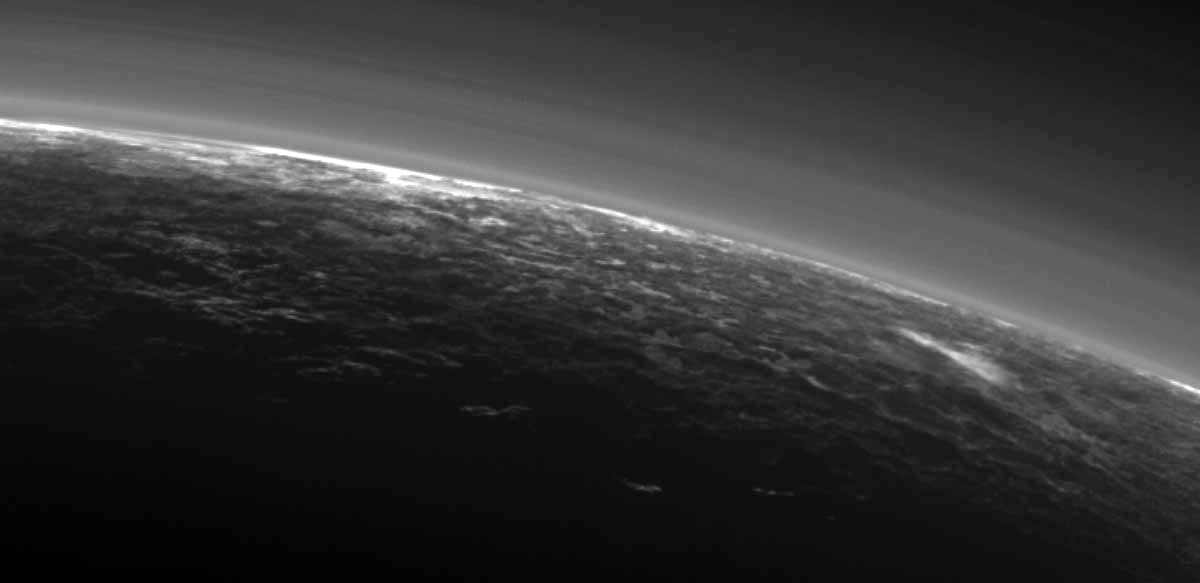
Images sent by NASA’s New Horizons spacecraft show possible clouds floating over the frozen landscape including the streaky patch at right. Credit: NASA/JHUAPL/SwR
However, after consulting data from the Advanced CCD Imaging Spectrometer (ACIS) aboard Chandra, they found that x-ray emissions coming from Pluto were greater than what this would allow for. In some cases, strong x-ray emissions have been noted coming from other smaller objects in the Solar System, which is due to the scattering of solar x-rays by small dust grains composed of carbon, nitrogen and oxygen.
But the energy distribution they noted with Pluto’s x-rays were not consistent with this explanation. Another possibility that the team offered is that they could be due to some process (or processes) that focus the solar wind near Pluto, which would enhance the effect of its modest atmosphere. As they indicate in their conclusions:
“The observed emission from Pluto is not aurorally driven. If due to scattering, it would have to be sourced by a unique population of nanoscale haze grains composed of C, N, and O atoms in Pluto’s atmosphere resonantly fluorescing under the Sun’s insolation. If driven by charge exchange between [solar wind] minor ions and neutral gas species (mainly CH4) escaping from Pluto, then density enhancement and adjustment of the [solar wind] minor ion relative abundance in the interaction region near Pluto is required versus naïve models.”
For the time being, the true cause of these x-ray emissions is likely to remain a mystery. They also highlight the need for more research when it comes to this distant and most massive of Kuiper Belt Objects. Luckily, the data provided by the NH mission is likely to be poured over for decades, revealing new and interesting things about Pluto, the outer Solar System, and how the most distant worlds from our Sun behave.