Ceres Provides First Detection Of Life’s Building Blocks In Asteroid Belt

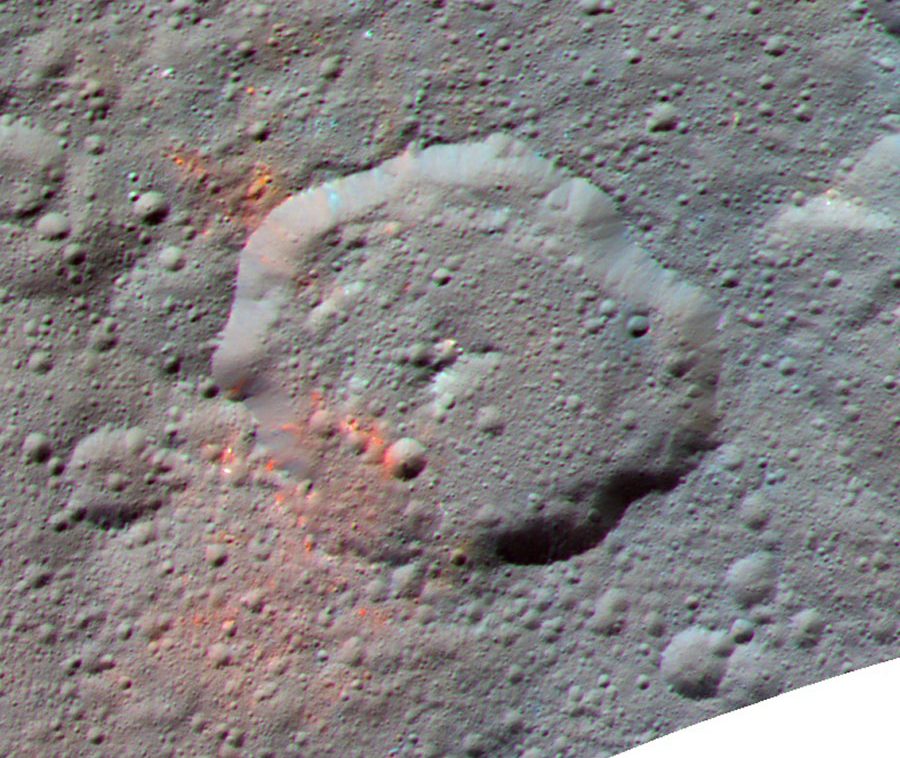
Enhanced color-composite image, made with data from the framing camera aboard NASA's Dawn spacecraft, shows the area around Ernutet crater. Credit: NASA/JPL-Caltech/UCLA/MPS/DLR/IDA

NASA’s Dawn spacecraft has been poking around Ceres since it first established orbit in March of 2015. In that time, the mission has sent back a steam of images of the minor planet, and with a level of resolution that was previously impossible. Because of this, a lot of interesting revelations have been made about Ceres’ composition and surface features (like its many “bright spots“).

In what is sure to be the most surprising find yet, the Dawn spacecraft has revealed that Ceres may actually possess the ingredients for life. Using data from the Dawn spacecraft’s Visible and InfraRed Mapping Spectrometer (VIMS), an international team of scientists has confirmed the existence of organic molecules on Ceres – a find which could indicate that it has conditions favorable to life.

These findings – which were detailed in a study titled Localized aliphatic organic material on the surface of Ceres” – appeared in the Feb. 17th, 2017, issue of Science. For the sake of their study, the international team of researchers – which was led by Maria Cristina de Sanctis from the National Institute of Astrophysics in Rome, Italy – showed how Dawn sensor data pointed towards the presence of aliphatic compounds on the surface.
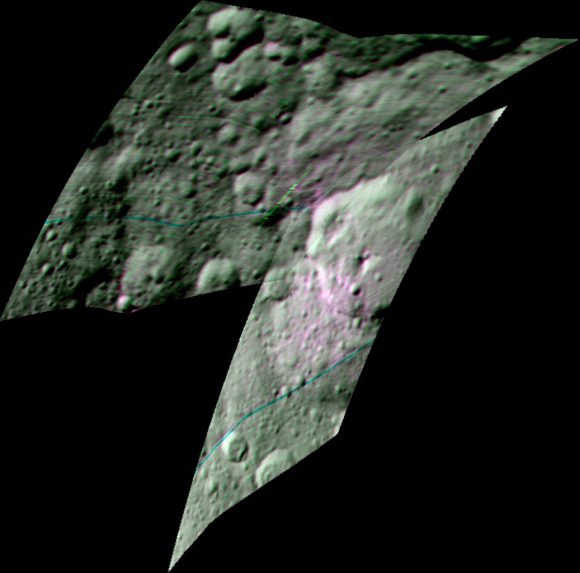
Enhanced color-composite image from Dawn’s visible and infrared mapping spectrometer, showing the area around Ernutet Crater on Ceres. Credit: NASA/JPL-Caltech/UCLA/ASI/INAF

Aliphatics are a type of organic compound where carbon atoms form open chains that are commonly bound with oxygen, nitrogen, sulfur and chlorine. The least complex aliphatic is methane, which has been detected in many locations across the Solar System – including in the Martian atmosphere and in both liquid and gaseous form on Saturn’s moon Titan.

From their study, Dr. de Sanctis and her colleagues determined that spectral data obtained by the VIMS instrument corresponded to the presence of these hydrocarbons in a region outside of the Ernutet crater. This crater, which is located in the northern hemisphere of Ceres, measures about 52 km (32 mi) in diameter. The aliphatic compounds which were detected were localized in a roughly 1000 square kilometers region around it.

The team ruled out the possibility that these organic molecules were deposited from an external source – such as a comet or carbonaceous chondrite asteroid. While both have been shown to contain organic molecules in their interior in the past, the largest concentrations on Ceres were distributed discontinuously across the southwest floor and rim of the Ernutet crater and onto an older, highly degraded crater.

In addition, other organic-rich areas were spotted being are scattered to the northwest of the crater. As Dr.  Maria Cristina De Sanctis told Universe Today via email:

“The composition that we see on Ceres is similar to some meteorites that has organics and thus we searched for this material. We considered both endogenous and exogenous origin, but the last one seems less likely due to several reasons including the larger abundance observed on Ceres with respect the meteorites.”
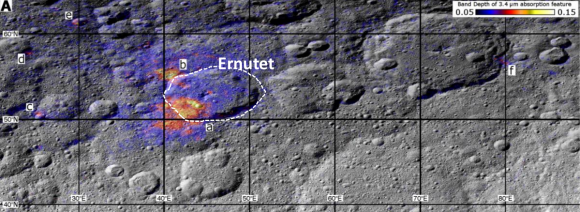
Dawn spacecraft data, showing the organics absorption band (warmer colors indicate highest concentrations). Credit: NASA/JPL-Caltech/UCLA/ASI/INAF/MPS/DLR/IDA

Instead, they considered the possibility that they organic molecules were endogenous in origin. In the past, surveys have shown evidence of hydrothermal activity on Ceres, which included signs of surface renewal and fluid mobility. Combined with other surveys that have detected ammonia-bearing hydrated minerals, water ice, carbonates, and salts, this all points towards Ceres having an environment that can support prebiotic chemistry.

“The overall composition of Ceres can favor the pre-biotic chemistry,” said De Sanctis. “Ceres has water ice and minerals (carbonates and phyllosilicates) derived  from pervasive aqueous  alteration of rocks. It has also material that we think is formed in hydrothermal environments.  All these information indicate condition not hostel to biotic molecules.”

These findings are certainly significant in helping to determine if life could exist on Ceres – in a way that is similar to Europa and Enceladus, locked away beneath its icy mantle. But given that Ceres is believed to have originated 4.5 billion years ago (when the Solar System was still in the process of formation), this study is also significant in that it can shed light on the origin, evolution, and distribution of organic life in our the Solar System.

Other members of the research team include researchers from the department of Earth Planetary and Space Sciences at the University of California, the Department of Earth and Planetary Sciences at the University of Tennessee, the Department of Earth, Environmental, and Planetary Sciences at Brown University, the Southwest Research Institute (SwRI), the NASA Goddard Space Flight Center, and NASA’s Jet Propulsion Laboratory.

Further Reading: ScienceMag, SwRI

What is the Weather like on Saturn?

The Saturn hexagon as seen by Voyager 1 in 1980 (NASA)

Welcome back to our planetary weather series! Next up, we take a look at the ringed-beauty, Saturn!

Saturn is famous for many things. Aside from its ring system, which are the most visible and beautiful of any gas giant, it is also known for its extensive system of moons (the second largest in the Solar System behind Jupiter). And then there its banded appearance and gold color, which are the result of its peculiar composition and persistent weather patterns.

Much like Jupiter, Saturn’s weather systems are known for being particularly extreme, giving rise to features that can be seen from great distances. It’s high winds periodically create massive oval-shaped storms, jet streams, hurricanes, and hexagonal wave patterns that are visible in both the northern and southern polar regions.

Saturn’s Atmosphere:

The outer atmosphere of Saturn contains 96.3% molecular hydrogen and 3.25% helium by volume. The gas giant is also known to contain heavier elements, though the proportions of these relative to hydrogen and helium is not known. It is assumed that they would match the primordial abundance from the formation of the Solar System.

The huge storm churning through the atmosphere in Saturn’s northern hemisphere overtakes itself as it encircles the planet in this true-color view from NASA’s Cassini spacecraft. Credit: NASA/JPL-Caltech/SSI

Trace amounts of ammonia, acetylene, ethane, propane, phosphine and methane have been also detected in Saturn’s atmosphere. The upper clouds are composed of ammonia crystals, while the lower level clouds appear to consist of either ammonium hydrosulfide (NH4SH) or water. Ultraviolet radiation from the Sun causes methane photolysis in the upper atmosphere, leading to a series of hydrocarbon chemical reactions with the resulting products being carried downward by eddies and diffusion.

Saturn’s atmosphere exhibits a banded pattern similar to Jupiter’s, but Saturn’s bands are much fainter and wider near the equator. As with Jupiter’s cloud layers, they are divided into the upper and lower layers, which vary in composition based on depth and pressure. In the upper cloud layers, with temperatures in range of 100–160 K and pressures between 0.5–2 bar, the clouds consist of ammonia ice.

The presence of hydrogen gas results in clouds of deep red. However, these are obscured by clouds of ammonia, which are closer to the outer edge of the atmosphere and cover the entire planet. The exposure of this ammonia to the Sun’s ultraviolet radiation causes it to appear white. Combined with its deeper red clouds, this results in the planet having a pale gold color.

Water ice clouds begin at a level where the pressure is about 2.5 bar and extend down to 9.5 bar, where temperatures range from 185–270 K. Intermixed in this layer is a band of ammonium hydrosulfide ice, lying in the pressure range 3–6 bar with temperatures of 290–235 K. Finally, the lower layers, where pressures are between 10–20 bar and temperatures are 270–330 K, contains a region of water droplets with ammonia in an aqueous solution.

Great White Spot:

On occasion, Saturn’s atmosphere exhibits long-lived ovals, similar to what is commonly observed on Jupiter. Whereas Jupiter has the Great Red Spot, Saturn periodically has what’s known as the Great White Spot (aka. Great White Oval). This unique but short-lived phenomenon occurs once every Saturnian year, roughly every 30 Earth years, around the time of the northern hemisphere’s summer solstice.

These spots can be several thousands of kilometers wide, and have been observed in 1876, 1903, 1933, 1960, and 1990. Since 2010, a large band of white clouds called the Northern Electrostatic Disturbance have been observed enveloping Saturn, which was spotted by the Cassini space probe. If the periodic nature of these storms is maintained, another one will occur in about 2020.

Meteorological Phenomena:

The winds on Saturn are the second fastest among the Solar System’s planets, after Neptune’s. This is due in part to Saturn’s high rotational velocity – which is 9.87 km/s (6.13 mi/s), which works out to 35,500 km/h (22,058.7 mi/h). At this rate, it only takes the planet 10 hours 33 minutes to rotate once on its axis. However, due to it being a gas giant, there is a difference between the rotation of its atmosphere and its core.

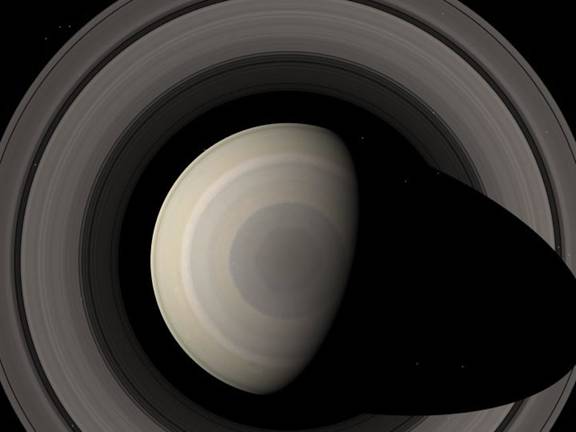
Data obtained by the Voyager 1 and 2 missions indicated peak easterly winds of 500 m/s (1800 km/h). Saturn’s northern and southern poles have also shown evidence of stormy weather. At the north pole, this takes the form of a hexagonal wave pattern, whereas the south shows evidence of a massive jet stream.

Saturn makes a beautifully striped ornament in this natural-color image, showing its north polar hexagon and central vortex. Credit: NASA/JPL-Caltech/Space Science Institute

The persisting hexagonal wave pattern around the north pole was first noted in the Voyager images. The sides of the hexagon are each about 13,800 km (8,600 mi) long (which is longer than the diameter of the Earth) and the structure rotates with a period of 10h 39m 24s, which is assumed to be equal to the period of rotation of Saturn’s interior.

The south pole vortex, meanwhile, was first observed using the Hubble Space Telescope. These images indicated the presence of a jet stream, but not a hexagonal standing wave. These storms are estimated to be generating winds of 550 km/h, are comparable in size to Earth, and believed to have been going on for billions of years.

In 2006, the Cassini space probe observed a hurricane-like storm that had a clearly defined eye. Such storms had not been observed on any planet other than Earth – even on Jupiter. This storm appeared to be caused by heat that was generated in the depths of the warm interior of Saturn, which then escaped to the upper atmosphere and escaped the planet.

Saturn has also been noted for its “string of pearls” feature, which was captured by Cassini’s visual and infrared mapping spectrometer in 2006. This feature, which appeared in it’s northern latitudes (and has not been seen on any other gas giant) is a series of cloud clearings spaced at regular intervals that show how Saturn’s atmosphere is lit by its own internal, thermal glow.

So how is the weather on Saturn? Pretty violent and stormy! And not surprising given the planet’s mass, composition, powerful gravity, and rapid rotation. Makes you feel happy we live on Earth, where the Earth is (comparatively speaking) pretty calm and boring!

We have written many interesting articles about planetary weather here at Universe Today. Here’s What’s the Weather Like on Mercury?, What’s the Weather Like on Venus?, What’s the Weather Like on Mars?, What’s the Weather Like on Jupiter?, What is the Weather Like on Uranus? and What is the Weather Like on Neptune?

For more information, check out NASA’s Solar System Exploration – Saturn, and the facts about Saturn from Space Facts.

Astronomy Cast has recorded some interesting episode on the subject. Here’s Episode 59: Saturn, and Episode 61: Saturn’s Moons.

Sources:

Video of Green Comet 45P Puts You Close To The Action

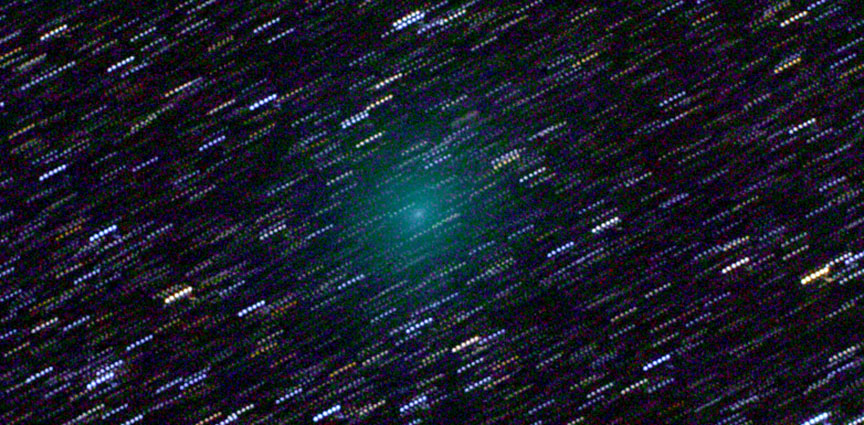
Comet 45P is seen here on Feb. 8, 2017. The comet appears very spread out and diffuse. While its overall brightness is about magnitude +8.5, the comet appears diffuse and faint. Credit: Chris Schur
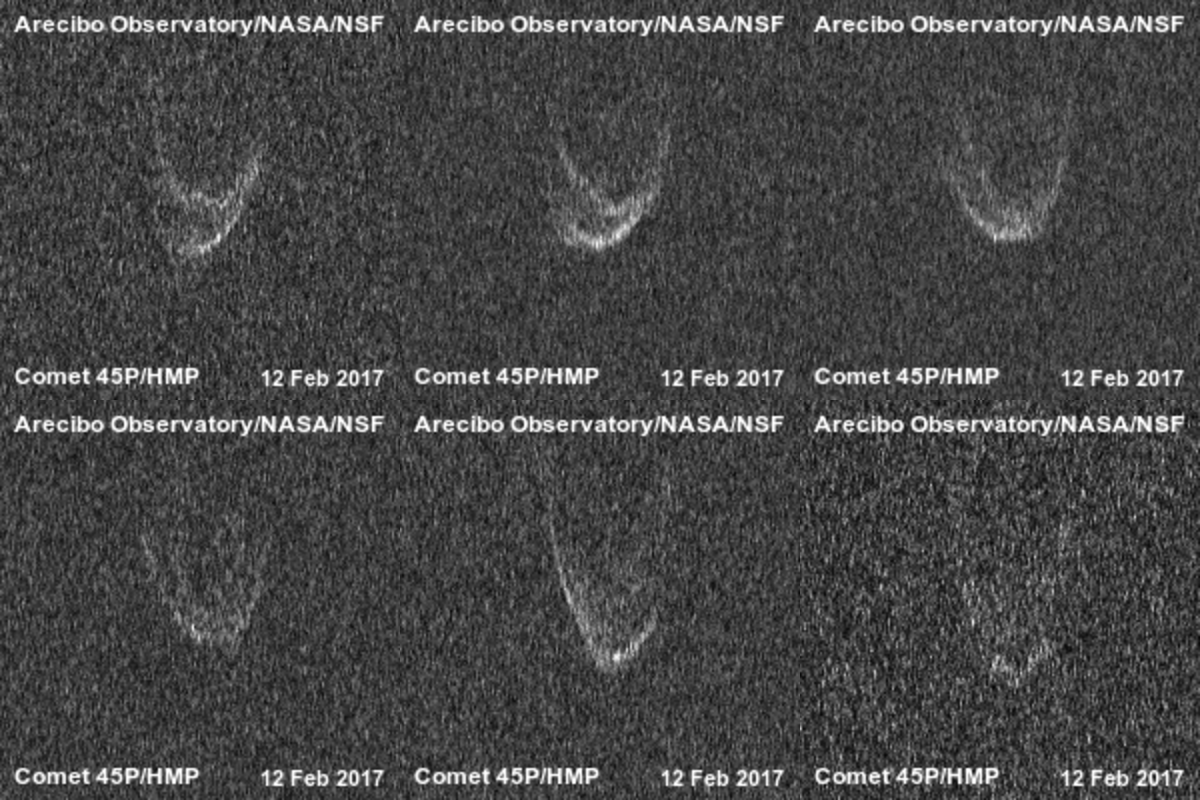
This animation of comet 45P/H-M-P is composed of thirteen delay-Doppler images made during 2 hours of observation using the Arecibo Observatory on Feb. 12. Credit: USRA

Comets hide their central engines well. From Earth, we see a bright, fuzzy coma and a tail or two. But the nucleus, the source of all the hubbub, remains deeply camouflaged by dust, at best appearing like a blurry star.

To see one up close, you need to send a spacecraft right into the comet’s coma and risk getting. Or you can do the job much more cheaply by bouncing radio waves off the nucleus and studying the returning echoes to create a shadowy image.

Although crude compared to optical photos of moons and planets, radar images reveal much about an asteroid including surface details like mountains, craters, shape and rotation rate. They’re also far superior to what optical telescopes can resolve when it comes to asteroids, which, as their name implies, appear star-like or nearly so in even large professional telescopes.

On Feb. 11, green-glowing comet 45P/Honda-Mrkos-Pajdusakova, made an unusually close pass of Earth, zipping just 7.7 million miles away. Astronomers made the most of the encounter by pressing the huge 1,000-foot-wide (305 meters) Arecibo radio dish into service to image the comet’s nucleus during and after closest approach.

Arecibo Observatory, the world’s biggest single dish radio telescope, was and is still being used to image comet 45P/H-M-P. Courtesy of the NAIC – Arecibo Observatory, a facility of the NSF

“The Arecibo Observatory planetary radar system can pierce through the comet’s coma and allows us to study the surface properties, size, shape, rotation, and geology of the comet nucleus”, said Dr. Patrick Taylor, USRA Scientist and Group Lead for Planetary Radar at Arecibo.

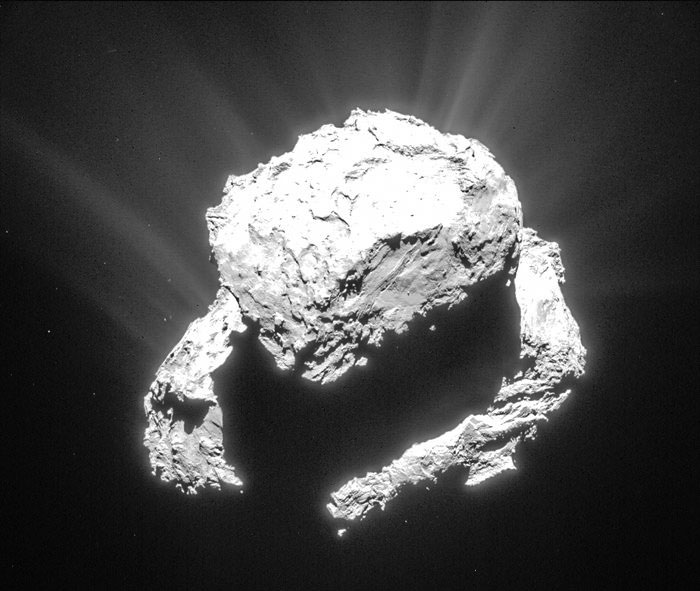
The two lobes of comet 67P/C-G stand out clearly in this photo taken by ESA’s Rosetta spacecraft while in orbit about the comet on March 6, 2015. Credit: ESA/Rosetta

Does the shape ring a bell? Remember Rubber Ducky? It doesn’t take a rocket scientist to see that the comet’s heart resembles the twin-lobed comet 67P/Churyumov-Gerasimenko orbited by ESA’s Rosetta spacecraft. Using the dish, astronomers have seen bright regions and structures on the comet; they also discovered that the nucleus is a little larger than expected with a diameter of 0.8 mile (1.3 km) and rotates about once every 7.6 hours. Go to bed at 10 and wake up at 6 and the comet will have made one complete turn.

Comet 45P is seen here on Feb. 8, 2017. While its overall brightness is about magnitude +8.5, the comet appears diffuse and rather faint. From dark skies, it remains a binocular object at least for a little while. Credit: Chris Schur

Radio observations of 45P/H-M-P will continue through Feb. 17. Right now, the comet is happily back in the evening sky and still visible with 10×50 or larger binoculars around 10-11 p.m. local time in the east. I spotted it low in Bootes last night about 15 minutes before moonrise under excellent, dark sky conditions. It looked like a faint, smoky ball nearly as big as the full moon or about 30 arc minutes across.

This week, the pale green blob (the green’s from fluorescing carbon), vaults upward from Bootes, crosses Canes Venatici and zooms into Coma Berenices. For maps to help you track and find it night by night, please click here. I suggest larger binoculars 50mm and up or a 6-inch or larger telescope. Be sure to use low power — the comet’s so big, you need a wide field of view to get dark sky around it in order to see it more clearly.

Very few comets pass near Earth compared to the number of asteroids that routinely do. That’s one reason 45P is only the seventh imaged using radar; rarely are we treated to such detailed views!

India Sets Record With 104 Satellites In Single Launch

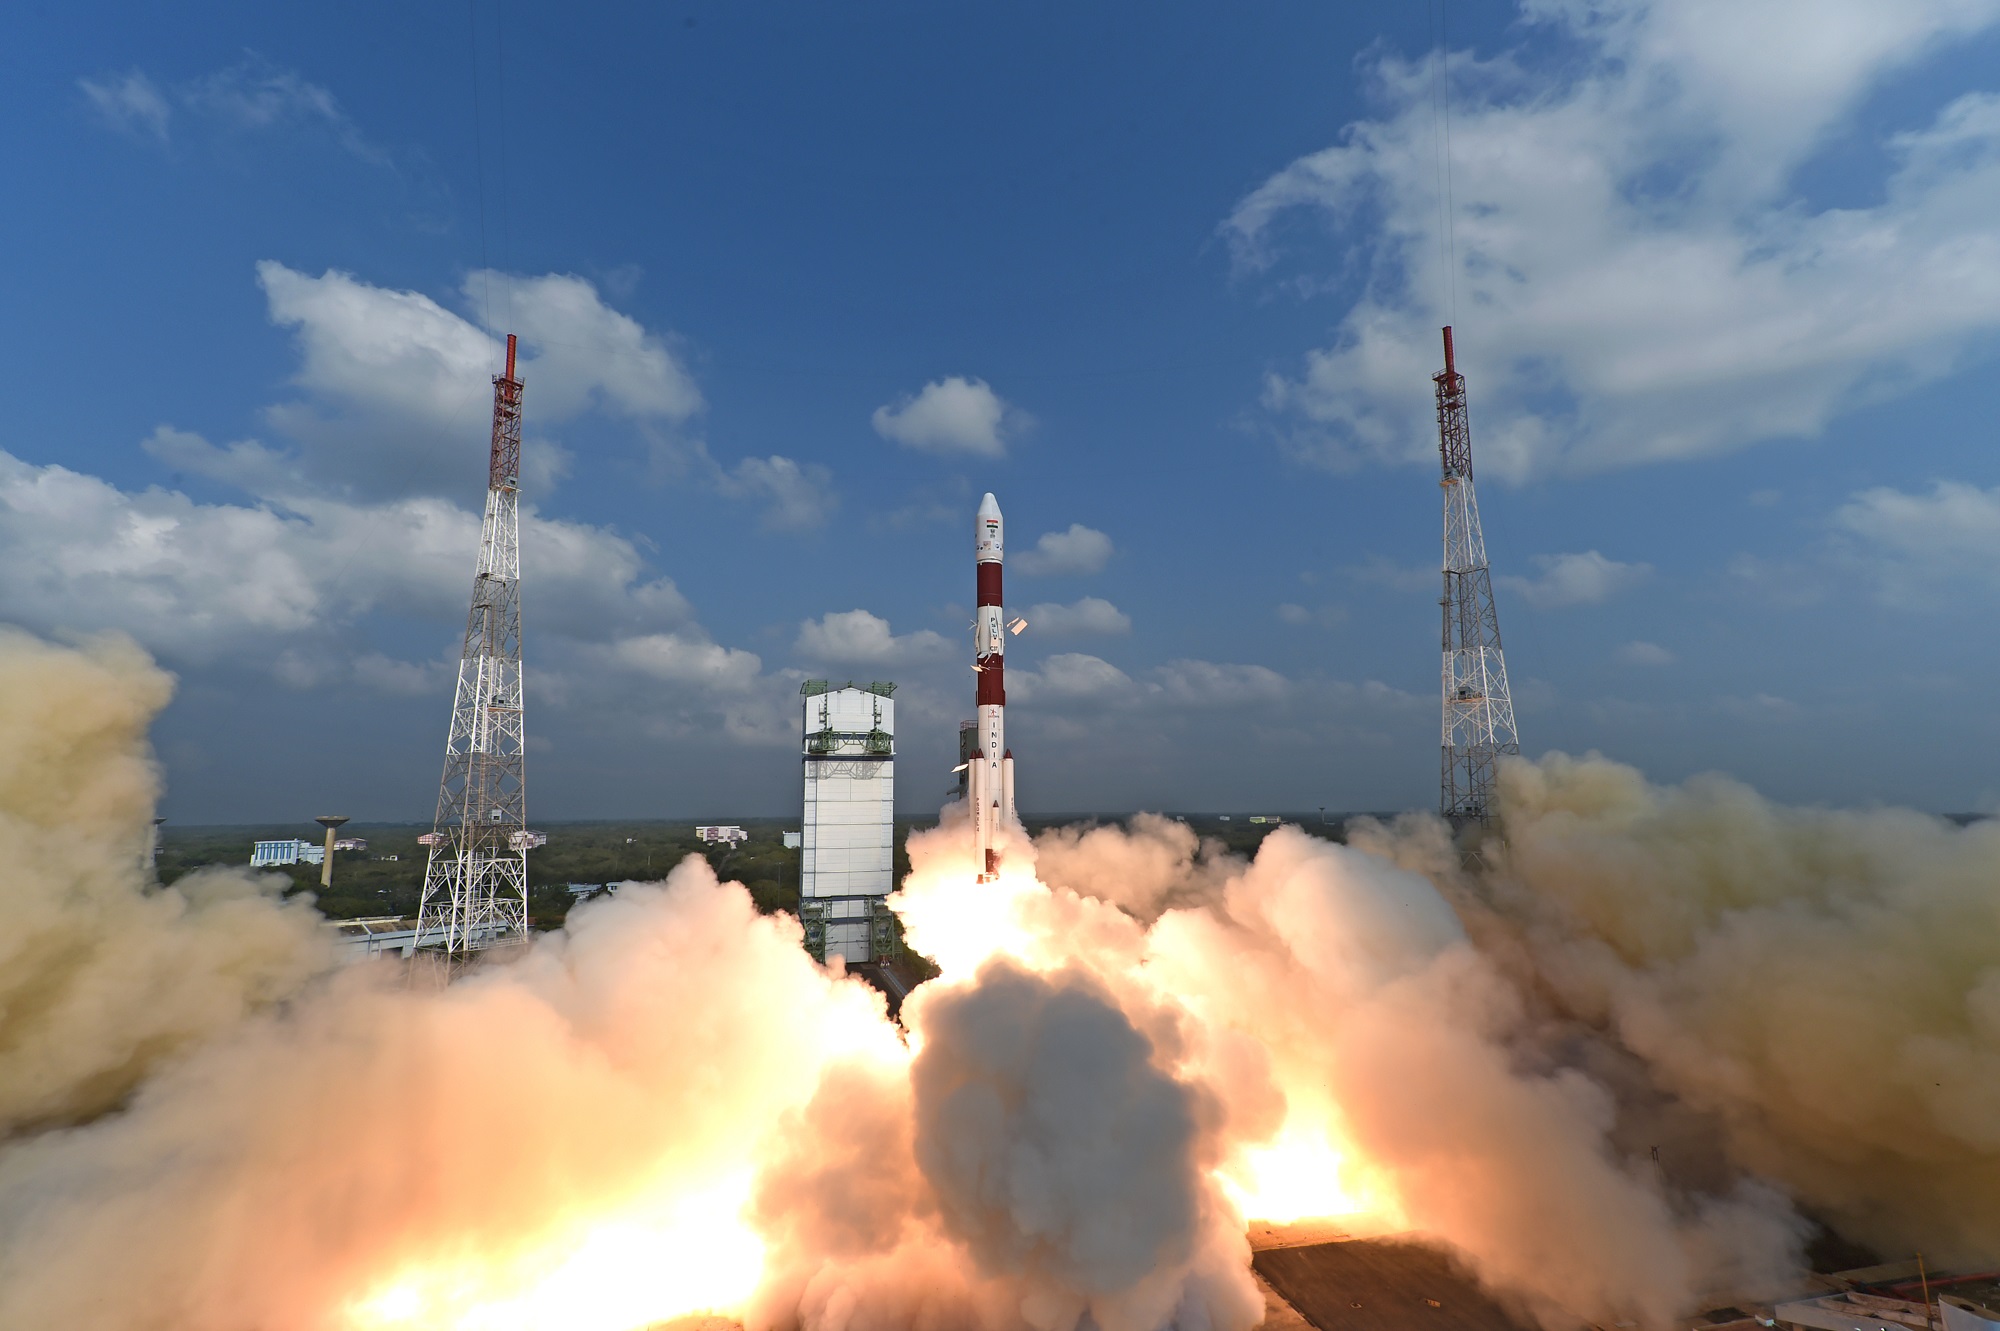
The thirty-ninth flight of the ISRO's Polar Satellite Launch Vehicle (PSLV-C37), which successfully from Satish Dhawan Space Centre SHAR, Sriharikota on February 15th, 2017. Credit: ISRO

India’s national space agency – the Indian Space Research Organization (ISRO) – has come a long way in recent years. In 2008, the agency launched its first lunar explorer, Chandrayaan-1, which also deployed a lander (the Moon Impact Probe) to the surface. And then there was the Mangalayaan mission – aka. the Mars Orbiter Mission (MOM) – which made history on Sept. 24th, 2014, when it became the first probe to enter orbit around Mars on the first try.

In their latest feat, the ISRO established a new record for the number of satellites launched in a single mission. In what was the thirty-ninth launch of the Polar Satellite Launch Vehicle (PSLV), the organization deployed 104 satellites into orbit. In so doing, they have effectively overtaken the previous record of 37 – which was established by Roscosmos in June of 2014.

This launch was also the thirty eighth successful mission in a row for the PSLV. which has been in service since the early 1990s. Prior to this flight, the rocket had successfully launched a total of 71 satellites and spacecraft – 31 of which were Indian – into a variety of orbits. The most satellites it launched at one time was 20, which took place on June 22nd, 2016, with the launch of the PSLV-C34 mission.

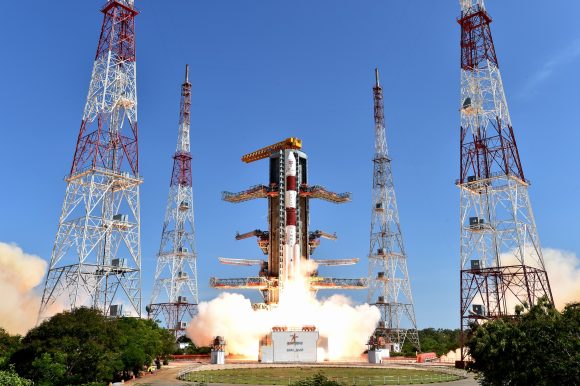
The thirty-sixth launch of the ISROs India’s Polar Satellite Launch Vehicle (PSLV-C34), in June 2016. Credit: ISRO

Hence, it has not only beaten its own record this single launch (and by a factor of five, no less), but more than doubled the total amount of satellites it has deployed. This mission also pushed the total number of Indian-made satellites sent into space aboard the PSLV rocket to 46, and the number of customer satellites that India has launched to 180.

As the ISRO reported shortly after the launch:

“PSLV-C37 lifted off at 0928 hrs (9:28 am) IST, as planned, from the First Launch Pad. After a flight of  16 minutes 48 seconds, the satellites achieved a polar Sun Synchronous Orbit of 506 km inclined at an angle of 97.46 degree to the equator (very close to the intended orbit) and in the succeeding 12 minutes, all the 104 satellites successfully separated from the PSLV fourth stage in a predetermined sequence beginning with Cartosat-2 series satellite, followed by INS-1 and INS-2.”

Shortly after the launch, Prime Minister Narendra Modi, took to Twitter to congratulate the scientists and laud the space agency for its record-breaking accomplishment. “This remarkable feat by @isro is yet another proud moment for our space scientific community and the nation. India salutes our scientists,” he tweeted. “Congratulations to @isro for the successful launch of PSLV-C37 and CARTOSAT satellite together with 103 nano satellites!”

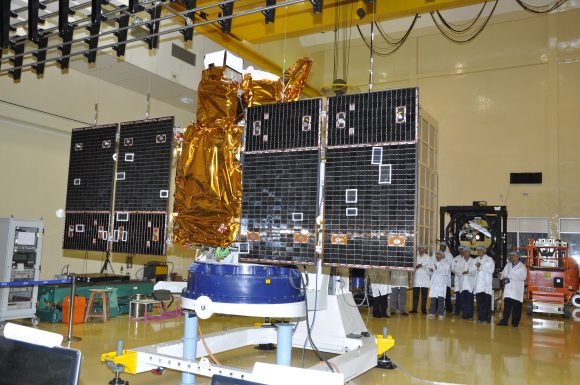
A Cartosat-2 Series Satellite undergoing a panel deployment test at ISAC Bengaluru. Credit: ISRO

The cargo consisted of a Cartosat-2 Series Satellite, which is the latest in a series of ISRO Earth-observation satellites. In the coming days, the satellite will position itself and begin to provide remote sensing services using its state-of-the-art panchromatic (PAN) camera – which takes black and white pictures of the Earth in the visible and EM spectrum – and its multi-spectral (color) cameras.

In addition, two technology demonstration satellites from India were deployed – the Nano Satellite-1 (INS-1) and INS-2. The remaining 101 co-passenger satellites were all the property of the ISRO’s international customers – with 96 coming from the US, and five coming from the Netherlands, Switzerland, Israel, Kazakhstan and the United Arab Emirates, respectively.

In addition to demonstrating the capability of India’s launch workhorse, this latest mission also shows the growing importance countries like India play in the modern space age. In the coming years, the ISRO hopes to commence its proposed human spaceflight program, which if successful will make it the fourth nation to conduct crewed missions to space (alongside NASA, Roscosmos, and China).

And be sure to check out the video below for footage of the PSLV-C37 mission’s liftoff and on-board camera video:

Further Reading: ISRO

The Orbit of Mercury. How Long is a Year on Mercury?

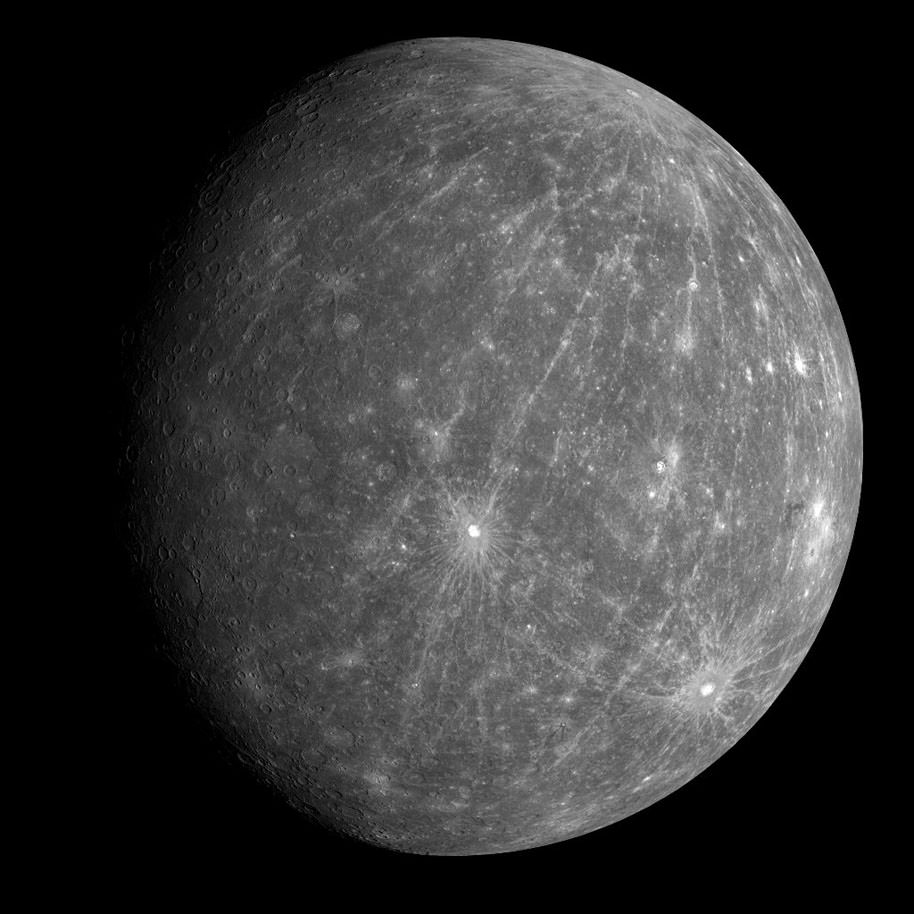
A global view of Mercury, as seen by MESSENGER. Credit: NASA

Mercury is a planet of extremes. As the closest planet to our Sun, it experiences extremely high surface temperatures. But since it has virtually no atmosphere to speak of, and rotates very slowly on its axis, it gravitates between extremes of hot and cold. It also means that it’s Sun-facing side experiences prolonged periods of day while its dark side experiences extremely long periods of night.

It’s proximity to the Sun also means that it orbits the planet quite rapidly. To break it down, Mercury takes roughly 88 Earth days to complete a single orbit around the Sun. Between this rapid orbital period and its slow rotational period, a single year on Mercury is actually shorter than a single day!

Orbital Period:

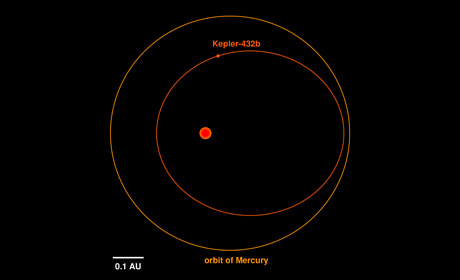
Mercury orbits the Sun at a distance of 57,909,050 km (35,983,015 mi), which works out to o.387 AU – or slightly more than one-third the distance between the Sun and the Earth. It’s orbit is also highly eccentric, ranging from a distance of 46 million km/28.58 million mi at its closest (perihelion) to 70 million km/43.49 million mi at its most distant (aphelion).

Illustration of the orbit of Kepler-432b (inner, red) in comparison to the orbit of Mercury around the Sun (outer, orange). Credit: Dr. Sabine Reffert.

Like all the planets, Mercury moves fastest when it is at its closest point to the Sun, and slowest when it is at its farthest. However, it’s proximity to the Sun means that its average orbital velocity is a speedy 47.362 kilometers a second or 29.429 miles per second –  approximately 170,500 km/h; 105,945 mph.

At this rate, it takes Mercury 87.969 days, or the equivalent of 0.24 Earth years, to complete a single orbit of the Sun. Thus, it can be said that a year on Mercury lasts almost as long as 3 months here on Earth.

Sidereal and Solar Day:

Astronomers used to think that Mercury was tidally locked to the Sun, where its rotational period matched its orbital period. This would mean that the same side it always pointed towards the Sun, thus ensuring that one side was perennially sunny (and extremely hot) while the other experienced constant night (and freezing cold).

However, improved observations and studies of the planet have led scientists to conclude that in fact, the planet has a slow rotational period of 58.646 days. Compared to its orbital period of 88 days, this means that Mercury has a spin-orbit resonance of 3:2, which means that the planet makes three completes rotations on its axis for every two orbits it makes around the Sun.

Another consequences of its spin-orbit resonance is that there is a significance difference between the time it takes the planet to rotate once on its axis (a sidereal day) and the time it takes for the Sun to reappear in the same place in the sky (a solar day). On Mercury, it takes a 176 days for the Sun to rise, set, and return to the same place in the sky. This means, effectively, that a single day on Mercury lasts as long as two years!

Yes, Mercury is a pretty extreme place. Not only do temperatures on its surface range from molten hot to freezing cold, but a single day lasts as long as six months here on Earth. Add to that the fact that it has virtually no atmosphere, and is exposed to extreme amounts of radiation, and you can begin to understand why life cannot exist there.

At least… not yet!

We have written many interesting articles about Mercury here at Universe Today. Here’s How Long is a Day on Mercury?, How Long is a Year on the Other Planets?, Which Planet has the Longest Day?, How Long is a Year on Venus?, How Long is a Year on Earth?, How Long is a Year on Mars?, How Long is a Year on Jupiter?, How Long is a Year on Saturn?, How Long is a Year on Uranus?, How Long is a Year on Neptune?, and How Long is a Year on Pluto?

If you’d like more info on Mercury, check out NASA’s Solar System Exploration Guide, and here’s a link to NASA’s MESSENGER Misson Page.

We’ve also recorded an entire episode of Astronomy Cast all about Mercury. Listen here, Episode 49: Mercury.

Sources:

Chance Discovery Of A Three Hour Old Supernova

Artistic impression of a star going supernova, casting its chemically enriched contents into the universe. Credit: NASA/Swift/Skyworks Digital/Dana Berry

Supernovae are extremely energetic and dynamic events in the universe. The brightest one we’ve ever observed was discovered in 2015 and was as bright as 570 billion Suns. Their luminosity signifies their significance in the cosmos. They produce the heavy elements that make up people and planets, and their shockwaves trigger the formation of the next generation of stars.

There are about 3 supernovae every 100 hundred years in the Milky Way galaxy. Throughout human history, only a handful of supernovae have been observed. The earliest recorded supernova was observed by Chinese astronomers in 185 AD. The most famous supernova is probably SN 1054 (historic supernovae are named for the year they were observed) which created the Crab Nebula. Now, thanks to all of our telescopes and observatories, observing supernovae is fairly routine.

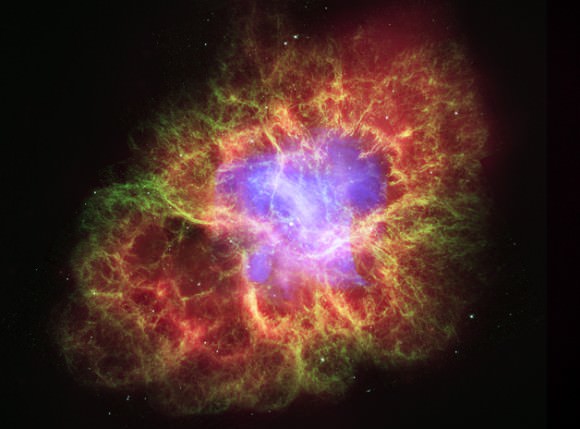
The supernova that produced the Crab Nebula was detected by naked-eye observers around the world in 1054 A.D. This composite image uses data from NASA’s Great Observatories, Chandra, Hubble, and Spitzer, to show that a superdense neutron star is energizing the expanding Nebula by spewing out magnetic fields and a blizzard of extremely high-energy particles. The Chandra X-ray image is shown in light blue, the Hubble Space Telescope optical images are in green and dark blue, and the Spitzer Space Telescope’s infrared image is in red. The size of the X-ray image is smaller than the others because ultrahigh-energy X-ray emitting electrons radiate away their energy more quickly than the lower-energy electrons emitting optical and infrared light. The neutron star is the bright white dot in the center of the image.
The supernova that produced the Crab Nebula was detected by naked-eye observers around the world in 1054 A.D. This composite image uses data from NASA’s Great Observatories, Chandra, Hubble, and Spitzer.

But one thing astronomers have never observed is the very early stages of a supernova. That changed in 2013 when, by chance, the automated Intermediate Palomar Transient Factory (IPTF) caught sight of a supernova only 3 hours old.

Spotting a supernovae in its first few hours is extremely important, because we can quickly point other ‘scopes at it and gather data about the SN’s progenitor star. In this case, according to a paper published at Nature Physics, follow-up observations revealed a surprise: SN 2013fs was surrounded by circumstellar material (CSM) that it ejected in the year prior to the supernova event. The CSM was ejected at a high rate of approximately 10 -³ solar masses per year. According to the paper, this kind of instability might be common among supernovae.

SN 2013fs was a red super-giant. Astronomers didn’t think that those types of stars ejected material prior to going supernova. But follow up observations with other telescopes showed the supernova explosion moving through a cloud of material previously ejected by a star. What this means for our understanding of supernovae isn’t clear yet, but it’s probably a game changer.

Catching the 3-hour-old SN 2013fs was an extremely lucky event. The IPTF is a fully-automated wide-field survey of the sky. It’s a system of 11 CCD’s installed on a telescope at the Palomar Observatory in California. It takes 60 second exposures at frequencies from 5 days apart to 90 seconds apart. This is what allowed it to capture SN 2013fs in its early stages.

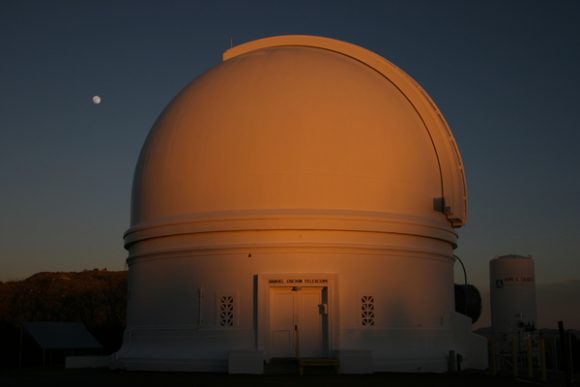
The 48 inch telescope at the Palomar Observatory. The IPTF is installed on this telescope. Image: IPTF/Palomar Observatory

Our understanding of supernovae is a mixture of theory and observed data. We know a lot about how they collapse, why they collapse, and what types of supernovae there are. But this is our first data point of a SN in its early hours.

SN 2013fs is 160 million light years away in a spiral-arm galaxy called NGC7610. It’s a type II supernova, meaning that it’s at least 8 times as massive as our Sun, but not more than 50 times as massive. Type II supernovae are mostly observed in the spiral arms of galaxies.

A supernova is the end state of some of the stars in the universe. But not all stars. Only massive stars can become supernova. Our own Sun is much too small.

Stars are like dynamic balancing acts between two forces: fusion and gravity.

As hydrogen is fused into helium in the center of a star, it causes enormous outward pressure in the form of photons. That is what lights and warms our planet. But stars are, of course, enormously massive. And all that mass is subject to gravity, which pulls the star’s mass inward. So the fusion and the gravity more or less balance each other out. This is called stellar equilibrium, which is the state our Sun is in, and will be in for several billion more years.

But stars don’t last forever, or rather, their hydrogen doesn’t. And once the hydrogen runs out, the star begins to change. In the case of a massive star, it begins to fuse heavier and heavier elements, until it fuses iron and nickel in its core. The fusion of iron and nickel is a natural fusion limit in a star, and once it reaches the iron and nickel fusion stage, fusion stops. We now have a star with an inert core of iron and nickel.

Now that fusion has stopped, stellar equilibrium is broken, and the enormous gravitational pressure of the star’s mass causes a collapse. This rapid collapse causes the core to heat again, which halts the collapse and causes a massive outwards shockwave. The shockwave hits the outer stellar material and blasts it out into space. Voila, a supernova.

The extremely high temperatures of the shockwave have one more important effect. It heats the stellar material outside the core, though very briefly, which allows the fusion of elements heavier than iron. This explains why the extremely heavy elements like uranium are much rarer than lighter elements. Only large enough stars that go supernova can forge the heaviest elements.

In a nutshell, that is a type II supernova, the same type found in 2013 when it was only 3 hours old. How the discovery of the CSM ejected by SN 2013fs will grow our understanding of supernovae is not fully understood.

Supernovae are fairly well-understood events, but their are still many questions surrounding them. Whether these new observations of the very earliest stages of a supernovae will answer some of our questions, or just create more unanswered questions, remains to be seen.

Distance & Speed Of Sun’s Orbit Around Galactic Centre Measured

Artist’s conception of the Gaia telescope backdropped by a photograph of the Milky Way taken at the European Southern Observatory. Credit: ESA/ATG medialab; background: ESO/S. Brunier

In 2013, the European Space Agency deployed the long-awaited Gaia space observatory. As one of a handful of next-generation space observatories that will be going up before the end of the decade, this mission has spent the past few years cataloging over a billion astronomical objects. Using this data, astronomers and astrophysicists hope to create the largest and most precise 3D map of the Milky Way to date.

Though it is almost to the end of its mission, much of its earliest information is still bearing fruit. For example, using the mission’s initial data release, a team of astrophysicists from the University of Toronto managed to calculate the speed at which the Sun orbits the Milky Way. From this, they were able to obtain a precise distance estimate between our Sun and the center of the galaxy for the first time.

For some time, astronomers have been unsure as to exactly how far our Solar System is from the center of our galaxy. Much of this has to do with the fact that it is impossible to view it directly, due to a combination of factors (i.e. perspective, the size of our galaxy, and visibility barriers). As a result, since the year 2000, official estimates have varied between 7.2 and 8.8 kiloparsecs (~23,483 to 28,700 light years).

Astronomy Image Gallery
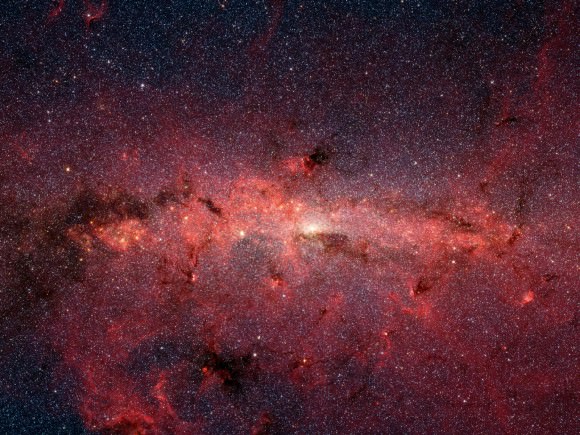
Infrared image from Spitzer Space Telescope, showing the stars at the center of the Milky Way Galaxy. Credit: NASA/JPL-Caltech/S. Stolovy (SSC/Caltech)

For the sake of their study, the team – which was led by Jason Hunt, a Dunlap Fellow at the Dunlap Institute for Astronomy & Astrophysics at the University of Toronto – combined Gaia’s initial release with data from the RAdial Velocity Experiment (RAVE). This survey, which was conducted between 2003 and 2013 by the Australian Astronomical Observatory (AAO), measured the positions, distances, radial velocities and spectra of 500,000 stars.

Over 200,000 of these stars were also observed by Gaia and information on them was included in its initial data release. As they explain in their study, which was published in the Journal of Astrophysical Letters in November 2016, they used this to examined the speeds at which these stars orbit the center of the galaxy (relative to the Sun), and in the process discovered that there was an apparent distribution in their relative velocities.

In short, our Sun moves around the center of the Milky Way at a speed of 240 km/s (149 mi/s), or 864,000 km/h (536,865 mph). Naturally, some of the more than 200,000 candidates were moving faster or slower. But for some, there was no apparent angular momentum, which they attributed to these stars being scattering onto “chaotic, halo-type orbits when they pass through the Galactic nucleus”.

As Hunt explained in Dunlap Institute press release:

“Stars with very close to zero angular momentum would have plunged towards the Galactic center where they would be strongly affected by the extreme gravitational forces present there. This would scatter them into chaotic orbits taking them far above the Galactic plane and away from the Solar neighbourhood… By measuring the velocity with which nearby stars rotate around our Galaxy with respect to the Sun, we can observe a lack of stars with a specific negative relative velocity. And because we know this dip corresponds to 0 km/sec, it tells us, in turn, how fast we are moving.”

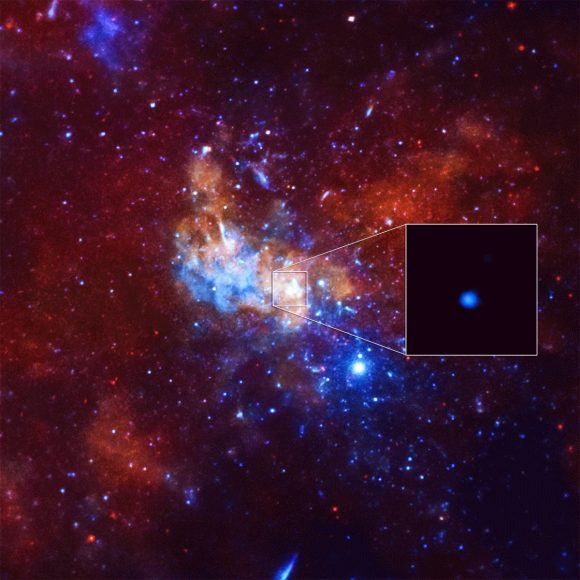
Detection of an unusually bright X-Ray flare from Sagittarius A*, a supermassive black hole in the center of the Milky Way galaxy. Credit: NASA/CXC/Stanford/I. Zhuravleva et al.

The next step was to combine this information with proper motion calculations of Sagittarius A* – the supermassive black hole believed to be at the center of our galaxy. After correcting for its motion relative to background objects, they were able to effectively triangulate the Earth’s distance from the center of the galaxy. From this, they derived a refined distance of estimate of 7.6 to 8.2 kpc – which works out to about 24,788 to 26,745 light years.

This study builds upon previous work conducted by the study’s co-authors – Prof. Ray Calberg, the current chair of the Department of Astronomy & Astrophysics at the University of Toronto. Years ago, he and Prof. Kimmo Innanen of the Department of Physics and Astronomy at York University conducted a similar study using radial velocity measurement from 400 of the Milky Way’s stars.

But by incorporating data from the Gaia observatory, the UofT team was able to obtain a much more comprehensive data set and narrow the distance to galactic center by a significant amount. And this was based on only the initial data released by the Gaia mission. Looking ahead, Hunt anticipates that further data releases will allow his team and other astronomers to refine their calculations even more.

“Gaia’s final release in late 2017 should enable us to increase the precision of our measurement of the Sun’s velocity to within approximately one km/sec,” he said, “which in turn will significantly increase the accuracy of our measurement of our distance from the Galactic center.”

As more next-generation space telescopes and observatories are deployed, we can expect them to provide us with a wealth of new information about our Universe. And from this, we can expect that astronomers and astrophysicists will begin to shine the light on a number of unresolved cosmological questions.

Further Reading: University of Toronto, The Astrophysical Journal Letters

Through The Nuclear Looking Glass: The Moon & The Bomb

continents
An impact between a Mars-sized protoplanet and early Earth is the most widely-accepted origin of the Moon. Did smaller impacts seed the formation of continents? (NASA/JPL-Caltech)

For centuries, scientists have been attempting to explain how the Moon formed. Whereas some have argued that it formed from material lost by Earth due to centrifugal force, others asserted that a preformed Moon was captured by Earth’s gravity. In recent decades, the most widely-accepted theory has been the Giant-impact hypothesis, which states that the Moon formed after the Earth was struck by a Mars-sized object (named Theia) 4.5 billion years ago.

According to a new study by an international team of researchers, the key to proving which theory is correct may come from the first nuclear tests conducted here on Earth, some 70 years ago. After examining samples of radioactive glass obtained from the Trinity test site in New Mexico (where the first atomic bomb was detonated), they determined that samples of Moon rocks showed a similar depletion of volatile elements.

Continue reading “Through The Nuclear Looking Glass: The Moon & The Bomb”

Meet Asteroid 2017 BQ6 — A Giant, Spinning Brick

Credit: NASA/JPL-Caltech/GSSR


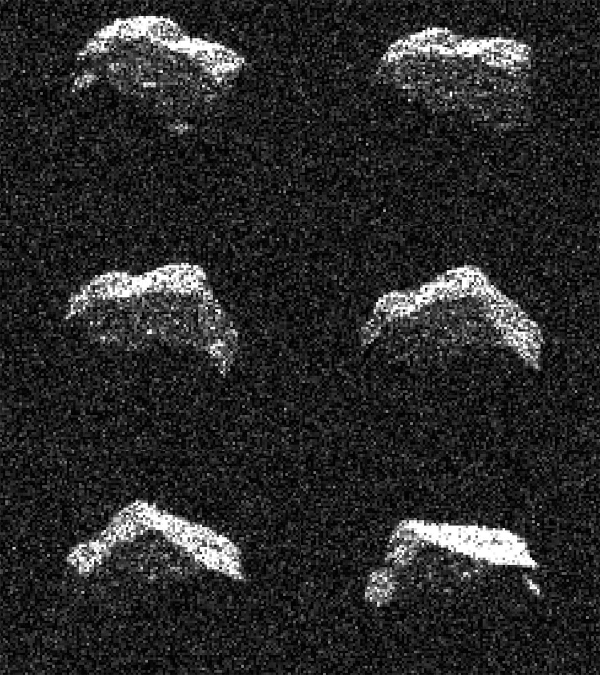
This composite of 25 images of asteroid 2017 BQ6 was generated with radar data collected using NASA’s Goldstone Solar System Radar in California’s Mojave Desert. It sped by Earth on Feb. 7 at a speed of around  25,560 mph (7.1 km/s) relative to the planet. The images have resolutions as fine as 12 feet (3.75 meters) per pixel. Credit: NASA/JPL-Caltech/GSSR

To radar imager Lance Benner at JPL in Pasadena, asteroid 2017 BQ6 resembles the polygonal dice used in Dungeons and Dragons. But my eyes see something closer to a stepping stone or paver you’d use to build a walkway. However you picture it, this asteroid is more angular than most imaged by radar.

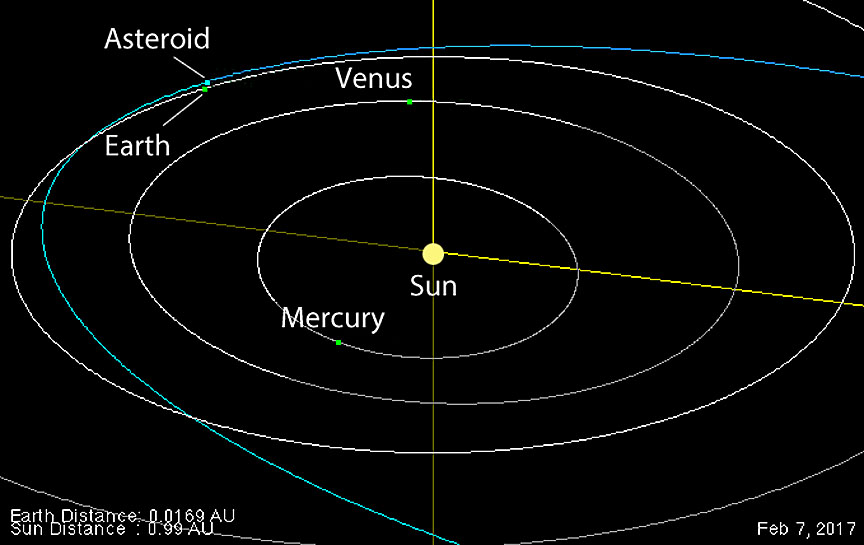
It flew harmlessly by Earth on Feb. 7 at 1:36 a.m. EST (6:36 UT) at about 6.6 times the distance between Earth and the moon or some about 1.6 million miles. Based on 2017 BQ6’s brightness, astronomers estimate the hurtling boulder about 660 feet (200 meters) across. The recent flyby made for a perfect opportunity to bounce radio waves off the object, harvest their echoes and build an image of giant space boulder no one had ever seen close up before.

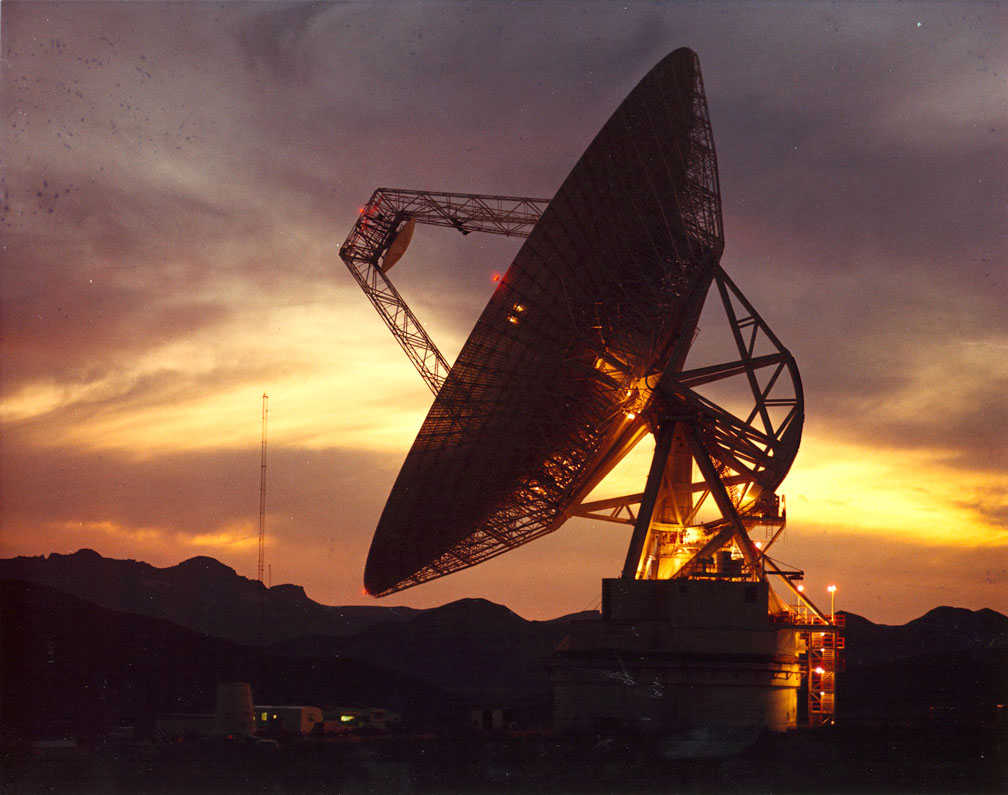
NASA’s 70-meter antennas are the largest and most sensitive Deep Sky Network antennas, capable of tracking a spacecraft traveling tens of billions of miles from Earth. This one at Goldstone not only tracked Voyager 2’s Neptune encounter, it also received Neil Armstrong’s famous communication from Apollo 11: “That’s one small step for a man. One giant leap for mankind.” Credit: JPL-Caltech/GSSR

The images of the asteroid were obtained on Feb. 6 and 7 with NASA’s 230-foot (70-meter) antenna at the Goldstone Deep Space Communications Complex in California and reveal an irregular, angular-appearing asteroid:

Animation of 2017 BQ6. The near-Earth asteroid has a rotation period of about 3 hours. Credit: NASA/JPL-Caltech/GSSR

“The radar images show relatively sharp corners, flat regions, concavities, and small bright spots that may be boulders,” said Lance Benner of NASA’s Jet Propulsion Laboratory in Pasadena, California, who leads the agency’s asteroid radar research program. “Asteroid 2017 BQ6 reminds me of the dice used when playing Dungeons and Dragons.”

2017 BQ6 was discovered on Jan. 26 by the NASA-funded Lincoln Near Earth Asteroid Research (LINEAR) Project, operated by MIT Lincoln Laboratory on the Air Force Space Command’s Space Surveillance Telescope at White Sands Missile Range, New Mexico.

Radar has been used to observe hundreds of asteroids. Even through very large telescopes, 2017 BQ6 would have appeared exactly like a star, but the radar technique reveals shape, size, rotation, roughness and even surface features.

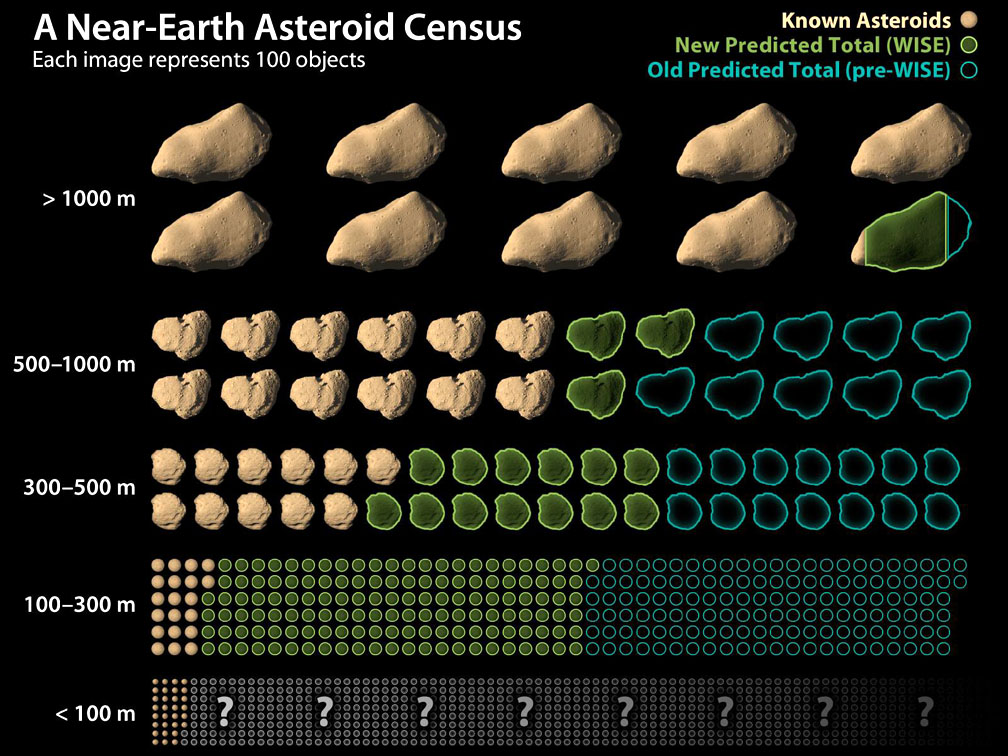
This chart shows how data from NASA’s Wide-field Infrared Survey Explorer, or WISE, has led to revisions in the estimated population of near-Earth asteroids. Credit: NASA/JPL-Caltech

To create the images, Benner conducted a controlled experiment on the asteroid, transmitting a signal with well-known characteristics to the object and then, by comparing the echo to the transmission, deduced its properties. According to NASA’s Asteroid Radar Research site, measuring how the echo power spreads out over time along with changes in its frequency caused by the Doppler Effect (object approaching or receding from Earth), provide the data to construct two-dimensional images with resolutions finer than 33 feet (10 meters) if the echoes are strong enough.

This orbital diagram shows the close approach of 2017 BQ6 to Earth on Feb. 7, 2017. Credit: NASA/JPL Horizons

In late October 2016, the number of known near-Earth asteroids topped 15,000 with new discoveries averaging about 30 a week. A near-Earth asteroid is defined as a rocky body that approaches within approximately 1.3 times Earth’s average distance to the Sun. This distance then brings the asteroid within roughly 30 million miles (50 million km) of Earth’s orbit. To date, astronomers have already discovered more than 90% of the estimated number of the large near-Earth objects  or those larger than 0.6 miles (1 km). It’s estimated that more than a million NEAs smaller than 330 feet (100 meters) lurk in the void. Time to get crackin’.

91 Astronomers Combine 1000 Images Into One Amazing Journey to Jupiter

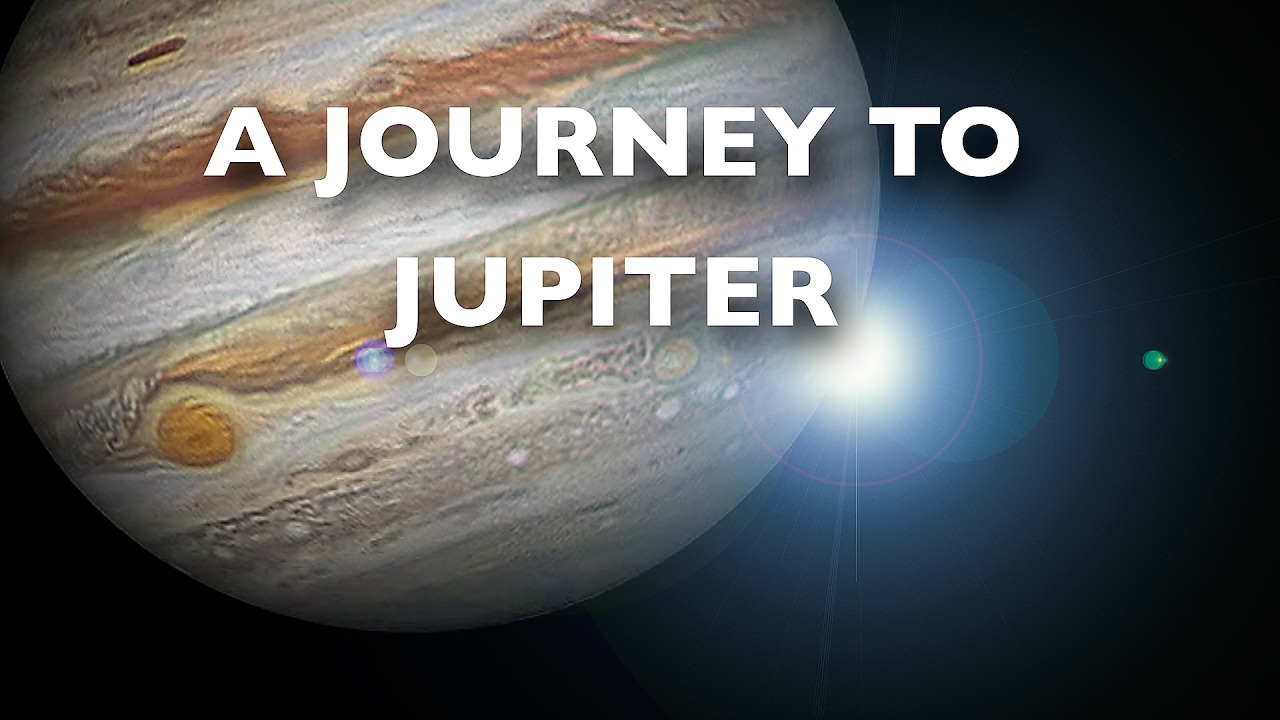
Using 1,000 images taken by 91 amateurs from around the world, Peter Rosen has created a high-resolution film of Jupiter's dynamic atmosphere. Credit: Peter Rosén et al. via YouTube

A renewed era of space exploration is underway. Compared to the Space Race of the 20th century, which was characterized by two superpowers locked in a game of “getting there first”, the new era is defined predominantly by cooperation and open participation. One way in which this is evident is the role played by “citizen scientists” and amateur astronomers in exploration missions.

Consider the recently-released short film titled “A Journey to Jupiter” by Peter Rosen – a photographer and digital artist in Stockholm, Sweden. Using over 1000 images taken by amateur planetary photographers from around the world, this film takes viewers on a virtual journey to the Jovian planet, showcasing its weather patterns and dynamic nature in a way that is truly inspiring.

The images that went into making this video were collected by over 91 amateur astronomers over the course of three and a half months (between December 19th, 2014 and March 31st, 2015). After Rosen collected them, he and his associates (Christoffer Svenske and Johan Warell) then spent a year remapping them into cylindrical projections. Rosen then added color corrections, and stitched all the images into a total of 107 maps.

Much like fast-motion videos that illustrate weather patterns on Earth, or the passage of the stars across the night sky, the end result of was a film that shows the motions of Jupiter’s cloud belts and its Great Red Spot in high-resolution. Some 250 revolutions of the planet are illustrated, including from the equatorial band, the south pole, and the north pole.

As Rosen told Universe Today via email, this project was the latest in a lifelong pursuit of making astronomy accessible to the public:

“I have been into Astronomy since I was a teenager in the early 1970’s and immediately I got a passion for astrophotography, and more specifically, photographing the planets. I see astronomy as a life-long passion, so it is quite normal to strive for an evolution in what you do. I had an idea growing slowly for some years that it should be possible to animate the cloud belts of Jupiter and reveal the intricate dynamics of its flows, not just taking still pictures that might point to the changes in the structures but without the obvious visual dynamics of an animation.”

A Journey to Jupiter” was also Rosen’s contribution to the Mission Juno Pro-Amateur Collaboration Project, of which he is part. Established by Glenn Orton of NASA’s Jet Propulsion Laboratory, this effort is one of several that seeks to connect amateurs and professionals in support of space exploration. Back in May of 2016, this group met in Nice, France, for a workshop dedicated to projects and techniques related to Jupiter observations.

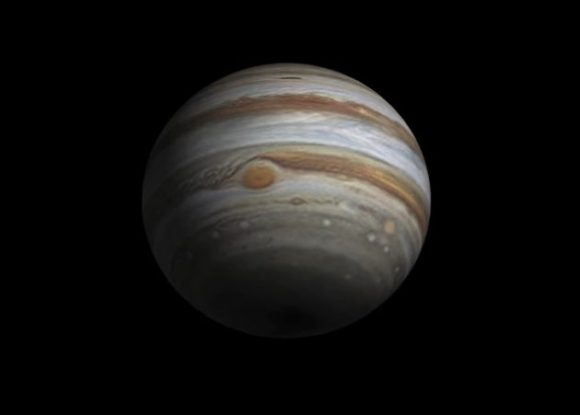
Still-pic from Rosen’s “A Journey to Jupiter” video. Credit: Peter Rosen et al via Youtube.

Among other items discussed was the limitations that missions like Juno have to deal with. While it is capable of taking very-high resolution images of Jupiter, these images are highly specific in nature. And before a team of mission scientists are able to color-correct them and stitch them together to create panoramas, etc., they are not always what you might call “visually stunning”.

However, Earth-based observatories are not hampered by this restriction, and can take multiple images of a planet over time that capture it as a whole. And thanks to the availability of sophisticated telescopes and imaging software, amateur astronomers are capable of making important contributions in this regard. And far from these being strictly for scientific purposes, there is also the added benefit of public engagement.

“This has been a very technical and scientifically correct project,” said Rosen, “but as a photographer and digital artist I also wanted to create a work of art that would inspire and appeal to people who are fascinated by the universe but who are not necessarily into astronomy.”

Of course, this does not detract from the scientific value that this film has. For example, it showcases the turbulent nature of Jupiter’s atmosphere in a way that is scientifically accurate. Hence why Ricardo Hueso Alonso – a physicist at the University of Basque Country and a member of the Planetary Virtual Observatory and Laboratory (PVOL) – plans to use the maps to measure Jupiter’s wind speeds at different latitudes.

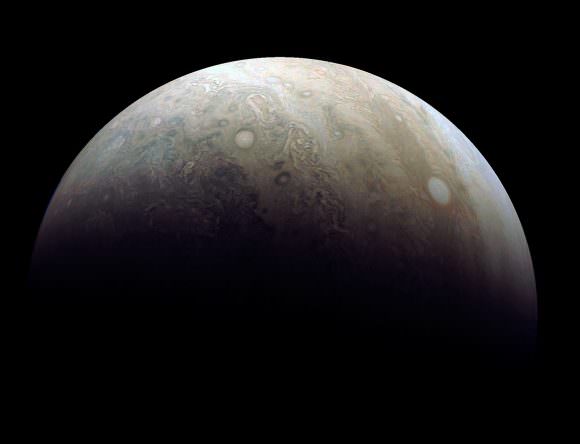
Reprocessed image taken by the JunoCam during its 3rd close flyby of the planet on Dec. 11. The photo highlights two large ‘pearls’ or storms in Jupiter’s atmosphere. Credit: NASA/JPL-Caltech/SwRI/MSSS

On top of its artistic and scientific merit, “A Journey to Jupiter” also serves as a testament to the skill and capability of the today’s amateur astronomers and planetary photographers. And of course, it draws attention to the efforts of space missions such as Juno, which is currently skimming the clouds of Jupiter to obtain the most comprehensive information about the planet’s atmosphere and magnetic field to date.

Not surprisingly, this is not the first film by Rosen that combines scientific accuracy and fast-motion visuals. The short film Voyager 3, released back in June of 2014, was an homage by Rosen and six other Swedish amateur astronomers to the Voyager 1 mission. As the probe made its 28-day final approach to Jupiter in 1979, it snapped what were the most detailed images of Jupiter at the time.

These images helped to improve our understanding of the gas giant, its atmosphere, and its moons. Among other things, hey revealed the turbulent nature of Jupiter’s atmosphere, and that the Great Red Spot had changed color since the Pioneer 10 and 11 missions had flown by in 1973 and 74. Produced 35 years later, Voyager 3 was an attempt to recreate this historic event using images taken by Swedish amateur astronomers using their own ground-based telescopes.

Over the course of 90 days, Rosen and his colleagues captured one million frames of Jupiter, which resulted in 560 still images of the planet. These were then stitched together using a series of software programs (Winjupos, Photoshop CS6, Fantamorph, and StarryNightPro+) to create a simulation that gives the impression of a probe approaching the planet – i.e. like a third Voyager mission, hence the name of the film.

“As Jupiter was ideally positioned high in the sky in 2013-2014 for us living far up in the northern hemisphere, I decided that it was the right moment to give it a try, so I contacted 6 other amateurs on our local forum that shared my passion for the planets,” Rosen said. “We photographed Jupiter as often as we could during a 3-month period and I took care of the processing of the images which took me a total of 6 months.”

It is an exciting time to be alive. Not only are a greater number of national space agencies taking part in the exploration of the Solar System; but more than ever, citizen scientists, amateurs and members of the general public are able to participate in a way that was never before possible.

To view more work by Peter Rosen, be sure to check out his page at Vimeo.

Further Reading: NASA