Since the election of Donald Trump, NASA has had its share of concerns about the future. Given the President-elect’s position and past statements on climate science, there has been speculation that his presidency will curtail funding to some of their research efforts, particularly those that are maintained by the Earth Science Directorate.
Things took another turn on Monday (Dec. 5th) as Trump met with former Vice President and environmental activist Al Gore to discuss his administration’s policy. This meeting was the latest in a series of gestures that suggest that the President-elect might be softening his stances on the environment. However, there is little reason to suspect that this meeting could mean any changes in policy.
The meeting was apparently arranged by the President-elect’s daughter, Ivanka Trump, to coincide with the former VP’s attendance of a conference in New York on Monday. Said conference was the 24 hour live broadcast titled “24 Hours of Reality”, an event being put on by the Climate Reality Project – a non-profit organization founded by Gore to educate the public on climate change and policy.
The meeting lasted 90 minutes, after which Gore spoke to reporters about the discussion he and the President-elect had. As he was quoted as saying by The Washington Post:
“I had a lengthy and very productive session with the president-elect. It was a sincere search for areas of common ground. I had a meeting beforehand with Ivanka Trump. The bulk of the time was with the president-elect, Donald Trump. I found it an extremely interesting conversation, and to be continued, and I’m just going to leave it at that.”
While this meeting has led to speculation that Trump’s administration might be softening its stance on environmental issues, many are unconvinced. Based on past statements – which include how Climate Change is a “hoax invented by the Chinese” – to his more recent picks for his cabinet, there are those who continue to express concern for the future of NASA programs that are centered on Earth sciences and the environment.
For instance, after weeks of remaining mute on the subject of NASA’s future, the Trump campaign announced that it had appointed Bob Walker – a former Pennsylvania Congressman and the chair of the House Science Committee from 1995 to 1997. A fierce conservative, Walker was recently quoted as saying that NASA should cease its climate research and focus solely on space exploration.
“My guess is that it would be difficult to stop all ongoing Nasa programs but future programs should definitely be placed with other agencies,” he said in an interview with the Guardian in late November. “I believe that climate research is necessary but it has been heavily politicized, which has undermined a lot of the work that researchers have been doing. Mr Trump’s decisions will be based upon solid science, not politicized science.”
From statements such as these, plus things said during the campaign that emphasized NASA’s important role in space exploration, the general consensus has been that a Trump administration will likely slash funding to NASA’s Earth Science Directorate while leaving long-term exploration programs unaffected. According to David Titley, who recently wrote an op-ed piece for The Conversation, this would be a terrible mistake.
Titley is a Professor of Meteorology at Pennsylvania State University and the founding director of their Center for Solutions to Weather and Climate Risk. In addition to being a Rear Admiral in the US Navy (retired), he was also the Chief Operating Officer of the National Oceanic and Atmospheric Administration from 2012–2013 and has been a Fellow of the American Meteorological Society since 2009.
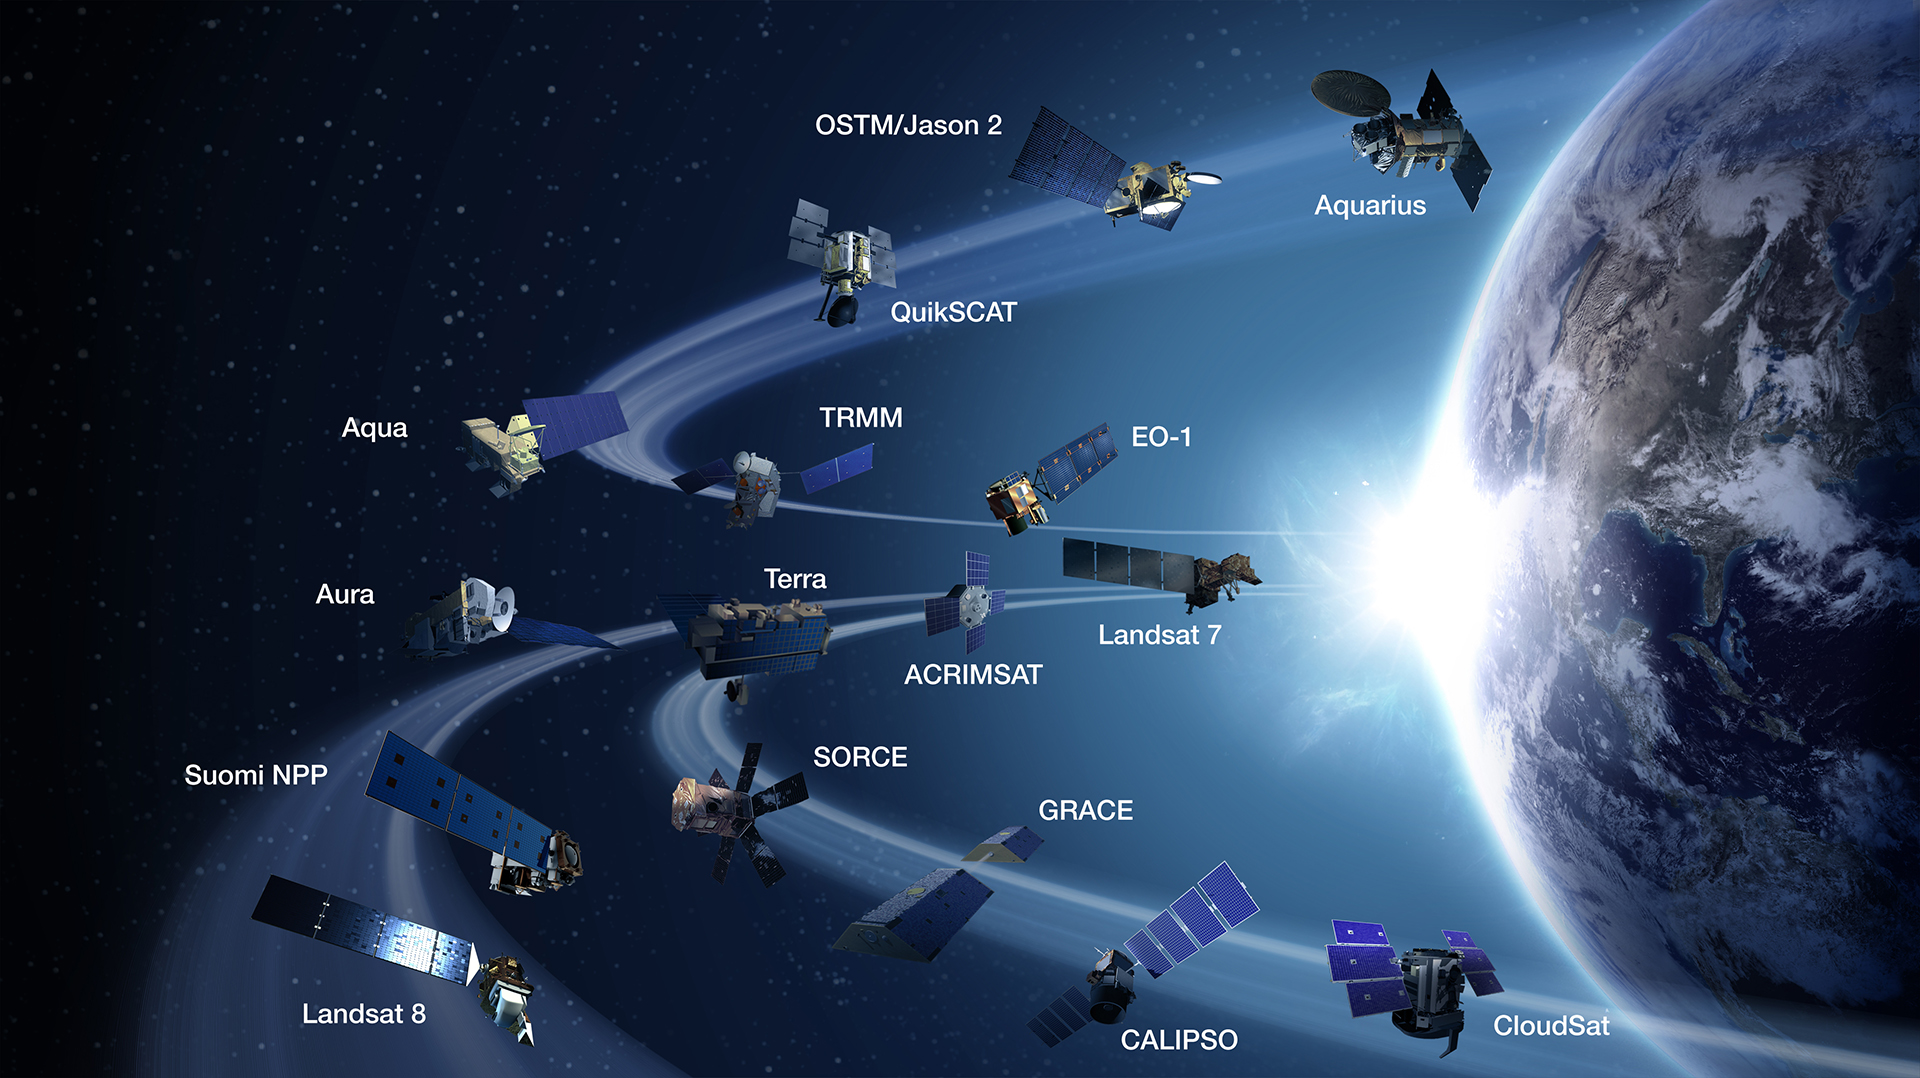
As he noted in his piece, NASA’s Earth science and Earth observation efforts are vital, and the shared missions they have with organizations like the NOAA have numerous benefits. As he explained:
“There’s a reason why space is called ‘the ultimate high ground’ and our country spends billions of dollars each year on space-based assets to support our national intelligence community. In addition to national security, NASA missions contribute vital information to many other users, including emergency managers and the Federal Emergency Management Agency (FEMA), farmers, fishermen and the aviation industry.”
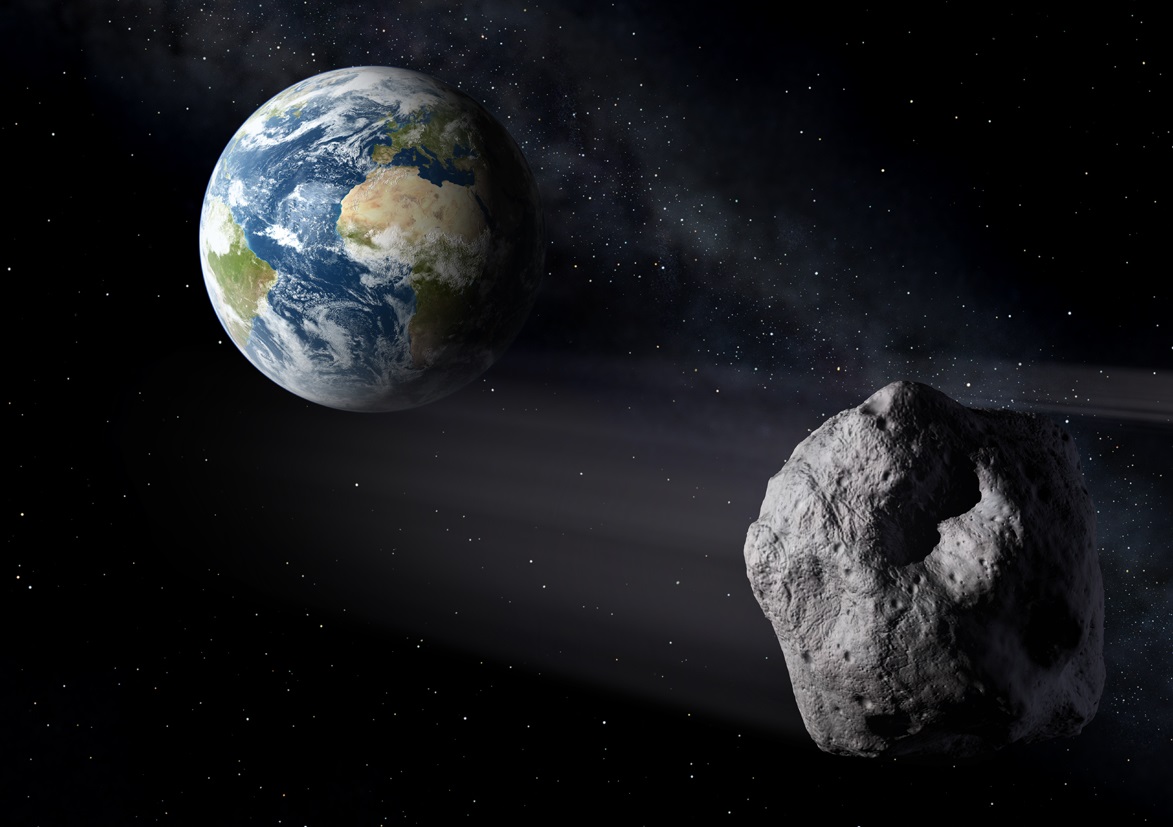
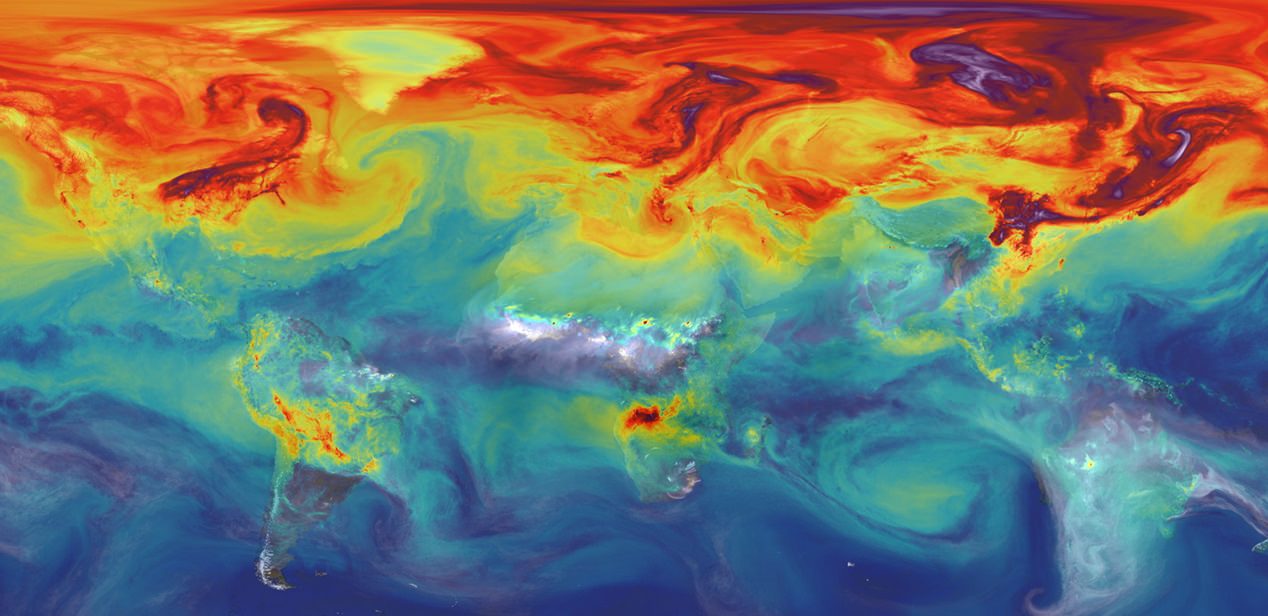
In the past, NASA’s Earth Science Directorate has contributed vital information on how rising temperatures could affect water tables and farmlands (such as the ongoing drought in California), and how changes in oceanic systems would affect fisheries. On top of that, FEMA has been working with NASA in recent years in order to develop a disaster-readiness program to address the fallout from a possible asteroid impact.
This has included three tabletop exercises where the two agencies worked through asteroid impact scenarios and simulated how information would be exchanged between NASA scientists an FEMA emergency managers. As Melissa Weihenstroer – a Presidential Management Fellow in FEMA’s Office of External Affairs and who works with NASA’s Planetary Defense Coordination Office – recently wrote about this inter-agency cooperation:
“Since FEMA doesn’t have direct experience with asteroids or their impacts, we’ve turned to some people who do: our partners at the National Aeronautics and Space Administration (NASA). While FEMA will be the agency in charge of the U.S. government efforts in preparing for and responding to any anticipated asteroid-related event here on Earth, NASA is responsible for finding, tracking, and characterizing potentially hazardous asteroids and comets while they are still in space.
Whenever a transition occurs between one presidential administration and the next, there is always some level of concern about the impact it will have on federal organization. However, when an administration is unclear about its policies, and has made statements to the effect that federal agencies should cease conducting certain types of research, NASA can be forgiven for getting a little nervous.
In the coming years, it will be interesting to see how the budget environment changes for Earth science research. One can only hope that a Trump administration will not see fit to make sweeping cuts without first considering the potential consequences.
Further Reading: The Conversation, The Washington Post


![The Standard Model of Elementary Particles. Image: By MissMJ - Own work by uploader, PBS NOVA [1], Fermilab, Office of Science, United States Department of Energy, Particle Data Group, CC BY 3.0](https://www.universetoday.com/wp-content/uploads/2016/05/Standard_Model_of_Elementary_Particles.svg_.png)