What’s the Most Stable Shape for an Interstellar Lightsail?

Project Starshot, an initiative sponsored by the Breakthrough Foundation, is intended to be humanity's first interstellar voyage. Credit: breakthroughinitiatives.org

In 2015, Russian billionaire Yuri Milner founded Breakthrough Initiatives with the intention of bolstering the search for extra-terrestrial life. Since that time, the non-profit organization – which is backed by Stephen Hawking and Mark Zuckerberg – has announced a number of advanced projects. The most ambitious of these is arguably Project Starshot, an interstellar mission that would make the journey to the nearest star in just 20 years.

This concept involves an ultra-light nanocraft that would rely on a laser-driven sail to achieve speeds of up to 20% the speed of light. Naturally, for such a mission to be successful, a number of engineering challenges have to be tackled first. And according to a recent study by a team of international researchers, two of the most important issues are the shape of the sail itself, and the type of laser involved.

The researchers include Elena Popova of the Skobeltsyn Institute of Nuclear Physics in Moscow; Messoud Efendiev of the Institute of Computational Biology (ICB) at the German Research Center for Environmental Health (GmbH); and Ildar Gabitov of the Skoltech Center for Photonics and Quantum Materials in Moscow. Combining their expertise, they conducted a study that examined various stability models for this proposed mission.

As they indicate in their study, titled “On the Stability of a Space Vehicle Riding on an Intense Laser Beam“, the team ran stability simulations 0n the concept, taking into account the nature of the wafer-sized craft (aka. StarChip), the sail (aka. Lightsail) and the nature of the laser itself. For the sake of these simulations, they also factored in a number of assumptions about Starshot’s design.

These included the notion that the StarChip would be a rigid body (i.e. made up of solid material), that the circular sail would either be flat, spherical or conical (i.e. concave in shape), and that the surface of the sail would reflect the laser light. Beyond this, they played with multiple variations on the design, and came up with some rather telling results.

As Dr. Elena Popova, the lead author on the paper, told Universe Today via email:

“We considered different shapes of sail: a) spherical (coincides with parabolic for small sizes) as most appropriate for final configuration of nanocraft en route; b) conical; c) flat (simplest) (will be seen to be unstable so that even spinning of craft does not help).”

What they found was that the simplest, stable configuration would involve a sail that was spherical in shape. It would also require that the StarChip be tethered at a sufficient distance from the sail, one which would be longer than the curvature radius of the sail itself.

A phased laser array, perhaps in the high desert of Chile, propels sails on their journey. Credit: Breakthrough Initiatives.
A phased laser array, perhaps in the high desert of Chile, propels sails on their journey. Credit: Breakthrough Initiatives

“For the sail with almost flat cone shape we obtained similar stability condition,” said Popova. “The nanocraft with flat sail is unstable in every case. It simply corresponds to the case of infinite radius of curvature of the sale. Hence, there is no way to extend center of mass beyond it.”

As for the laser, they considered several how the two main types would effect stability. This included uniform lasers that have a sharp boundary and “Gaussian” beams, which are characterized by high-intensity in the middle that declines rapidly towards the edges. As Dr. Popova stated, they determined that in order to ensure stability – and that the craft wouldn’t be lost to space – a uniform laser was the way to go.

“The nanocraft driven by intense laser beam pressure acting on its Lightsail is sensitive to the torques and lateral forces reacting on the surface of the sail. These forces influence the orientation and lateral displacement of the spacecraft, thus affecting its dynamics. If unstable the nanocraft might even be expelled from the area of laser beam. The most dangerous perturbations in the position of nanocraft inside the beam and its orientation relative to the beam axis are those with direct coupling between rotation and displacement (“spin-orbit coupling”).”

In the end, these were very similar to the conclusions reached by Professor Abraham Loeb and his colleagues at Starshot. In addition to being the Frank B. Baird, Jr. Professor of Science at Harvard University, Prof. Loeb is also the chairman of the Breakthrough Foundation’s Advisory Board. In a study titled Stability of a Light Sail Riding on a Laser Beam” (published on Sept, 29th, 2016), they too examined what was necessary to ensure a stable mission.

This included the benefits of a conical vs. a spherical sail, and a uniform vs. a Gaussian beam. As Prof. Loeb told Universe Today via email:

“We found that a parachute-shaped sail riding on a Gaussian laser beam is unstable… We show in our paper that a sail shaped as a spherical shell (like a large ping-pong ball) can ride in a stable fashion on a laser beam that is shaped like a cylinder (or 3-4 lasers that establish a nearly circular illumination).”

As for the recommendations about the StarChip being at a sufficient distance from the LightSail, Prof. Loeb and his colleagues are of a different mind. “They argue that in case you attach a weight to the sail that is sufficiently well separated from the parachute, you might make it stable.” he said. “Even if this is true, it is unclear that their proposal is useful because such a configuration is rather complicated to build and launch.”

These are just a few of the engineering challenges facing an interstellar mission. Back in September, another study was released that assessed the risk of collisions and how it might effect the Starshot mission. In this case, the researchers suggested that the sail have a layer of shielding to absorb impacts, and that the laser array be used to clear debris in the LightSail’s path.

These conclusions echoed a similar study produced by Professor Phillip Lubin and his colleagues. A professor at the University of California, Santa Barbara (UCSB), Lubin is also one of the chief architects of Project Starshot and the mind behind the NASA-funded Directed Energy Propulsion for Interstellar Exploraiton (DEEP-IN) project and the Directed Energy Interstellar Study.

When Milner and the science team behind Starshot first announced their intention to create an interstellar spacecraft (in April 2016), they were met with a great deal of enthusiasm and skepticism. Understandably, many believed that such a mission was too ambitious, due to the challenges involved. But with every challenge that has been addressed, both by the Starshot team and outside researchers, the mission architecture has evolved.

At this rate, barring any serious complications, we may be seeing an interstellar mission taking place within a decade or so. And, barring any hiccups in the mission, we could be exploring Alpha Centauri or Proxima b up close within our lifetime!

Further Reading: arXiv

Best Photos Yet of the Mars Lander’s Demise

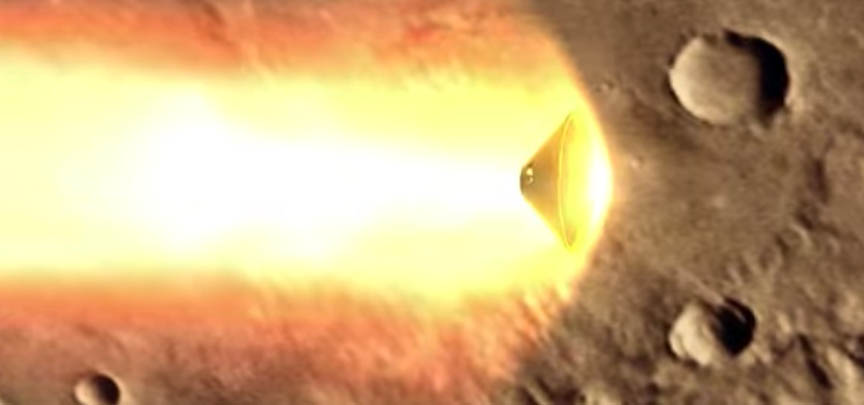
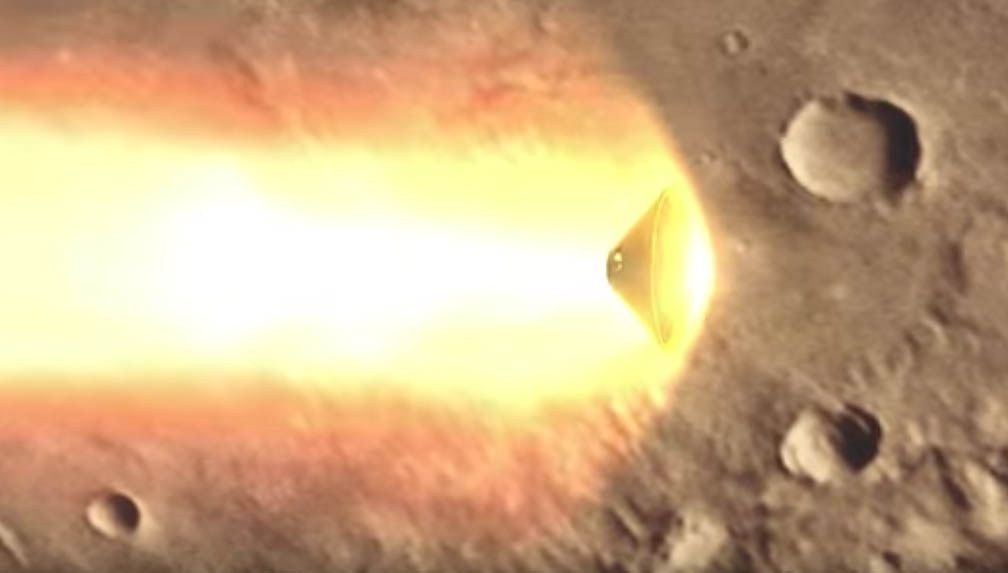
Credit: Schiaparelli lander protected by its heat shield as it enters the Martian atmosphere. Credit: ESA
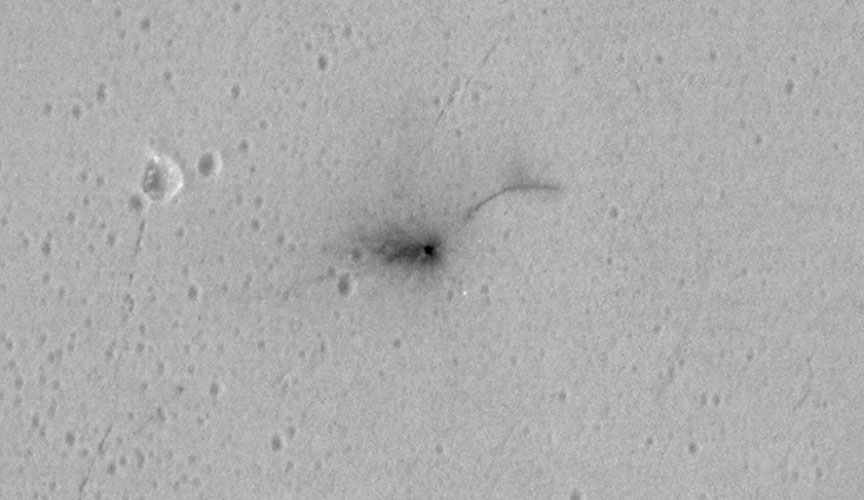
A closeup of the dark, approximately circular crater about 7.9 feet (2.4 meters) in diameter marking the crash of the Schiaparelli test lander on Mars. The photo was taken on October 25 by NASA's Mars Reconnaissance Lander (MRO). Credit:
A closeup of the dark, approximately circular crater about 7.9 feet (2.4 meters) in diameter that marks the crash of the Schiaparelli test lander on Mars. The new, higher-resolution photo was taken on October 25 by NASA’s Mars Reconnaissance Lander (MRO). A hint of an upraised rim is visible along the crater’s lower left side. The tiny white specks may be pieces of the lander that broke away on impact. The odd dark curving line has yet to be explained.  Credit: NASA/JPL-Caltech

What’s the most powerful telescope for observing Mars? A telephoto lens on the HiRise camera on the Mars Reconnaissance Orbiter that can resolve features as small as 3 feet (1-meter) across. NASA used that camera to provide new details of the scene near the Martian equator where Europe’s Schiaparelli test lander crashed to the surface last week.

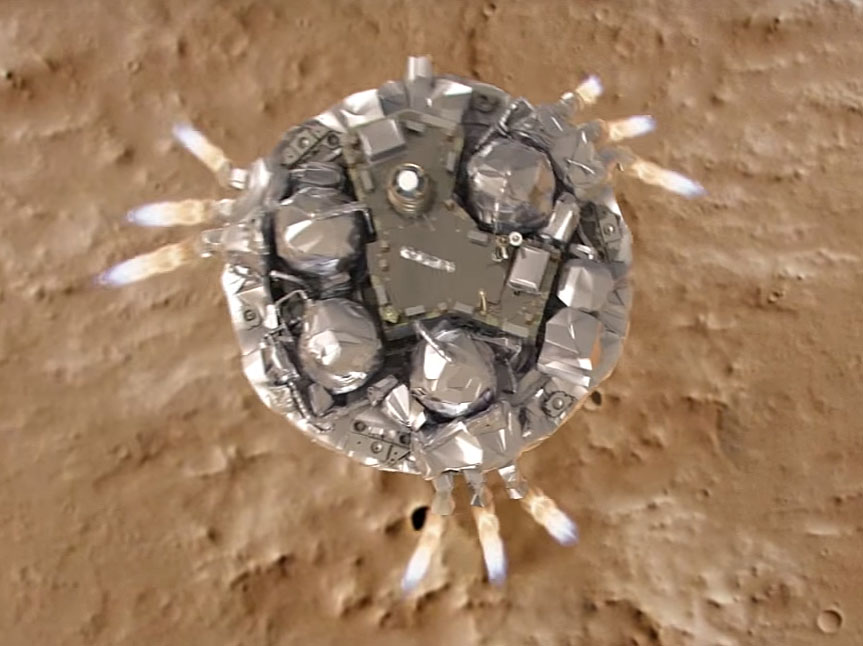
The Schiaparelli test lander was protected by its heat shield as it descended through the Martian atmosphere at high speed. Credit: ESA

During an October 25 imaging run HiRise photographed three locations where hardware from the lander hit the ground all within about 0.9 mile (1.5 kilometers) of each other. The dark crater in the photo above is what you’d expect if a 660-pound object (lander) slammed into dry soil at more than 180 miles an hour (300 km/h). The crater’s about a foot and a half (half a meter) deep and haloed by dark rays of fresh Martian soil excavated by the impact.

But what about that long dark arc northeast of the crater?  Could it have been created by a piece of hardware jettisoned when Schiaparelli’s propellant tank exploded? The rays are curious too. The European Space Agency says that the lander fell almost vertically when the thrusters cut out, yet the asymmetrical nature of the streaks — much longer to the west than east — would seem to indicate an oblique impact. It’s possible, according to the agency, that the hydrazine propellant tanks in the module exploded preferentially in one direction upon impact, throwing debris from the planet’s surface in the direction of the blast, but more analysis is needed. Additional white pixels in the image could be lander pieces or just noise.

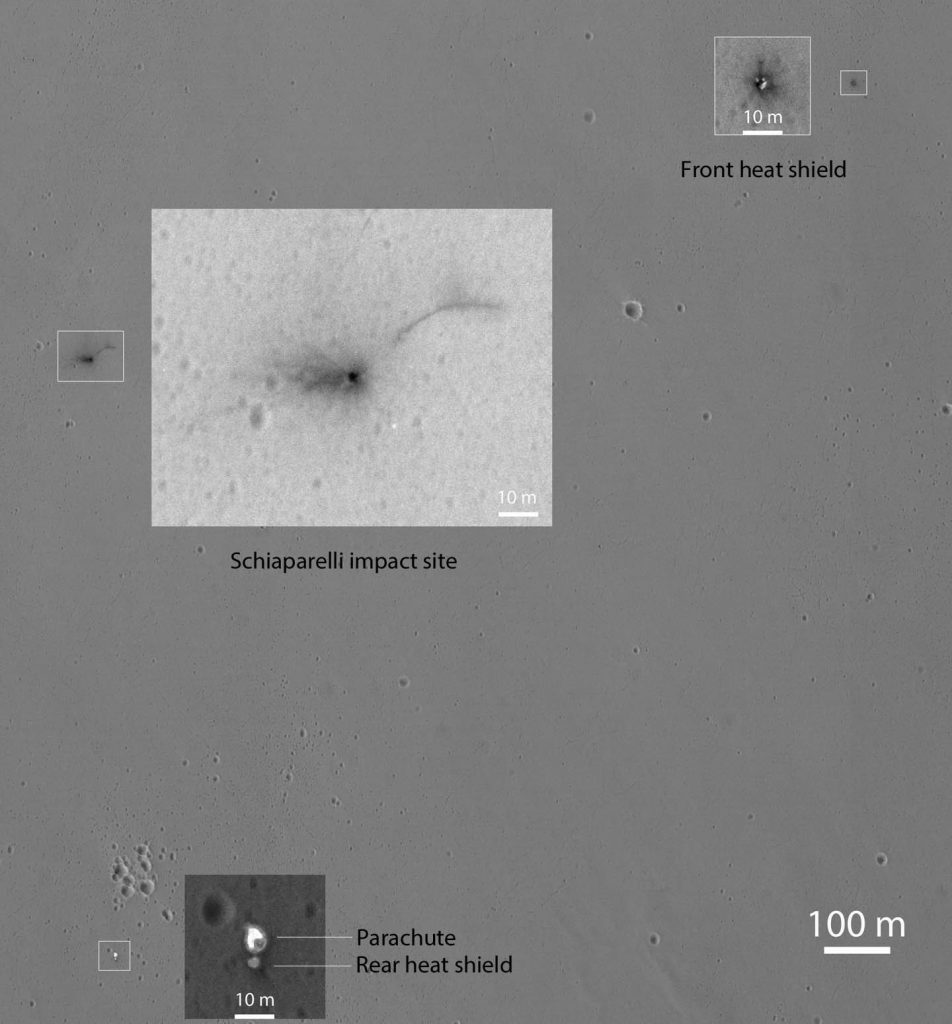
This Oct. 25, 2016, image shows the area where the European Space Agency's Schiaparelli test lander reached the surface of Mars, with magnified insets of three sites where components of the spacecraft hit the ground. It is the first view of the site from the High Resolution Imaging Science Experiment (HiRISE) camera on NASA's Mars Reconnaissance Orbiter taken after the Oct. 19, 2016, landing event and our highest resolution of the scene to date. Annotations by the author. Click for a full-resolution image. Credit: NASA/JPL-Caltech
This Oct. 25, 2016, image shows the area where the European Space Agency’s Schiaparelli test lander reached the surface of Mars, with magnified insets of three sites where components of the spacecraft hit the ground. It is the first view of the site from the High Resolution Imaging Science Experiment (HiRISE) camera on NASA’s Mars Reconnaissance Orbiter taken after the Oct. 19, 2016, landing event and our highest resolution of the scene to date. Click for a full-resolution image. Credit: NASA/JPL-Caltech

In the wider shot, several other pieces of lander-related flotsam are visible. About 0.8 mile (1.4 km) eastward, you can see the tiny crater dug out when the heat shield smacked the ground. Several bright spots might be pieces of its shiny insulation. About 0.6 mile (0.9 kilometer) south of the lander impact site, two features side-by-side are thought to be the spacecraft’s parachute and the back shell.  NASA plans additional images to be taken from different angle to help better interpret what we see.

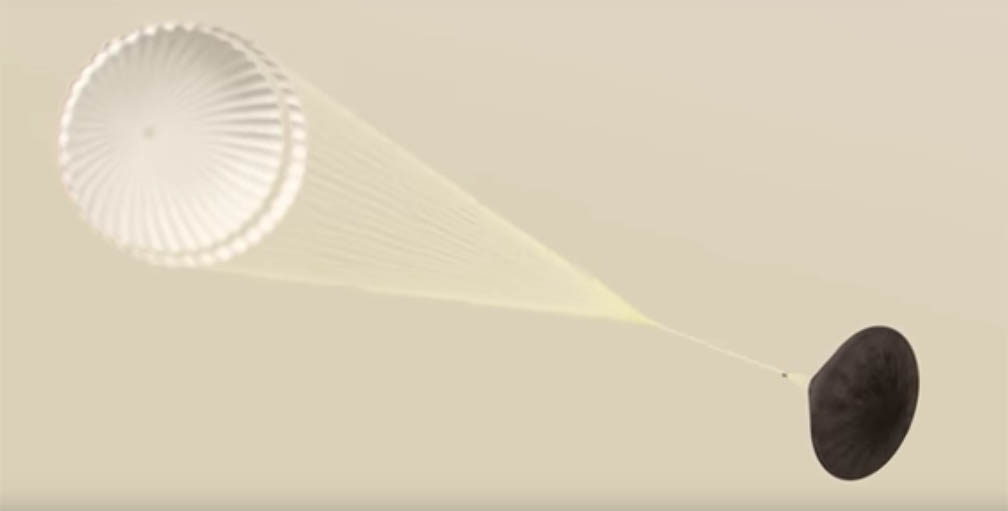
The last happy scene for the lander when it still dangled from its chute before dropping and slamming into the surface. Credit: ESA
Schiaparelli dangles from its parachute in this artist’s view. A software error caused the chute to deploy too soon. Credit: ESA

The test lander is part of the European Space Agency’s ExoMars 2016 mission, which placed the Trace Gas Orbiter into orbit around Mars on Oct. 19. The orbiter will investigate the atmosphere and surface of Mars in search of organic molecules and provide relay communications capability for landers and rovers on Mars. Science studies won’t begin until the spacecraft trims its orbit to a 248-mile-high circle through aerobraking, which is expected to take about 13 months.

Everything started out well with Schiaparelli, which successfully transmitted data back to Earth during its descent through the atmosphere, the reason we know that the heat shield separated and the parachute deployed as planned. Unfortunately, the chute and its protective back shell ejected ahead of time followed by a premature firing of the thrusters. And instead of burning for the planned 30 seconds, the rockets shut off after only 3. Why? Scientists believe a software error told the lander it was much closer to the ground than it really was, tripping the final landing sequence too early.

Landing on Mars has never been easy. We’ve done flybys, attempted to orbit the planet or land on its surface 44 times. 15 of those have been landing attempts, with 7 successes: Vikings 1 and 2, Mars Pathfinder, the Spirit and Opportunity rovers, the Phoenix Lander and Curiosity rover. We’ll be generous and call it 8 if you count the 1971 landing of Mars 3 by the then-Soviet Union. It reached the surface safely but shut down after just 20 seconds.

Mars can be harsh, but it forces us to get smart.

**** Want to learn more about Mars and how to track it across the sky? My new book, Night Sky with the Naked Eye, which will be published on Nov. 8, covers planets, satellites, the aurora and much more. You can pre-order it right now at these online stores. Just click an icon to go to the site of your choice – Amazon, Barnes & Noble or Indiebound. It’s currently available at the first two outlets for a very nice discount.

Night Sky book cover Amazon anno
Night Sky book cover BN

Night Sky book cover Indie

If it Wasn’t Already Strange Enough, now Saturn’s Hexagon Storm is Changing Color

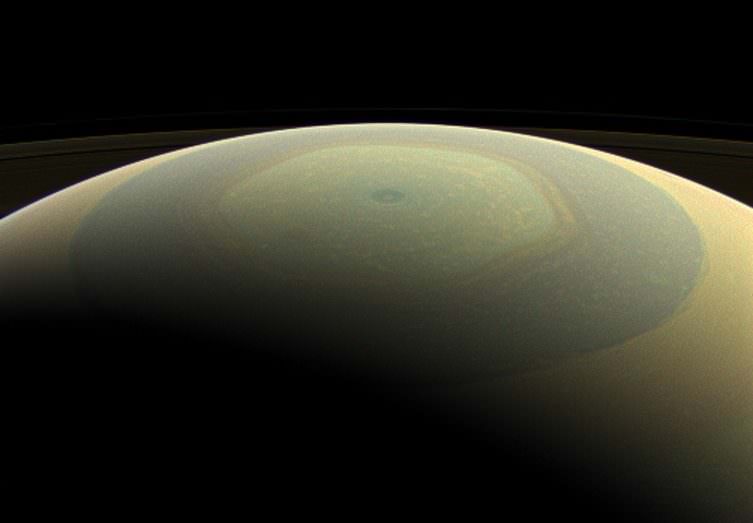
Saturn makes a beautifully striped ornament in this natural-color image, showing its north polar hexagon and central vortex (Credit: NASA/JPL-Caltech/Space Science Institute)

Ever since the Voyager 2 made its historic flyby of Saturn, astronomers have been aware of the persistent hexagonal storm around the gas giant’s north pole. This a six-sided jetstream has been a constant source of fascination, due to its sheer size and immense power. Measuring some 13,800 km (8,600 mi) across, this weather system is greater in size than planet Earth.

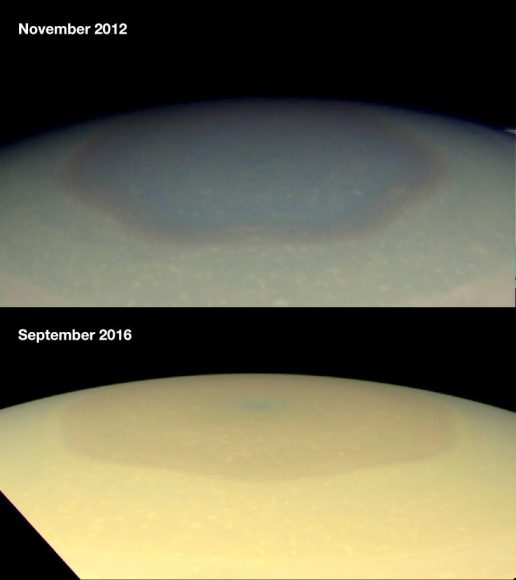
And thanks to the latest data to be provided by the Cassini space probe, which entered orbit around Saturn in 2009, it seems that this storm is even stranger than previously thought. Based on images snapped between 2012 and 2016, the storm appears to have undergone a change in color, from a bluish haze to a golden-brown hue.

The reasons for this change remain something of a mystery, but scientists theorize that it may be the result of seasonal changes due to the approaching summer solstice (which will take place in May of 2017). Specifically, they believe that the change is being driven by an increase in the production of photochemical hazes in the atmosphere, which is due to increased exposure to sunlight.

 Natural color images taken by NASA's Cassini wide-angle camera, showing the changing appearance of Saturn's north polar region between 2012 and 2016.. Credit: NASA/JPL-Caltech/Space Science Institute/Hampton University
Natural color images taken by NASA’s Cassini wide-angle camera, showing the changing appearance of Saturn’s north polar region between 2012 and 2016.. Credit: NASA/JPL-Caltech/Space Science Institute/Hampton University

This reasoning is based in part on past observations of seasonal change on Saturn. Like Earth, Saturn experiences seasons because its axis is tilted relative to its orbital plane (26.73°). But since its orbital period is almost 30 years, these seasons last for seven years.

Between November 1995 and August 2009, the hexagonal storm also underwent some serious changes, which coincided with Saturn going from its Autumnal to its Spring Equinox. During this period, the north polar atmosphere became clear of aerosols produced by photochemical reactions, which was also attributed to the fact that the northern polar region was receiving less in the way of sunlight.

However, since that time, the polar atmosphere has been exposed to continuous sunlight, and this has coincided with aerosols being produced inside the hexagon, making the polar atmosphere appear hazy. As Linda J. Spilker, the Cassini mission’s project scientist, told Universe Today via email:

“We have seen dramatic changes in the color inside Saturn’s north polar hexagon in the last 4 years.  That color change is probably the result of changing seasons at Saturn, as Saturn moves toward northern summer solstice in May 2017. As more sunlight shines on the hexagon, more haze particles are produced and this haze gives the hexagon a more golden color.”
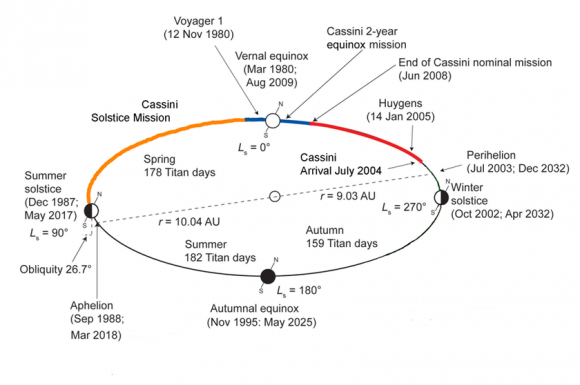
This diagram shows the main events of Saturn's year, and where in the Saturnian year the Voyager 1 and Cassini missions occurred. Credit: Ralph Lorenz
Diagram showing he main events of Saturn’s year, and where in the Saturnian year the Voyager 1 and Cassini missions occurred. Credit: Ralph Lorenz

All of this has helped scientists to test theoretical models of Saturn’s atmosphere. In the past, it has been speculated that this six-sided storm acts as a barrier that prevents outside haze particles from entering. The previous differences in color – the planet’s atmosphere being golden while the polar storm was darker and bluish – certainly seemed to bear this out.

The fact that it is now changing color and starting to look more like the rest of the atmosphere could mean that the chemical composition of the polar region is now changing and becoming more like the rest of the planet. Other effects, which include changes in atmospheric circulation (which are in turn the result of seasonally shifting solar heating patterns) might also be influencing the winds in the polar regions.

Needless to say, the giant planets of the Solar System have always been a source of fascination for scientists and astronomers. And if these latest images are any indication, it is that we still have much to learn about the dynamics of their atmospheres.

“It is very exciting to see this transformation in Saturn’s hexagon color with changing seasons,” said Spilker. “With Saturn seasons over 7 years long, these new results show us that it is certainly worth the wait.”

 R. G. French (Wellesley College) et al., NASA, ESA, and The Hubble Heritage Team (STScI/AURA)
The seasons on Saturn, visualized with images taken by the Hubble Heritage Team. Credit: R. G. French (Wellesley College) et al./NASA/ESA/Hubble Heritage Team (STScI/AURA)

It also shows that Cassini, which has been in operation since 1997, is still able to provide new insights into Saturn and its system of moons. In recent weeks, this included information about seasonal variations on Titan, Saturn’s largest moon. By April 22nd, 2017, the probe will commence its final 22 orbits of Saturn. Barring any mission extensions, it is scheduled enter into Saturn’s atmosphere (thus ending its mission) on Sept. 15th, 2017.

Further Reading: NASA/JPL/Caltech

Planets Around Stars like Proxima Centauri are Probably Earth-Sized Water Worlds

Artist's impression of an "eyeball" planet, a water world where the sun-facing side is able to maintain a liquid-water ocean. Credit and Copyright: eburacum45/ DeviantArt

Proxima b is the subject of a lot interest these days. And why not? As the closest extrasolar planet to our Solar System, it is the best shot we have at studying exoplanets up close in the near future. However, a recent study from the University of Marseilles indicated that, contrary to what many hoped, the planet may be a “water world” – i.e. a planet where up to half of its mass consists of water.

And now, researchers from the University of Bern have taken this analysis a step further. Based on their study, which has been accepted for publication in the journal Astronomy and Astrophysics (A&A), they have determined that the majority planets that form within the habitable zones of a red dwarf star may be water worlds. These findings could have drastic implications for the search for habitable exoplanets around red dwarf stars.

The research was conducted by Dr. Yann Alibert from the National Centers for Competence in Research (NCCR) PlanetS center and Prof. Willy Benz from the Center of Space and Habitability (CSH). Both of these institutions, which are located at the University of Bern, are dedicated to understanding planetary formation and evolution, as well as fostering a dialogue with the public about exoplanet research.

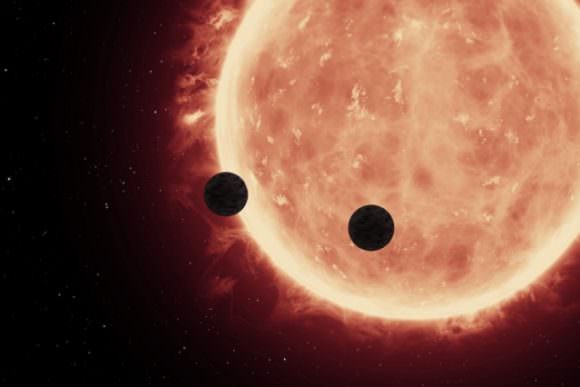
An artist’s depiction of planets transiting a red dwarf star in the TRAPPIST-1 System. Credit: NASA/ESA/STScl

For the sake of their study, titled “Formation and Composition of Planets Around Very Low Mass Stars“, Alibert and Benz carried out the first computer simulation designed to examine the formation of planets around stars that are ten times less massive than our Sun. This involved creating a model that included hundreds of thousands of identical low-mass stars, which were then given orbiting protoplanetary disks of dust and gas.

They then simulated what would happen if planets began to form from the accretion of these disks. For each, they assumed the existence of ten “planetary embryos” (equal to the mass of the Moon) which would grow and migrate over time, giving rise to a system of planets.

Ultimately, what they found was that the planets orbiting within the habitable zone of their parent star would likely to be comparable in size to Earth – ranging from 0.5 to 1.5 times the radius of Earth, with 1 Earth radii being the average. As Dr. Yann Alibert explained to Universe Today via email:

“In the simulations we have considered here, it appears that the majority of the mass (more than 99%) is in the solids. [W]e therefore start with a protoplanetary disk that is made of solids and gas and 10 planetary embryos. The solids in the disk are planetesimals (similar to present day asteriods, around 1 km in size), that can be dry (if they are located in the hot regions of the protoplanetary disk) or wet (around 50% per mass of water ice, if they are in the cold regions of the disk). The planetary embryos are small bodies, whose mass is similar to the moon mass. We then compute how much of the disk solids are capture by the planetary embryos.”

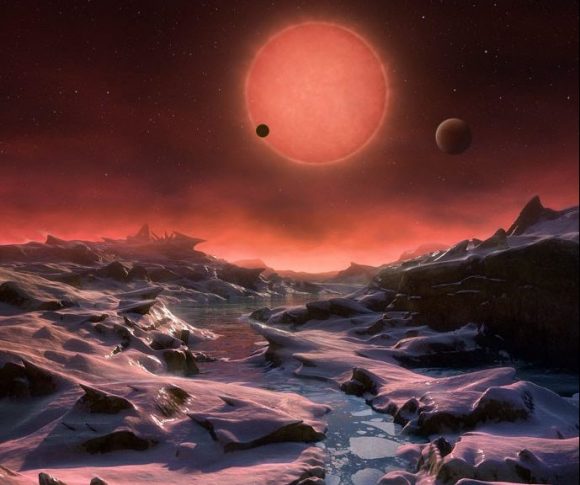
Artist's impression of the view from the most distant exoplanet discovered around the red dwarf star TRAPPIST-1. Credit: ESO/M. Kornmesser.
Artist’s impression of the view from the most distant exoplanet discovered around the red dwarf star TRAPPIST-1. Credit: ESO/M. Kornmesser.

In addition, the simulations produced some interesting estimates on how much of the planets would consist of water. In 90% of cases, water would account for more than 10% of the planets’ mass. Compare that to Earth, where water covers over 70% of our surface, but makes up only about 0.02% of our planet’s total mass. This would mean that the exoplanets would have very deep oceans and a layer of ice at the bottom, owing to the extreme pressure.

Last, but not least, Alibert and Benze found that if the protoplanetary disks that these planets formed from lived longer than the models suggested, the situation would be even more extreme. All of this could be dire news for those hoping that we might find ET living next door, or that red dwarf stars are the best place to look for intelligent life.

“The fact that many planets are water rich could have potentially very strong (and negative) consequence on the habitability of such planets,” said Dr. Alibert. “In fact, we already showed in other articles (Alibert et al 2013, Kitzmann et al. 2015) that if there is too much water on a planet, this may lead to an unstable climate, and an atmosphere that could be very rich in CO2.”

However, Alibert indicates that these two studies were conducted based on planets that orbit stars similar to our Sun. Red dwarfs are different because they evolve much slower (i.e. the luminosity changes very slowly over time) and they are far more red than our Sun, meaning that the light coming from them has different wavelengths that will interact different with planetary atmospheres.

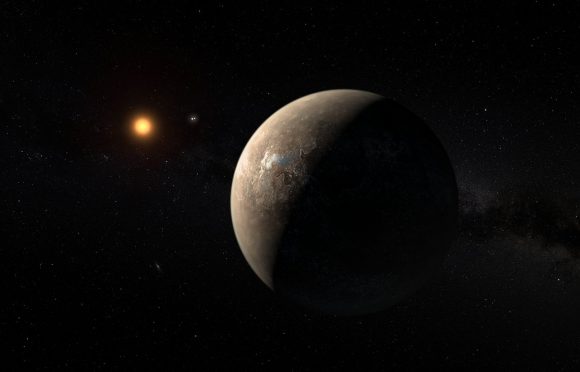
Artist’s impression of the planet Proxima b orbiting the red dwarf star Proxima Centauri, the closest star to the Solar System. Credit: ESO/M. Kornmesser

“So, to summarize, it could be that the presence of large amounts of water is not so bad as in the case of solar type stars, but it could also well be that it is even worse for reasons that we do not know,” said Alibert. “Whatever the effect, it is something that is important to study, and we have started working on this subject.”

But regardless of whether or not planets that orbit red dwarf stars are habitable, simulations like this one are still exciting. Aside from offering data on what neighboring planets might look like, they also help us to understand the wide range of possibilities that await us out there. And last, they give us more incentive to actually get out there and explore these worlds up close.

Only be sending missions to other stars can we confirm or deny if they are capable of supporting life. And if in the end, we should find that the most common star in the Universe is unlikely to produce life-giving planets, it only serves to remind us how rare and precious “Earth-like” planets truly are.

Further Reading: University of Bern, arXiv

What is a Waxing Moon?

The waxing gibbous Moon closes in on Aldebaran (lower left). Image credit and copyright: Sarah & Simon Fisher

As you’ve probably noticed, the Moon looks different from one evening to the next. Sometimes we see a New Moon, when the Moon is enshrouded in shadow. At other times, we see a Full Moon, when the entire face of the Moon is illuminated. And of course, there are the many phases in between, where portions of the Moon are illuminated.

This is what is called a Lunar Cycle, a 29 ½-day period (aka. lunar month) where the Moon becomes brighter and dimmer, depending on its orientation with the Earth and the Sun. During the first half of a lunar month, when the amount of illumination on the Moon is increasing, astronomers call this a “waxing moon”.

Lunar Cycle:

To understand the Lunar Cycle, we first must consider the Moon’s orbit in relation to Earth. Basically, the Moon orbits Earth, and Earth orbits the Sun, which means the Moon is always half illuminated by the latter. But from our perspective here on Earth, which part of the Moon is illuminated – and how much – changes over time.

When the Sun, the Moon and Earth are perfectly lined up, the angle between the Sun and the Moon is 0-degrees. At this point, the side of the Moon facing the Sun is fully illuminated, and the side facing the Earth is enshrouded in darkness. We call this a New Moon.

After this, the phase of the Moon changes, because the angle between the Moon and the Sun is increasing from our perspective. A week after a New Moon, and the Moon and Sun are separated by 90-degrees, which effects what we will see. And then, when the Moon and Sun are on opposite sides of the Earth, they’re at 180-degrees – which corresponds to a Full Moon.

Waxing vs. Waning:

The period in which a Moon will go from a New Moon to a Full Moon and back again is known as “Lunar Month”. One of these lasts 28 days, and encompasses what are known as “waxing” and “waning” Moons. During the former period, the Moon brightens and its angle relative to the Sun and Earth increases.

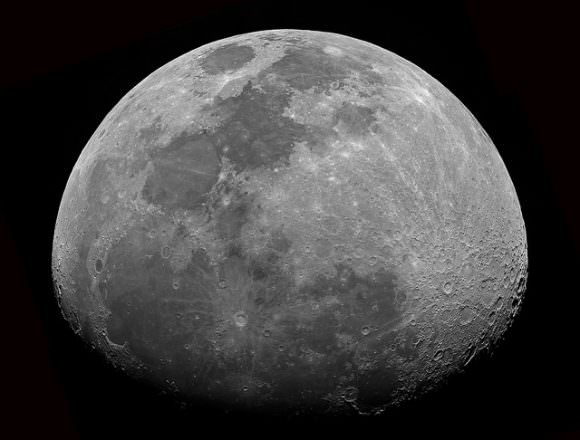
A waxing gibbous Moon from October 12th, headed towards Full this weekend. Image credit and copyright: John Brimacombe.

When the Moon is in between the Earth and the Sun, the side of the Moon facing away from the Earth is fully illuminated, and the side we can see is shrouded in darkness. As the Moon orbits the Earth, the angle between the Moon and the Sun increases. At this point, the angle between the Moon and Sun is 0 degrees, which gradually increases over the next two weeks. This is what astronomers call a waxing moon.

After the first week, the angle between the Moon and the Sun is 90-degrees and continues to increase to 180-degrees, when the Sun and Moon are on opposite sides of the Earth. When the Moon starts to decrease its angle again, going from 180-degrees back down to 0-degrees, astronomers say that it’s a waning moon. In other words, when the Moon is waning, it will have less and less illumination every night until it’s a New Moon.

Waxing Phases:

The period when the Moon is waxing occurs between a New Moon and a Full Moon, which is characterized by many changes in appearance. The first is known as a Waxing crescent, where 1-49% of the Moon is illuminated. Which side appears illuminated will depend on the observer’s location. For those living in the northern hemisphere, the right side will appear illuminated; whereas for those in the southern hemisphere, the reverse is the case.

Next up is the First Quarter, where 50% of the Moon’s face is illuminated – again, the right side for those in the northern hemisphere and the left for those in the south. This is followed by a Waxing Gibbous Moon, where 51 – 99% of the Moon’s surface is illuminated – right side in the northern hemisphere, left side in the southern. The waxing phase concludes with a Full Moon.

We have written many articles about the Moon here at Universe Today. Here’s What are the Phases of the Moon?, What is a Waning Moon?, What is a Hunter’s Moon?, A Red Moon – Not a Sign of the Apocalypse!, How Did the Moon Form? and What is the Distance to the Moon?

NASA has a cool list of all the Moon phases over the course of 6000 years. And here’s a calculator that shows the current phase of the Moon.

You can listen to a very interesting podcast about the formation of the Moon from Astronomy Cast, Episode 17: Where Did the Moon Come From?

Sources:

Evidence Continues To Mount For Ninth Planet

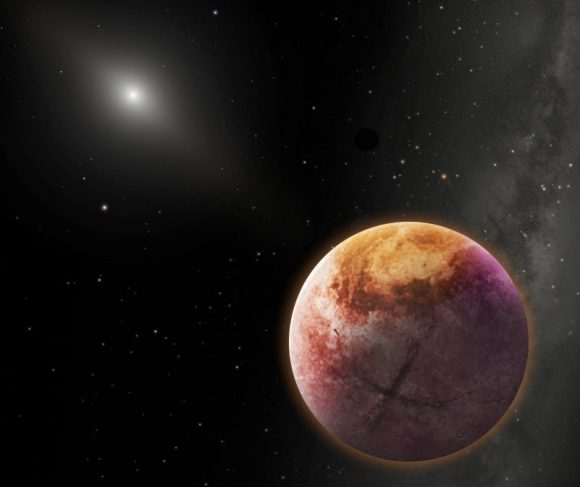
Artist's concept of the hypothetical "Planet Nine." Could it have moons? Credit: NASA/JPL-Caltech/Robert Hurt

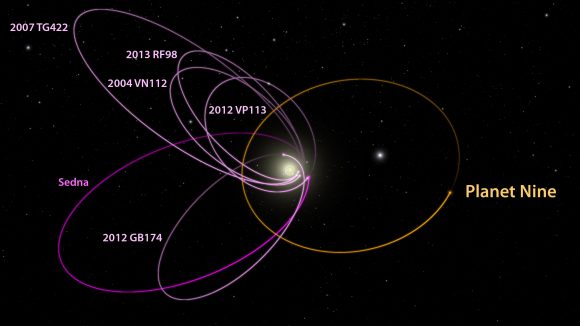
Ever since its existence was first proposed, the evidence for Planet 9 continues to mount. But of course, said evidence has been entirely indirect, consisting mostly of studies that show how the orbits of Trans-Neptunian Objects (TNOs) are consistent with a large object crossing their path. However, evidence is also emerging that comes from the center of the Solar System itself.

This latest line of evidence comes from Caltech, where researchers Elizabeth Bailey, Konstantin Batygin, and Michael E. Brown (the latter of whom were the ones who first proposed Planet 9’s existence) have published a new study linking solar obliquity to the existence of Planet 9. Essentially, they claim that the axial tilt of the Sun (6°) could be due to the gravitational influence a large planet with an extreme orbit.

To recap, the issue of Planet was first raised in 2014 by astronomers Scott Sheppard and Chadwick Trujillo. Noting the similarities in the orbits of distant Trans-Neptunian Objects (TNOs), they postulated that a massive object was likely influencing them. This was followed in 2016 by Konstantin Batygin and Michael E. Brown of Caltech suggesting that an undiscovered planet was the culprit.

The orbits of several KBOs provide indications about the possible existence of Planet 9. Credit: Caltech/R. Hurt (IPAC)

Calling this body Planet 9, they speculated that it had a mass 10 times greater than that of Earth, and took 20,000 years to complete a single orbit of our Sun. They also speculated that its orbit was tilted relative to the other planets of our Solar System, and extremely eccentric. And little by little, examinations of other Solar bodies have shown that Planet 9 is likely out there.

For the sake of their study – “Solar Obliquity Induced by Planet Nine“, which was recently published in the Astrophysical Journal – the research team (led by Bailey) looked to the obliquity of the Sun. As they state in their paper, the six-degree axial tilt of the Sun can only be explained in one of two ways – either as a result of an asymmetry that was present during the formation of Solar System, or because of an external source of gravity.

To test this hypothesis, Bailey, Batygin and Brown used an analytic model to test how interactions between Planet 9 and the rest of the Solar System would effect their orbits over the course of the last 4.5 billion years. As Elizabeth Bailey, a graduate student at Caltech’s Division of Geological and Planetary Sciences and the lead author on the paper, told Universe Today via email:

“We simulated the solar system’s motion. Planet 9 forces the solar system to slowly wobble. If Planet 9 is out there, we are in the process of wobbling right now, as we speak! But it happens very slowly, a few degrees tilt per billion years. Meanwhile the sun is not wobbling much,  so it looks like the sun is tilted. A range of Planet 9 parameters cause exactly the configuration of the sun that we see today.

Animated diagram showing the spacing of the Solar Systems planet’s, the unusually closely spaced orbits of six of the most distant KBOs, and the possible “Planet 9”. Credit: Caltech/nagualdesign

In the end, they concluded that the Sun’s obliquity could only be explained by the influence of giant planet with an extreme orbit, one that is consistent with the characteristics attributed to Planet 9. In other words, the existence of Planet 9 offers an explanation for the Sun’s peculiar behavior, something which has remained a mystery until now.

“Planet Nine was first hypothesized because the orbits of objects in the outer reaches of the solar system are confined in physical space,” said Bailey. “Those orbits would be all over the place unless something is currently stopping them. The only explanation so far is Planet Nine. For over 150 years, people have wondered why the sun is tilted. Personally I’d say that Planet 9 offers the first satisfying explanation. If it exists, it tilted the sun.”

In addition, the subject of Planet 9 was also raised at the joint 48th meeting of the American Astronomical Society’s Division for Planetary Sciences and 11th European Planetary Science Congress, which took place from Oct 16th to 21st in Pasadena, California. During the course of the meeting, researchers from Arizona University shared the results of their own study, which was published back in August.

The Arizona research team was led by Renu Malhotra, a Regents’ Professor of Planetary Sciences in the University of Arizona’s Lunar and Planetary Lab. For the sake of their study, titled “Corralling a Distant Planet with Extreme Resonant Kuiper Belt Objects“, they examined the orbital patterns of four extreme Kuiper Belt Objects (KBOs), which have the longest orbital periods of any known objects.

Artist's impression of the the possible Planet 9 at the edge of the Solar System. Credit: Robin Dienel/Carnegie Science
Artist’s impression of the the possible Planet 9 at the edge of the Solar System. Credit: Robin Dienel/Carnegie Science

According to their calculations, the presence of a massive planet – one that would complete an orbit around the Sun every 17,117 years, and at an average distance (semimajor axis) of 665 AU – would explain the orbital pattern of these four objects. These results were consistent with the estimates concerning the orbital period of Planet 9, its orbital path, and it mass.

“We analyzed the data of these most distant Kuiper Belt objects,” Malhotra said, “and noticed something peculiar, suggesting they were in some kind of resonances with an unseen planet… Our paper provides more specific estimates for the mass and orbit that this planet would have, and, more importantly, constraints on its current position within its orbit.”

Looks like Planet 9’s days of hiding in the outer Solar System may be numbered!

Further Reading: arXiv, Caltech, Europlanet

Boo! A Black Moon Halloween Weekend

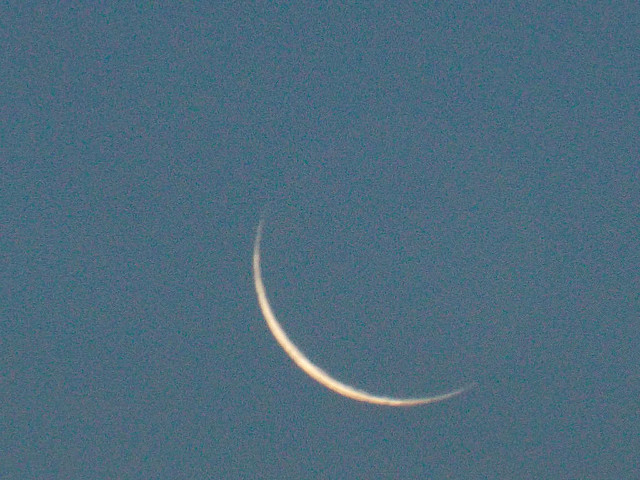
Black Moon
A razor thin Moon from October 22nd, 2014. Image credit and copyright: David Blanchflower.

This Halloween weekend’s top astronomical event features something that you won’t see in the sky.

By now, you’ve probably seen the stories circulating ’round ye ole web about how this month features a ‘Black Moon.’ The internet seems to love promulgating the passing of such curious calendrical oddities as Moons both Black, Blue and otherwise.

What’s all of the hoopla about? Well, simply put, the Moon reaches New phase this weekend on October 30th at 17:38 Universal Time (UT), marking the start of lunation 1161. This is the second New Moon for the month, as the first fell on October 1st, just 11 minutes into the month as reckoned in Universal Time.

Now, this isn’t at all rare or unusual; the synodic period of the Moon (that is, the time it takes to return to a similar phase, such as New back to New) is 29.5 days long, a period that shoehorns well in to a 31 day month like October, or occasionally, a 30 day month.

More Fun With Calendars

February is the only month that cannot contain a ‘repeat phase,’ leap year or no. Occasionally, a given phase such as New or Full can be absent from short February all together… sometimes, this oddity is also sometimes referred to as a ‘Black Moon.’ 2014 and 2033 are the nearest years to 2016 that are missing New Moons in February.

And then there’s the relict definition of a Blue Moon as the ‘3rd in an astronomical season with 4…‘ that can also be ascribed to a Black Moon as relates to New phase, as if we already lack enough multi-hued Moons in or lives.

Keep in mind, the moment of New is but an instant, a point a which the Moon’s longitude along the ecliptic plane equals the Sun’s. The Moon makes a miss of the Sun on most lunations, and only directly passes between the Sun and the Earth during an annular or solar eclipse. We’ve got one each coming up in 2017: an annular solar eclipse crossing the southern tip of South America on February 26th, and the historic return of totality to the United States on August 21st, 2017.

Said high profile solar eclipse next August also has a lesser role, as it fits that old-timey definition of the 3rd New Moon in an astronomical season with four. Of course, this is only the juxtaposition of the lunar cycle on our current Gregorian calendar, using time reckoned in UT/GMT.

Don’t fear the Black Moon. This year’s New Moon just misses Halloween. The next New Moon on Halloween (which, of course, is always a ‘Black Moon’) occurs in 2035.

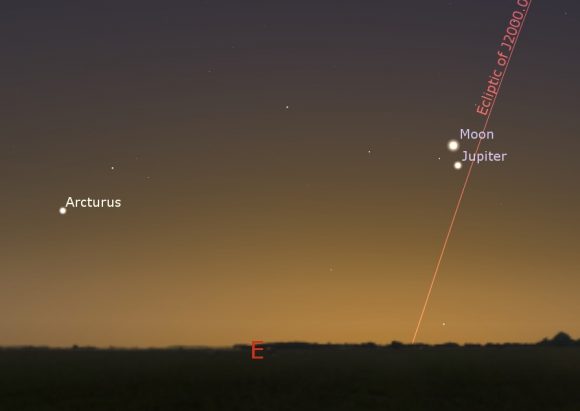
The view looking eastward on the morning of Friday, October 28th. Image credit: Stellarium

And we’ll let you in on a secret: astronomers don’t spend nights in mountaintop observatories discussing Black or Blue Moons… the term has more of an astrological tinge to it. Even in amateur astronomy circles, you sometimes hear the term ‘the dark of the Moon’ used to refer to the weeks surrounding New Moon, a prime time for deep sky astrophotography.

Looking for a New Moon-related observing challenge? Spotting the razor thin waxing or waning Moon is a fun feat of visual athletics. Look for a thin waning crescent Moon hanging near Jupiter on the morning of Friday, October 28th. This weekend, the first shot at catching the uber-thin Moon occurs for observers along a curve from southeastern Asia at dusk on October 31st westward at dusk. For Spain (and Astroguyz basecamp) the Moon will be 24 hours past New, and for the United States, the Moon will be 28 to 32 hours old at sunset for roaming Halloween ghouls and goblins, an easy catch.

First sighting opportunities for the waxing crescent Moon on Halloween evening. Graphic created by the author.

A time change is also afoot this weekend, as folks in Europe and the UK ‘fall back’ one hour to standard time. This setback falls nearly as late as it can in 2016, and we now enter that wacky oneeek period where the world slowly slips back to standard time. Blame ‘Big Sugar’ for the latency in most of North America, as prospective trick-or-treaters now make their rounds during daylight hours. In most of the US and Canada, the switch occurs on Sunday, November 6th.

And there’s one more astronomical tie-in for Halloween: the holiday traces its roots back as one of the four cross-quarter days of yore, including Lammas Day, Groundhog Day, and May Day. Of course, the fixing of Hallow’s Eve on October 31st makes the midway date only approximate: in 2016, the actual mid-point occurs on November 10th.

Out of this world stuff to consider, as you inventory the night’s sugary bounty and contemplate the night sky.

How Many Planets are There in the Galaxy?

Artist's impression of The Milky Way Galaxy. Based on current estimates and exoplanet data, it is believed that there could be tens of billions of habitable planets out there. Credit: NASA

On a clear night, and when light pollution isn’t a serious factor, looking up at the sky is a breathtaking experience. On occasions like these, it is easy to be blown away by the sheer number of stars out there. But of course, what we can see on any given night is merely a fraction of the number of stars that actually exist within our Galaxy.

What is even more astounding is the notion that the majority of these stars have their own system of planets. For some time, astronomers have believed this to be the case, and ongoing research appears to confirm it. And this naturally raises the question, just how many planets are out there? In our galaxy alone, surely, there must be billions!

Number of Planets per Star:

To truly answer that question, we need to crunch some numbers and account for some assumptions. First, despite the discovery of thousands of extra-solar planets, the Solar System is still the only one that we have studied deeply. So it could be that ours possesses more star systems than others, or that our Sun has a fraction of the planets that other stars do.

So let’s assume that the eight planets that exist within our Solar System (not taking into account Dwarf Planets, Centaurs, KBOs and other larger bodies) represent an average. The next step will be to multiply that number by the amount of stars that exist within the Milky Way.

Number of Stars:

To be clear, the actual number of stars in the Milky Way is subject to some dispute. Essentially, astronomers are forced to make estimates due to the fact that we cannot view the Milky Way from the outside. And given that the Milky Way is in the shape of a barred, spiral disc, it is difficult for us to see from one side to the other – thanks to light  interference from its many stars.

As a result, estimates of how many stars there are come down to calculations of our galaxy’s mass, and estimates of how much of that mass is made up of stars. Based on these calculations, scientists estimate that the Milky Way contains between 100 and 400 billion stars (though some think there could be as many as a trillion).

Doing the math, we can then say that the Milky Way galaxy has – on average – between 800 billion and 3.2 trillion planets, with some estimates placing that number as high a 8 trillion! However, in order to determine just how many of them are habitable, we need to consider the number of exoplanets discovered so far for the sake of a sample analysis.

Habitable Exoplanets:

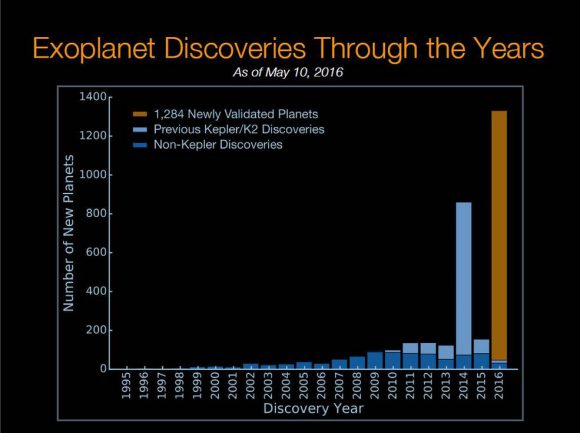
As of October 13th, 2016, astronomers have confirmed the presence of 3,397 exoplanets from a list of 4,696 potential candidates (which were discovered between 2009 and 2015). Some of these planets have been observed directly, in a process known as direct imaging. However, the vast majority have been detected indirectly using the radial velocity or transit method.

In the case of the former, the existence of planets is inferred based on the gravitational influence they have on their parent star. Essentially, astronomers measure how much the star moves back and forth to determine if it has a system of planets and how massive they are. In the case of the transit method, planets are detected when they pass directly in front of their star, causing it to dim. Here, size and mass are estimated based on the level of dimming.

In the course of its mission, the Kepler mission has observed about 150,000 stars, which during its initial four year mission consisted primarily of M-class stars. Also known as red dwarfs, these low-mass, lower-luminosity stars are harder to observe than our own Sun.

Histogram showing the number of exoplanets discovered by year. Credit: NASA Ames/W. Stenzel, Princeton/T. Morton

Since that time, Kepler has entered a new phase, also known as the K2 mission. During this phase, which began in November of 2013, Kepler has been shifting its focus to observe more in the way of K- and G-class stars – which are nearly as bright and hot as our Sun.

According to a recent study from NASA Ames Research Center, Kepler found that about 24% of M-class stars may harbor potentially habitable, Earth-size planets (i.e. those that are smaller than 1.6 times the radius of Earth’s). Based upon the number of M-class stars in the galaxy, that alone represents about 10 billion potentially habitable, Earth-like worlds.

Meanwhile, analyses of the K2 phase suggests that about one-quarter of the larger stars surveyed may also have Earth-size planet orbiting within their habitable zones. Taken together, the stars observed by Kepler make up about 70% of those found within the Milky Way. So one can estimate that there are literally tens of billions of potentially habitable planets in our galaxy alone.

In the coming years, new missions will be launching, like the James Webb Space Telescope (JWST) and the Transitting Exoplanet Survey Satellite (TESS). These missions will be able to detect smaller planets orbiting fainter stars, and maybe even determine if there’s life on any of them.

Once these new missions get going, we’ll have better estimates of the size and number of planets that orbit a typical star, and we’ll be able to come up with better estimates of just many planets there are in the galaxy. But until then, the numbers are still encouraging, as they indicate that the chances for extra-terrestrial intelligence are high!

We have written many articles about galaxies for Universe Today. Here’s How Many Stars are there in the Milky Way?, How Many Planets are there in the Solar System?, What are Extra-Solar Planets?, Planets Plentiful Around Abundant Red Dwarf Stars, Study Says, Life After Kepler: Upcoming Exoplanet Missions.

If you’d like more info on galaxies, check out Hubblesite’s News Releases on Galaxies, and here’s NASA’s Science Page on Galaxies.

We have also recorded an episode of Astronomy Cast about galaxies – Episode 97: Galaxies.

Sources:

Seasonal Change On Titan Is Dynamic Business

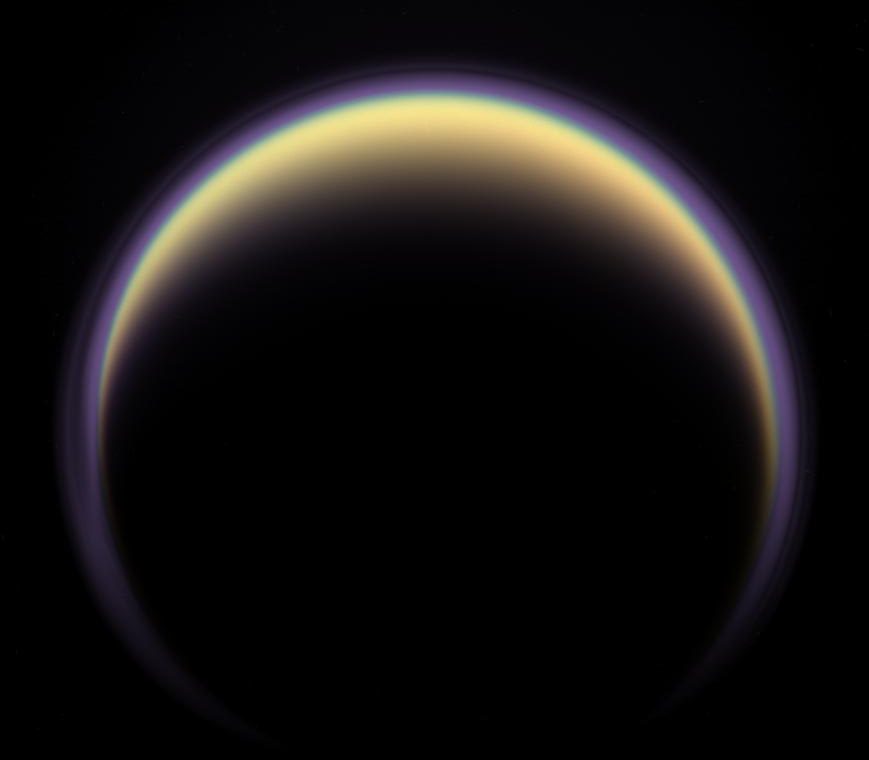
A halo of light surrounds Saturn's moon Titan in this backlit picture, showing its atmosphere. Credit: NASA/JPL/Space Science Institute

Ever since the Cassini probe arrived at Saturn in 2004, it has revealed some startling things about the planet’s system of moons. Titan, Saturn’s largest moon, has been a particular source of fascination. Between its methane lakes, hydrocarbon-rich atmosphere, and the presence of a “methane cycle” (similar to Earth’s “water cycle”), there is no shortage of fascinating things happening on this Cronian moon.

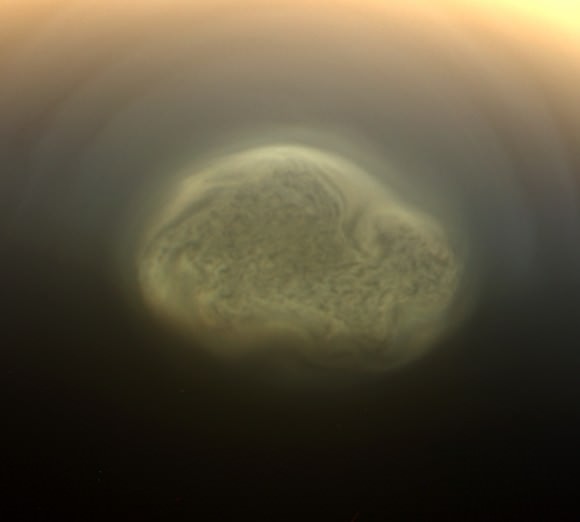
As if that wasn’t enough, Titan also experiences seasonal changes. At present, winter is beginning in the southern hemisphere, which is characterized by the presence of a strong vortex in the upper atmosphere above the south pole. This represents a reversal of what the Cassini probe witnessed when it first started observing the moon over a decade ago, when similar things were happening in the northern hemisphere.

These finding were shared at the joint 48th meeting of the American Astronomical Society’s Division for Planetary Sciences and 11th European Planetary Science Congress, which took place from Oct 16th to 21st in Pasadena, California. As the second joint conference between these bodies, the goal of this annual meeting is to strengthen international scientific collaboration in the field of planetary science.

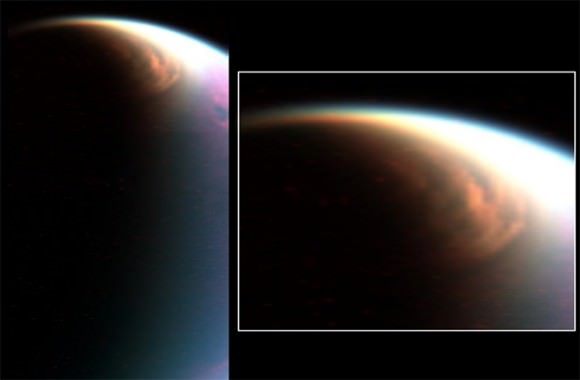
This cloud in the stratosphere over Titan’s north pole (left) is similar to Earth’s polar stratospheric clouds (right). NASA scientists found that Titan’s cloud contains methane ice, which was not previously thought to form in that part of the atmosphere. Cassini first spotted the cloud in 2006. Image Credit: L. NASA/JPL/U. of Ariz./LPGNantes; R. NASA/GSFC/M. Schoeberl
The large cloud in the stratosphere over Titan’s north pole (left) is similar to Earth’s polar stratospheric clouds (right). Credit: L. NASA/JPL/U. of Ariz./LPGNantes; R. NASA/GSFC/M. Schoeberl

During the course of the meeting, Dr. Athena Coustenis – the Director of Research (1st class) with the National Center for Scientific Research (CNRS) in France – shared the latest atmospheric data retrieved by Cassini. As she stated:

“Cassini’s long mission and frequent visits to Titan have allowed us to observe the pattern of seasonal changes on Titan, in exquisite detail, for the first time. We arrived at the northern mid-winter and have now had the opportunity to monitor Titan’s atmospheric response through two full seasons. Since the equinox, where both hemispheres received equal heating from the Sun, we have seen rapid changes.”

Scientists have been aware of seasonal change on Titan for some time. This is characterized by warm gases rising at the summer pole and cold gases settling down at the winter pole, with heat being circulated through the atmosphere from pole to pole. This cycle experiences periodic reversals as the seasons shift from one hemisphere to the other.

In 2009, Cassini observed a large scale reversal immediately after the equinox of that year. This led to a temperature drop of about 40 °C (104 °F) around the southern polar stratosphere, while the northern hemisphere experienced gradual warming. Within months of the equinox, a trace gas vortex appeared over the south pole that showed glowing patches, while a similar feature disappeared from the north pole.

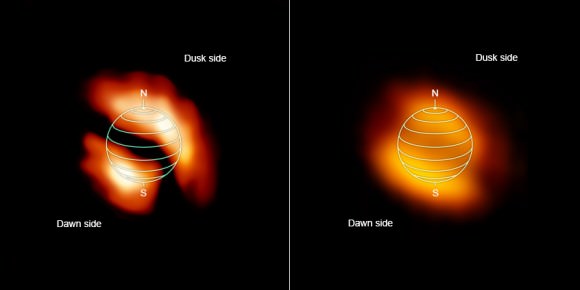
High in the atmosphere of Titan, large patches of two trace gases glow near the north pole, on the dusk side of the moon, and near the south pole, on the dawn side. Brighter colors indicate stronger signals from the two gases, HNC (left) and HC3N (right); red hues indicate less pronounced signals. Image (Credit: NRAO/AUI/NSF)
High in the atmosphere of Titan, large patches of two trace gases glow near the north pole, on the dusk side of the moon, and near the south pole, on the dawn side. Credit: NRAO/AUI/NSF

A reversal like this is significant because it gives astronomers a chance to study Titan’s atmosphere in greater detail. Essentially, the southern polar vortex shows concentrations of trace gases – like complex hydrocarbons, methylacetylne and benzene – which accumulate in the absence of UV light. With winter now upon the southern hemisphere, these gases can be expected to accumulate in abundance.

As Coustenis explained, this is an opportunity for planetary scientists to test out their models for Titan’s atmosphere:

“We’ve had the chance to witness the onset of winter from the beginning and are approaching the peak time for these gas-production processes in the southern hemisphere. We are now looking for new molecules in the atmosphere above Titan’s south polar region that have been predicted by our computer models. Making these detections will help us understand the photochemistry going on.”

Previously, scientists had only been able to observe these gases at high northern latitudes, which persisted well into summer. They were expected to undergo slow photochemical destruction, where exposure to light would break them down depending on their chemical makeup. However, during the past few months, a zone of depleted molecular gas and aerosols has developed at an altitude of between 400 and 500 km across the entire northern hemisphere .

View of Titan's South Pole, showing a vortex. Credit: NASA
Titan’s south polar vortex. Credit: NASA/JPL-Caltech/Space Science Institute

This suggests that, at high altitudes, Titan’s atmosphere has some complex dynamics going on. What these could be is not yet clear, but those who have made the study of Titan’s atmosphere a priority are eager to find out. Between now and the end of Cassini mission (which is slated for Sept. 2017), it is expected that the probe will have provided a complete picture of how Titan’s middle and upper atmospheres behave.

By mission’s end, the Cassini space probe will have conducted more than 100 targeted flybys of Saturn. In so doing, it has effectively witnessed what a full year on Titan looks like, complete with seasonal variability. Not only will this information help us to understand the deeper mysteries of one of the Solar System’s most mysterious moons, it should also come in handy if and when we send astronauts (and maybe even settlers) there someday!

Further Reading: Europlanet

Schiaparelli is Gone. Smashed on the surface of Mars

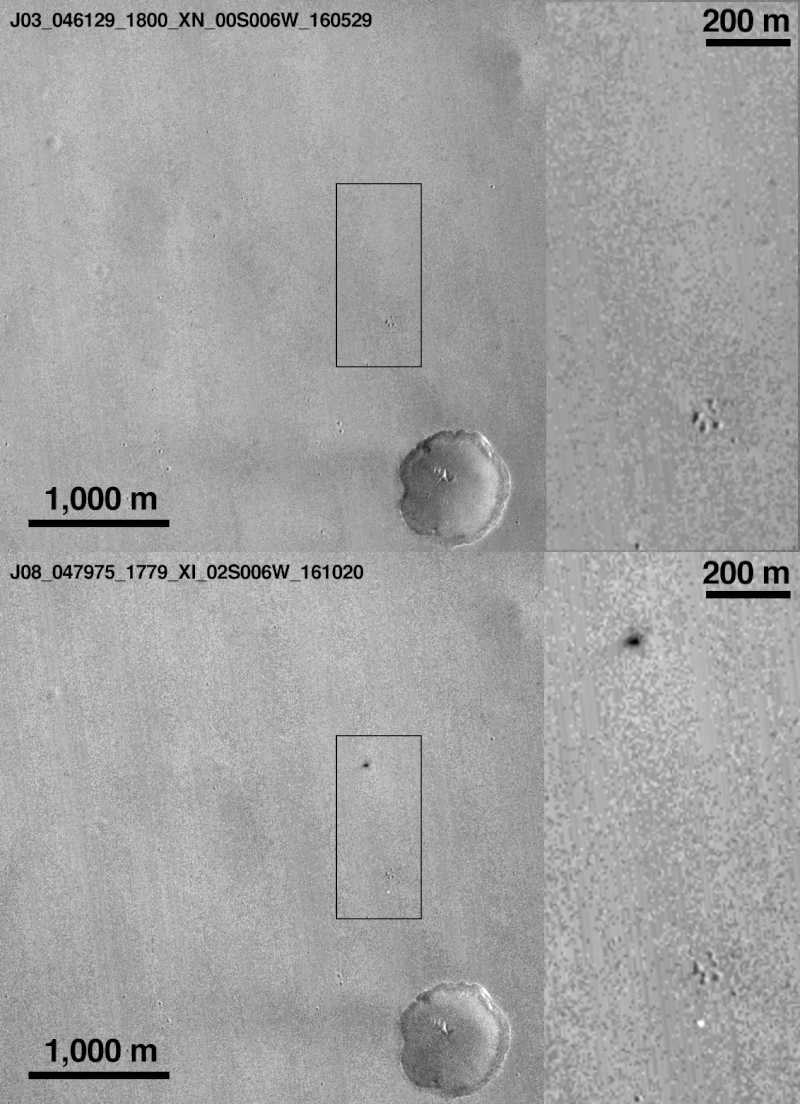
Mars Reconnaissance Orbiter view of Schiaparelli landing site before and after the lander arrived. The images have a resolution of 6 meters per pixel and shows two new features on the surface when compared to an image from the same camera taken in May this year. The black dot appears to be the lander impact site and the smaller white dot below the paw-shaped cluster of craters, the parachute. Credit: NASA

Instead of a controlled descent to the surface using its thrusters, ESA’s Schiaparelli lander hit the ground hard and may very well have exploded on impact.  NASA’s Mars Reconnaissance Orbiter then-and-now photos of the landing site have identified new markings on the surface of the Red Planet that are believed connected to the ill-fated lander.

Schiaparelli entered the martian atmosphere at 10:42 a.m. EDT (14:42 GMT) on October 19 and began a 6-minute descent to the surface, but contact was lost shortly before expected touchdown seconds after the parachute and back cover were discarded. One day later, the Mars Reconnaissance Orbiter took photos of the expected touchdown site as part of a planned imaging run.

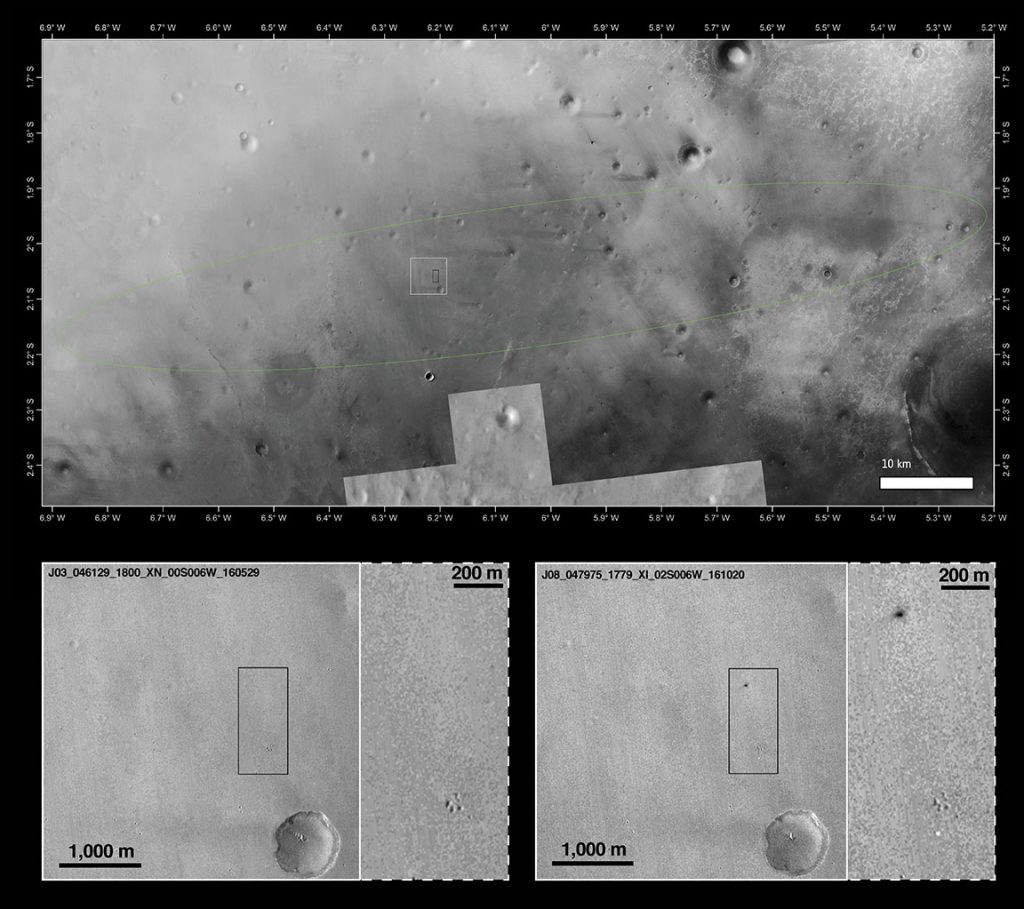
The landing site is shown within the Schiaparelli landing ellipse (top) along with before and after images below. Copyright Main image: NASA/JPL-Caltech/MSSS, Arizona State University; inserts: NASA/JPL-Caltech/MSSS

One of the features is bright and can be associated with the 39-foot-wide (12-meter) diameter parachute used in the second stage of Schiaparelli’s descent. The parachute and the associated back shield were released from Schiaparelli prior to the final phase, during which its nine thrusters should have slowed it to a standstill just above the surface.

The other new feature is a fuzzy dark patch or crater roughly 50 x 130 feet (15 x 40 meters) across and about 0.6 miles (1 km) north of the parachute. It’s believed to be the impact crater created by the Schiaparelli module following a much longer free fall than planned after the thrusters were switched off prematurely.

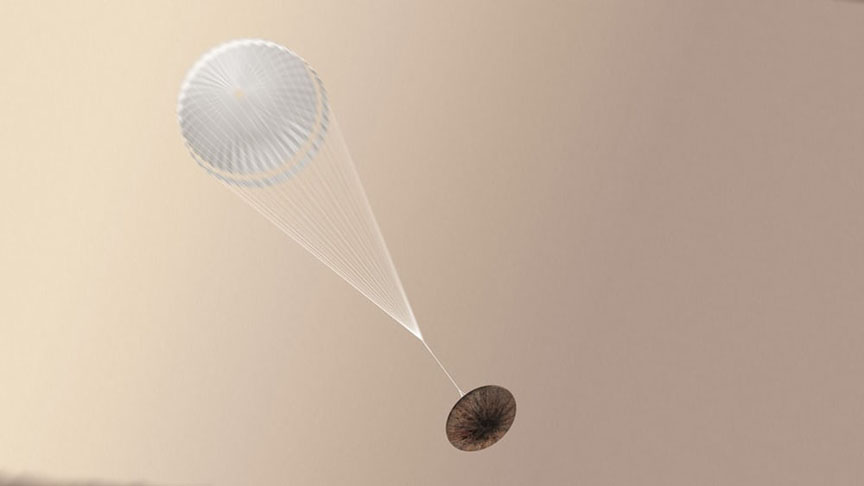
Artist's concept of Schiaparelli deploying its parachute. The parachute may also have played a role in the crash. It may have deployed too soon, causing the thrusters to fire up too soon and run out of fuel. Or the thrusters may have simply cut out after firing. Credit: ESA
Artist’s concept of Schiaparelli deploying its parachute. The parachute may also have played a role in the crash. It may have deployed too soon, causing the thrusters to fire too soon. The thrusters may also have simply cut out too soon after firing. Credit: ESA

Mission control estimates that Schiaparelli dropped from between 1.2 and 2.5 miles (2 and 4 km) altitude, striking the Martian surface at more than 186 miles an hour (300 km/h). The dark spot is either disturbed surface material or it could also be due to the lander exploding on impact, since its thruster propellant tanks were likely still full. ESA cautions that these findings are still preliminary.

Something went wrong with Schiaparelli's one or more sets of thrusters during the descent. Credit: ESA
Something went wrong with Schiaparelli’s one or more sets of thrusters during the descent, causing the lander to crash on the surface at high speed. Credit: ESA

Since the module’s descent trajectory was observed from three different locations, the teams are confident that they will be able to reconstruct the chain of events with great accuracy. Exactly what happened to cause the thrusters to shut down prematurely isn’t yet known.