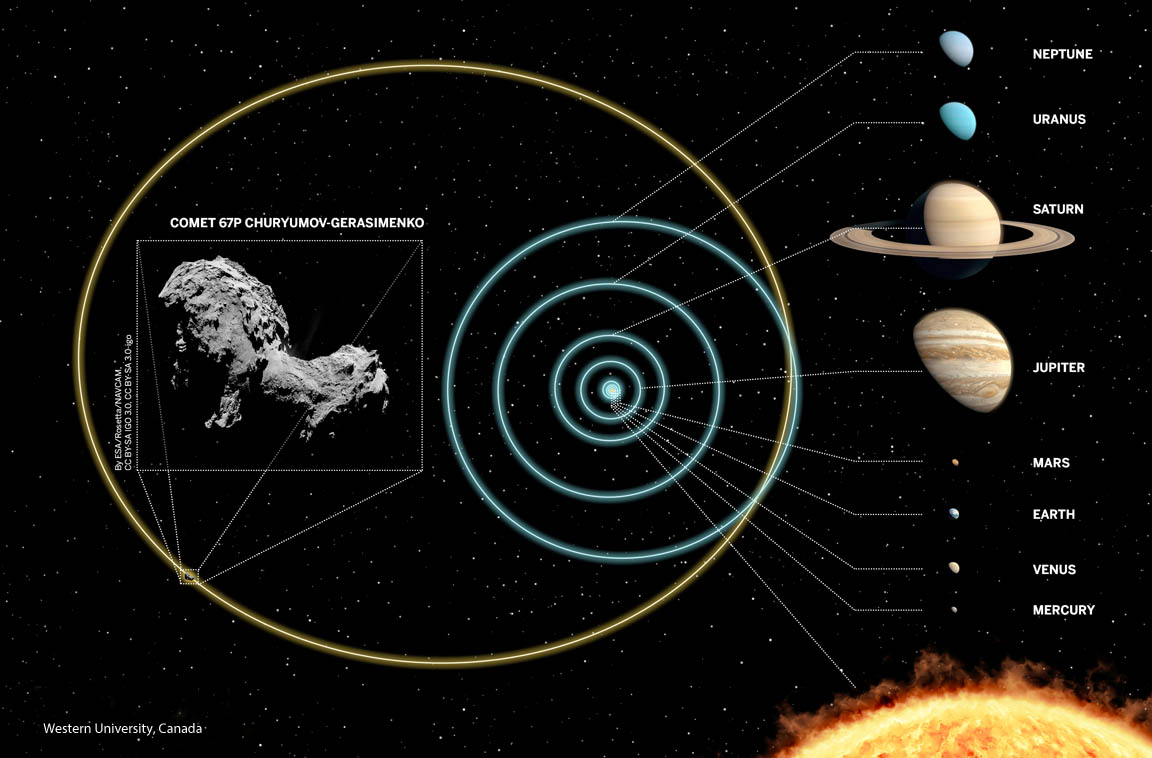
In the distant past, the orbit of 67P/Churyumov-Gerasimenko extended far beyond Neptune into the refrigerated Kuiper Belt. Interactions with the gravitational giant Jupiter altered the comet's orbit over time, dragging it into the inner Solar System. Credit: Western University, Canada
In the distant past, the orbit of 67P/Churyumov-Gerasimenko extended far beyond Neptune into the refrigerated Kuiper Belt. Interactions with the gravitational giant Jupiter altered the comet’s orbit over time, dragging it into the inner Solar System. Credit: Western University, Canada
Rosetta’s Comet hails from a cold, dark place. Using statistical analysis and scientific computing, astronomers at Western University in Canada have charted a path that most likely pinpoints comet 67P/Churyumov-Gerasimenko’s long-ago home in the far reaches of the Kuiper Belt, a vast region beyond Neptune home to icy asteroids and comets.
According to the new research, Rosetta’s Comet is relative newcomer to the inner parts of our Solar System, having only arrived about 10,000 years ago. Prior to that, it spent the last 4.5 billion years in cold storage in a rough-and-tumble region of the Kuiper Belt called the scattered disk.
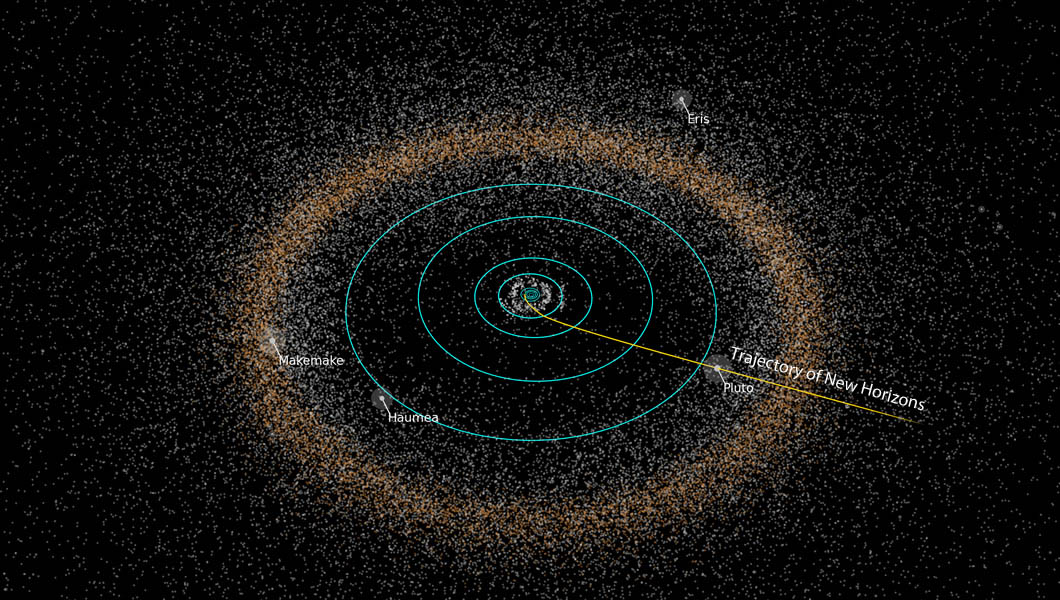
The Kuiper Belt was named in honor of Dutch-American astronomer Gerard Kuiper, who postulated a reservoir of icy bodies beyond Neptune. The first Kuiper Belt object was discovered in 1992. We now know of more than a thousand objects there, and it’s estimated it’s home to more than 100,000 asteroids and comets there over 62 miles (100 km) across. Credit: JHUAPL
In the Solar System’s youth, asteroids that strayed too close to Neptune were scattered by the encounter into the wild blue yonder of the disk. Their orbits still bear the scars of those long-ago encounters: they’re often highly-elongated (shaped like a cigar) and tilted willy-nilly from the ecliptic plane up to 40°. Because their orbits can take them hundreds of Earth-Sun distances into the deeps of space, scattered disk objects are among the coldest places in the Solar System with surface temperatures around 50° above absolute zero. Ices that glommed together to form 67P at its birth are little changed today. Primordial stuff.
Watch how Rosetta’s Comet’s orbit has evolved since the comet’s formation
There are two basic comet groups. Most comets reside in the cavernous Oort Cloud, a roughly spherical-shaped region of space between 10,000 and 100,000 AU (astronomical unit = one Earth-Sun distance) from the Sun. The other major group, the Jupiter-family comets, owes its allegiance to the powerful gravity of the giant planet Jupiter. These comets race around the Sun with periods of less than 20 years. It’s thought they originate from collisions betwixt rocky-icy asteroids in the Kuiper Belt.
Fragments flung from the collisions are perturbed by Neptune into long, cigar-shaped orbits that bring them near Jupiter, which ropes them like calves with its insatiable gravity and re-settles them into short-period orbits.
Comet 67P/Churyumov-Gerasimenko is a Jupiter-family comet. Its 6.5 year journey around the Sun takes it from just beyond the orbit of Jupiter at its most distant to between the orbits of Earth and Mars at its closest. Credit: ESA with labels by the author
Mattia Galiazzo and solar system expert Paul Wiegert, both at Western University, showed that in transit, Rosetta’s Comet likely spent millions of years in the scattered disk at about twice the distance of Neptune. The fact that it’s now a Jupiter family comet hints of a possible long-ago collision followed by gravitational interactions with Neptune and Jupiter before finally becoming an inner Solar System homebody going around the Sun every 6.45 years.
By such long paths do we arrive at our present circumstances.
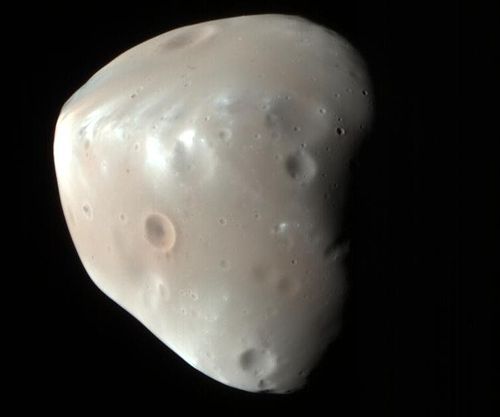
Image of the Martian Moon of Deimos, as imaged by the Mars Reconnaissance Orbiter. Credit: HiRISE/MRO/LPL (U. Arizona)/NASA
Mars and Earth have several things in common. Like Earth, Mars is a terrestrial planet (i.e. composed of silicate rock and minerals). It also has polar ice caps, a tilted axis, and evidence of liquid water on its surface. On top of that, Mars and Earth are the only terrestrial planets in the Solar System to have natural satellites.
In fact, Mars has two satellites, which are appropriately named Phobos and Deimos (named after the Greek gods of horror and terror, respectively). Of the two, Deimos is the smaller moon and orbits at a greater distance from the planet. And like Deimos, it has the characteristics of an asteroid, which is a strong indication of where it may have come from.
Discovery and Naming:
Deimos was discovered in 1877 by American astronomer Asaph Hall, who was deliberately searching for Martian moons at the United States Naval Observatory (USNO). Its name was suggested shortly thereafter by Henry Madan, the Science Master of Eton College, and was derived from Homer’s The Iliad.
Phobos and Deimos, photographed by the Mars Reconnaissance Orbiter. Credit: NASA/JPL
Size, Mass and Orbit:
Deimos has a mean radius of between 6 and 6.38 km (3.73 – 3.96 mi). However, the moon is not a round body, and measures roughly 15 × 12.2 × 11 km (9.32 x 7.58 x 6.835 mi), making it 0.56 times the size of Phobos. At 1.4762 × 10¹⁵ kg, or 1.4762 trillion metric tons, Deimos is 1/49,735,808 times as massive as the Moon. As a result, Deimos’ surface gravity is very weak, just 0.003 m/s – or 0.000306 g.
Deimos’ orbit is nearly circular, ranging from 23455.5 km at periapsis (closest) to 23470.9 km at apoapsis (farthest) – which works out to an average distance (semi-major axis) of 23,463.2 km. With an average orbital speed of 1.3513 km/s, it takes 30 hours, 18 minutes and 43.2 seconds to complete a single orbit (or 1.263 days).
Composition and Surface Features:
Deimos, like Phobos, is similar in composition to carbonaceous chondrite and silicate/carbon-rich (C- and D-type) asteroids. Though the surface is cratered, it is considerably smoother than Phobos’ surface, which is due to its craters being filled with regolith.
Only two geological features on Deimos have been given names – the craters of Voltaire and Swift. These features take their names from the famous 17th/18th century French and English writers who speculated about the existence of two Martian moons before they were even discovered.
Image of Deimos captured by HiRISE, showing the craters of Voltaire and Swift in the upper left corner. Credit: NASA/JPL/University of Arizona
Origin:
The origin of Mars’ moons remains unknown, but some hypotheses exist. The most widely-accepted theory states that, based on their similarity to C- or D-type asteroids, they are objects that were kicked out of the Asteroid Belt by Jupiter’s gravity. They were then captured by Mars’ and fell into their current orbits due to atmospheric drag or tidal forces.
However, this theory remains controversial since Mars’ current atmosphere is too thin. As such, it is highly unlikely that it would have been able to cause enough drag to slow either moon down enough for them to have achieved their current orbits. A modified version of this hypothesis is that Phobos and Deimos were once a binary asteroid, which was then captured and separated by tidal forces.
Other popular hypotheses include that they were formed by accretion in their current orbits, or that Mars was once surrounded by many large asteroids which were ejected into orbit it after a collision with a planetesimal – like the one that formed Earth’s Moon. Over time, these would have fallen back to the surface until only Phobos and Deimos remained.
Exploration:
Overall, Deimos history of exploration is tied to that of Mars and Phobos. While no landings have been made on its surface, several have been proposed in the past. The first of these were made as part of the Soviet Phobos (Fobos) program, which involved two probes – Fobos 1 and 2 – that were launched in July of 1988.
If the first proved successful in landing on Phobos, the second would been diverted to make a landing on Deimos. However, the first probe was lost en route to Mars while the second managed to returned some data and images of Phobos surface before contact was lost.
In 1997-1998, NASA selected the proposed Aladdin mission as a finalist for its Discovery Program. The plan was to visit both Phobos and Deimos with sample return missions involving an orbiter and lander. After reaching the surface, the landers would collect samples and then launch them back to the orbiters (which would return them to Earth). However, the mission was passed over in favor of the MESSENGER probe, which was sent to study Mercury.
Other missions have been proposed with are still under study. These include the “Hall” concept proposed in 2008, which calls for a probe that relies on solar-electric propulsion (SEP) to reach Mars and return with samples to Earth. Another was the Gulliver mission, a concept proposed in 2010 which would attempt to retrieve 1 kg (2.2 lbs) of material from Deimos’ surface.
The planners behind the OSIRIS-REx mission have also proposed mounting a second mission that would return samples from Phobos and Deimos. And at the 2014 Lunar and Planetary Science Conference, a proposal was made for a low-cost mission based on the Lunar Atmosphere Dust and Environment Explorer. It is named the Phobos and Deimos & Mars Environment(PADME) mission, and would involve an orbiter being sent to Mars by 2021.
Deimos has been photographed from the surface of Mars by both the Opportunity and Curiosity rovers. And someday, actual astronauts may be able to look up at it from the Martian surface. From their point of view, Deimos would appear like a star to the unaided eye. At its brightest, it might look like Venus does from here on Earth.
For those watching over an extended period of time, Deimos would pass directly in front of the Sun quite regularly. It’s too small to cause a total eclipse, it would look like a black dot moving across the face of the Sun.
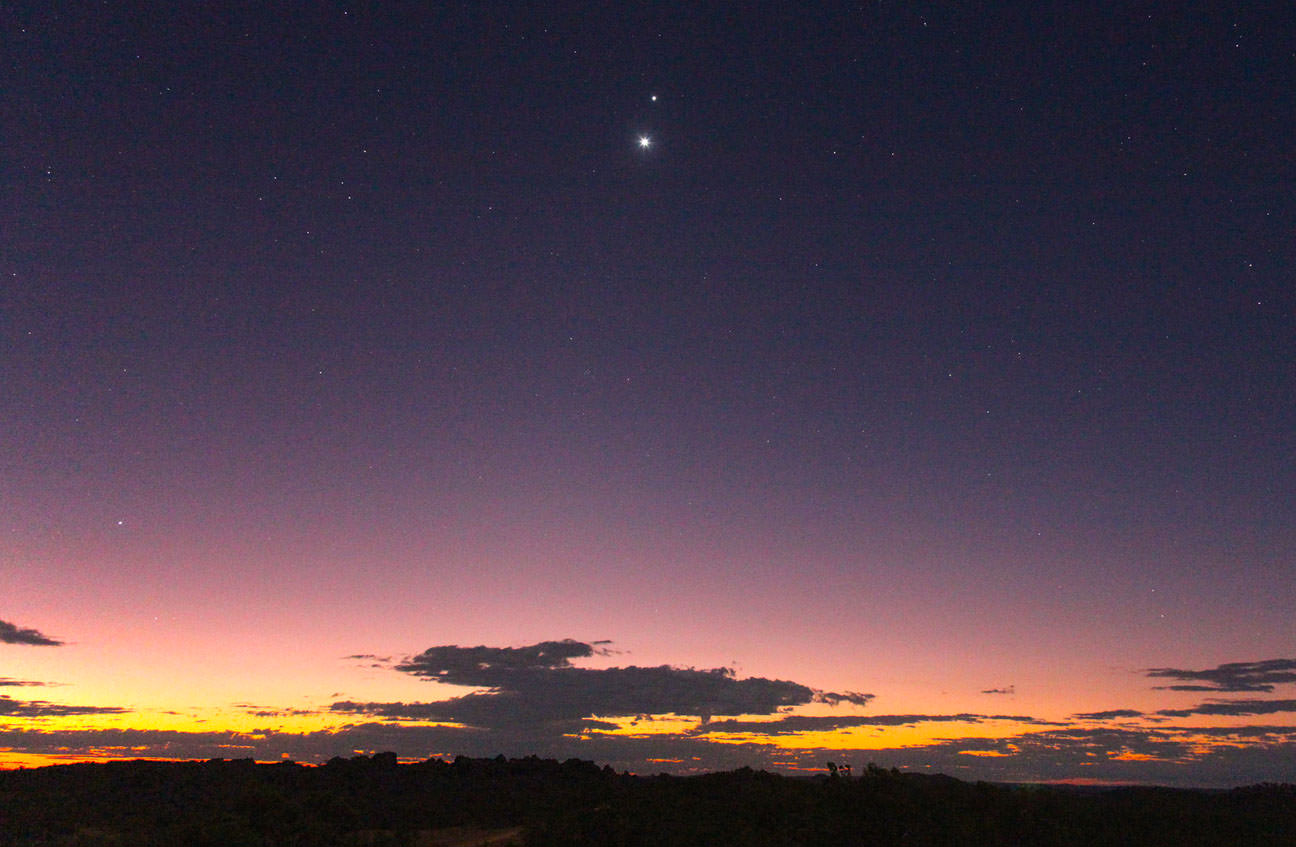
Venus and Jupiter at dusk over Australia's Outback on June 27, 2015. Credit: Joseph Brimacombe
The internet is great, isn’t it?
You can post anything you want on the internet, and if people like the sound of it, they spread it. It doesn’t make any difference if it’s true or not. We’re not born fact checkers and skeptics, are we?
Pretty soon, before you know it, it’s gone viral. Then it becomes its own sensation, and people who don’t even believe it start reporting it. Never is this more true than with hoaxes.
The latest hoax is the “15 Days of Darkness in November” thing that’s going around. Everyone’s on the bandwagon.
The 15 days hoax is not new. It made an appearance last year, and was thoroughly debunked. And of course, there wasn’t 15 day of darkness last year, was there? (Unless NASA covered it up!)
It’s here again this year, and will be debunked again, and will probably be here next year, too.
The whole thing started at a site that will remain linkless, and caught on from there. This is what the site reported:
“NASA has confirmed that the Earth will experience 15 days of total darkness between November 15 and November 29, 2015. The event, according to NASA, hasn’t occurred in over 1 Million years.”
Of course, NASA never said any such thing.
Here is supposedly what will happen to cause this calamity. Try and follow along with the nonsensical foolishness.
During the conjunction between Venus and Jupiter on October 26, light from Venus would cause gases in Jupiter to heat up. The heated gasses will cause a large amount of hydrogen to be released into space. The gases will reach the Sun and trigger a massive explosion on the surface of the star, heating it to 9,000 degrees Kelvin. The heat of the explosion would then cause the Sun to emit a blue color.
The dull blue color will last for 15 days during which the Earth will be thrown into darkness.
Where to begin? Let’s start with conjunctions.
Conjunctions are mostly just visual phenomena. The fact that two things in the sky look closer together from our point of view on Earth doesn’t mean that they’re that close together. In fact, even when Jupiter and Venus are in conjunction, they can still be over 800 million km apart. For perspective, the Sun and the Earth are about 150 million km apart.
So, as the hoax goes, at that great distance, light from Venus will cause gases on Jupiter to heat up. News Flash: the light from the Sun is far more intense than light from Venus could ever be, and it doesn’t heat up the gases on Jupiter. In fact, any light from Venus that makes it to Jupiter is just reflected sunlight anyway.
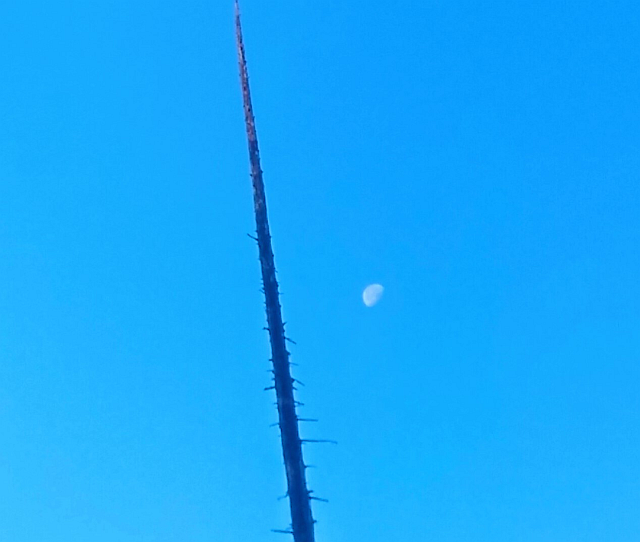
The Moon and this dead tree are in conjunction. This will cause the Martian Pyramids to vibrate harmonically. These vibrations will shake the walls of the movie studio where the Moon landing was faked, causing it to collapse. Image: Evan Gough
The hoax gets more outrageous as it goes along. These supposed heated gases then escape from Jupiter into space, and head for the Sun. But Jupiter is enormous and has enormous gravitational pull. How are any gases going to escape Jupiter’s overpowering gravity? Answer: they can’t and they won’t.
Then, these gases supposedly strike the Sun, and trigger a massive explosion on the Sun’s surface, which turn the Sun blue and plunges the Earth into darkness. Not blueness, which I could understand, but darkness.
This is absurd, of course. The Sun dominates the planets in a one-way relationship, and nothing the planets ever do could change that. No escaped gases from Jupiter would ever strike the Sun.
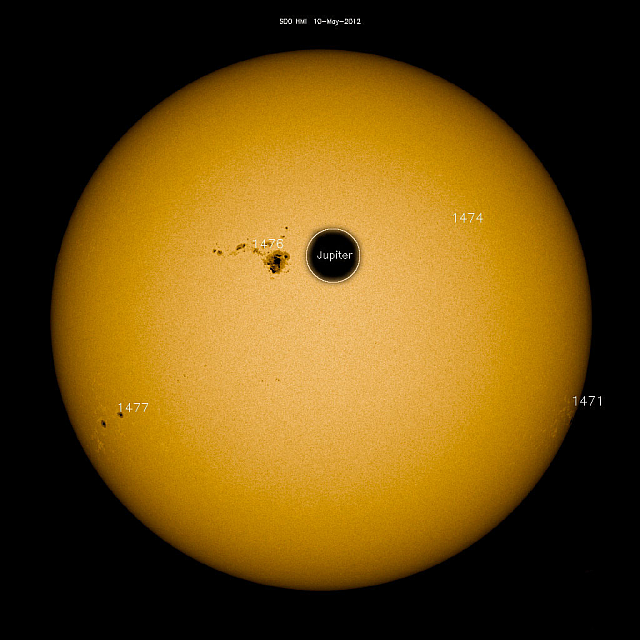
Jupiter is puny and insignificant compared to the Sun. And it’s also hundreds of millions of kilometers away. How is a puny puff of hydrogen from Jupiter supposed to darken the Sun? Image: NASA/SDO
Nothing Jupiter does can affect the Sun. Jupiter is, on average, 778 million km from the Sun. Jupiter could change places with Venus, and the Sun would keep shining normally. Jupiter could explode completely and the Sun would go on shining normally. Jupiter could put on a big red nose and some clown shoes, and the Sun would remain unaffected.
The Sun is a giant atom-crushing machine 1000 times more massive than Jupiter. The massive wall of energy and solar wind that comes from the Sun slams into Jupiter, and completely overwhelms anything Jupiter can do to the Sun. It’s just the way it is. It’s just the way it will always be.
Like the faked Moon landing hoax, and the Nibiru/Planet X hoax, this 15 days of darkness meme just keeps coming around. There may be no end to it.
It’s annoying, for sure, but maybe there’s a silver lining. Maybe some people reading about this supposed calamity will enter the word “conjunction” into a search engine, and begin their own personal journey of learning how the universe works.
Artist's concept of Antimatter propulsion system. Credit: NASA/MFSC
When it comes to the future of space exploration, one of the biggest questions is, “how and when will we travel to the nearest star?” And while space agencies have been pondering this question and coming up with proposals for decades, none of them have advanced beyond the theory stage. For the most part, their efforts has been focused on possible missions to Mars and the outer Solar System.
But there are some people, like Dr. Gerald Jackson, who are working towards making an interstellar mission possible in the near future. He and his research team, which have been funded by NASA in the past, are looking to create an antimatter engine that will be capable of reaching (or exceeding) 5% the speed of light. Towards this end, they have launched a Kickstarter campaign to fund their efforts.
As advanced propulsion concepts go, antimatter has quite a lot going for it. As propulsion goes, it has the highest specific energy of any known method, 100 times more than fission/fusion reactions, and 10 billion times more than chemical propellants. It is also the most fuel-efficient, requiring mere milligrams of antimatter to produce the same amount of energy as tons of chemical fuel.
Typically, this theoretical concept relies on the collision between hydrogen and antihydrogen (which have the same mass but opposite charge) to generate thrust. This process unleashes energy and a shower of particles (pions and muons), which can be channeled by a magnetic nozzle to generate thrust.
And while laboratories like CERN have been producing antimatter, and research is being conducted on large-scale storage, no propulsion systems exist that could turn antimatter into thrust. Dr. Jackson, a graduate of Cornell University, is hoping to change that. Before entering the private sector, Jackson worked as an accelerator physicist at the Fermi National Accelerator Laboratory for 14 years.
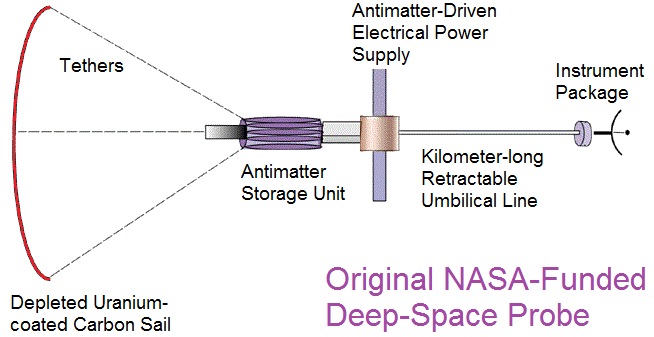
In 2002, he co-founded a limited-liability company (HBar Technologies) for the sake of developing commercial markets for antimatter. In 2002, NASA’s Institute for Advanced Concepts (NIAC) awarded Dr. Jackson and his company $75,000 to develop a mission concept that could traverse 250 AUs of space within 10 years time, and with a fuel supply of 10 kg.
These specifications essentially called for the creation of an antimatter rocket that could travel as far as the heliopause within a decade’s time. The result was a propulsion concept that relied on a beam that would fire focused antiprotons onto a sail to generate propulsion. This sail would measure 5 meters in diameter and be composed of a carbon backing on one side and uranium foil on the other (measuring 15 and 296 microns thick, respectively).
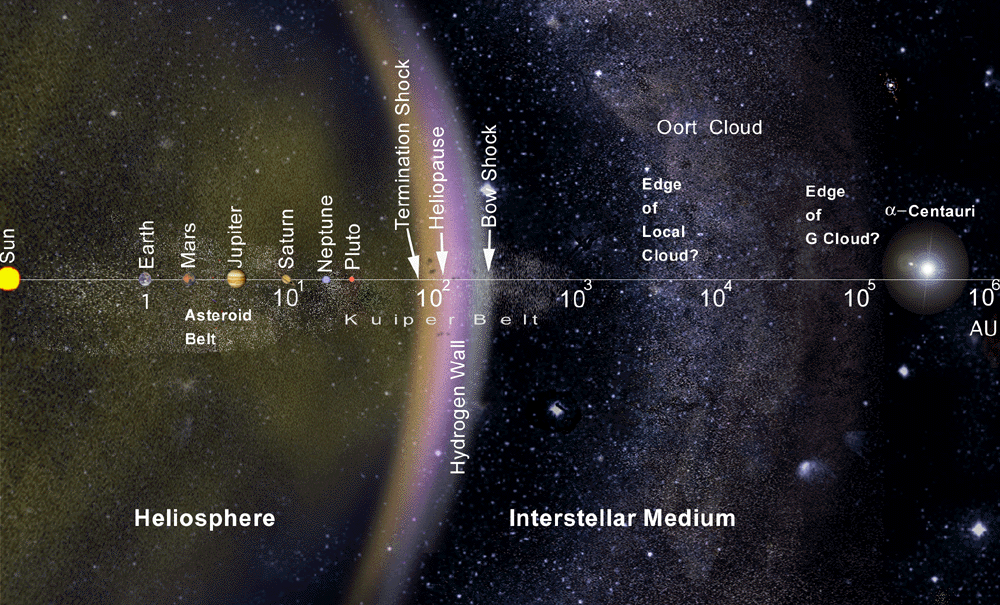
Illustration of the solar system and its nearby galactic neighborhood on a logarithmic scale extending (from < 1 to) 1 million AU. Credit: NASA/JPL
When a pulse of antiprotons is annihilated against a small section of the uranium side, the resulting fission causes momentum. As Dr. Jackson explained to Universe Today via email:
“Note that antiprotons have a negative electrical charge, similar to an electron. When the antiprotons enter the sail, they displace an electron orbiting an uranium nucleus. Because antiprotons and electrons do not share any quantum numbers, the antiproton immediately cascades down into the atomic ground state, causing a high probability of interaction between the antiproton and either a proton or neutron within the nucleus.
“On average, a fission event results in the creation of two daughter nuclei of roughly equal mass. These daughters travel in opposite directions with a kinetic energy of 1 MeV per proton or neutron. Because the daughters are charged, the one travelling further into the sail is absorbed and transfers is forward momentum. The other daughter flies into space with an exhaust velocity of 4.6% of lightspeed. This selective transfer of momentum is thrust.”
Unfortunately, due to the budget environment of the time, the NIAC was forced to cancel its funding after a second round had been granted. Because of this, Dr. Jackson and his colleagues are now seeking public support so that they may finish their work on the experimental sail and prepare it for exposure to an antiproton beam.
Diagram showing Hbar’s concept for a antimatter-driven propulsion system. Credit: antimatterdrive.org
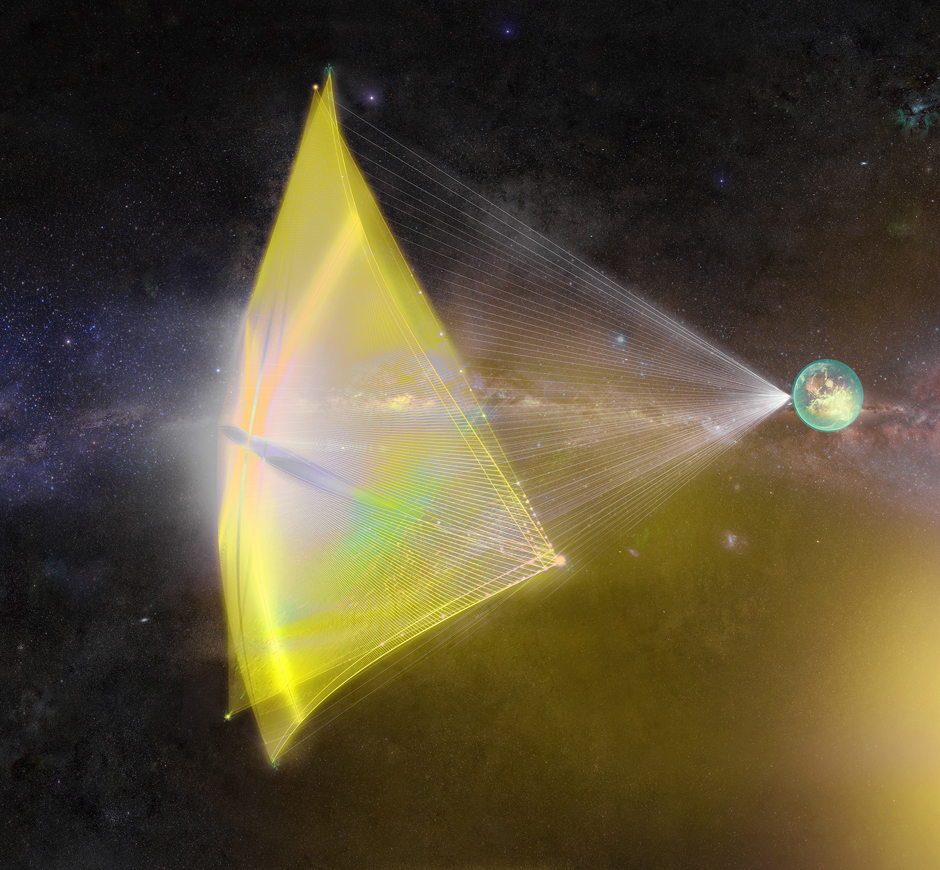
Much like Project Starshot (whom they acknowledge on their campaign page), Jackson and his team are looking to produce an interstellar mission proposal that does not involve shortcuts (i.e. warp drive, wormholes, star gates, etc.). Starshot, as you may recall, calls for a wafer craft and a laser-driven lightsail that would be capable of reaching speeds of up to 20% the speed of light, thus making the journey to Alpha Centauri in 20 years.
In the same vein, a antiproton-driven sail that could reach speeds of 5% the speed of light or more would be capable of making it to Alpha Centauri (or Proxima Centauri) in about 90 years time. All the while, the science behind it would remain within the realm of established physics, being consistent with Newton’s Laws of Motion and Einstein’s Theory of Special Relativity.
“The revolutionary aspect of the antimatter-driven sail is that the antimatter is not the fuel, but rather the spark plug that initiates fission reactions,” said Jackson. “Because the fission reactions can produce thrust without heavy shielding or other structures, the mass of the propulsion system can be comparable to the mass of the instrument package.”
Project Starshot, an initiative sponsored by the Breakthrough Foundation, is another concept for making humanity’s first interstellar voyage. Credit: breakthroughinitiatives.org
To see their project through, Jackson and his colleagues are hoping to raise $200,000. Should they prove successful, they hope to mount follow-up campaigns to finance a series of validation experiments, storage demonstrations, and mission details. In the end, their goal is nothing less than making antimatter propulsion a reality, which they hope will one day lead interstellar mission.
“We expect that these campaigns will provide the data needed to convince people to fund full scale antimatter production and an actual mission to a nearby solar system,” Jackson added. “The goal of those early interstellar missions is to provide information about these other solar systems, such as whether they are habitable or inhabited. If the latter, we will want to study or interact with those life forms in follow-on missions. If habitable and not inhabited, we need sufficient information to assure the success of a manned migratory mission.”
As of the penning of this article, Jackson and his colleagues have raised $672 of their $200,000 goal. However, the campaign launched only a few days ago and will remain open for another 25 days. For those interesting in following their progress, or have an interest in donating to their cause, check out the links below.
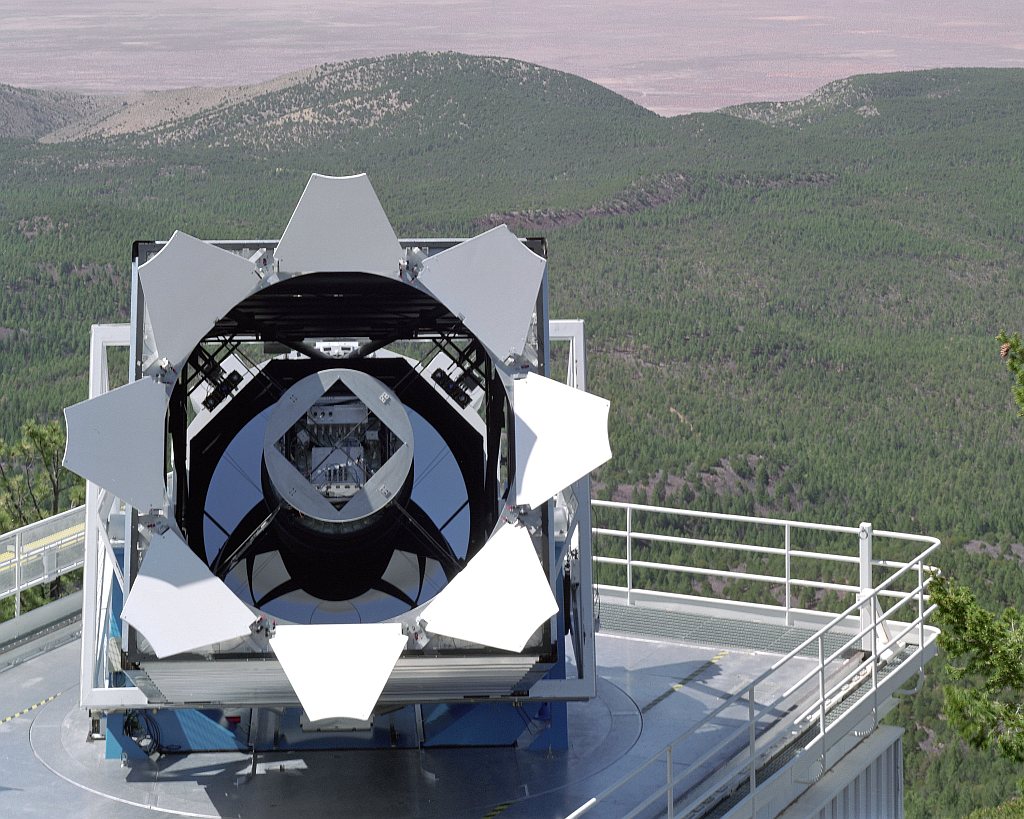
The Sloan Digital Sky Survey telescope stands out against the breaktaking backdrop of the Sacramento Mountains. 234 stars out of the Sloan's catalogue of over 2.5 million stars are producing an unexplained pulsed signal. Image: SDSS, Fermilab Visual Media Services
We all want there to be aliens. Green ones, pink ones, brown ones, Greys. Or maybe Vulcans, Klingons, even a being of pure energy. Any type will do.
That’s why whenever a mysterious signal or energetic fluctuation arrives from somewhere in the cosmos and hits one of our many telescopes, headlines erupt across the media: “Have We Finally Detected An Alien Signal?” or “Have Astronomers Discovered An Alien Megastructure?” But science-minded people know that we’re probably getting ahead of ourselves.
Skepticism still rules the day when it comes to these headlines, and the events that spawn them. That’s the way it should be, because we’ve always found a more prosaic reason for whatever signal from space we’re talking about. But, being skeptical is a balancing act; it doesn’t mean being dismissive.
What we’re talking about here is a new study from E.F. Borra and E. Trottier, two astronomers at Laval University in Canada. Their study, titled “Discovery of peculiar periodic spectral modulations in a small fraction of solar type stars” was just published at arXiv.org. ArXiv.org is a pre-print website, so the paper itself hasn’t been peer reviewed yet. But it is generating interest.
The two astronomers used data from the Sloan Digital Sky Survey, and analyzed the spectra of 2.5 million stars. Of all those stars, they found 234 stars that are producing a puzzling signal. That’s only a tiny percentage. And, they say, these signals “have exactly the shape of an ETI signal” that was predicted in a previous study by Borra.
A portion of the 234 stars that are sources of the pulsed ETI-like signal. Note that all the stars are in the narrow spectral range F2 to K1, very similar to our own Sun. Image: Ermanno F. Borra and Eric Trottier
Prediction is a key part of the scientific method. If you develop a theory, your theory looks better and better the more you can use it to correctly predict some future events based on it. Look how many times Einstein’s predictions based on Relativity have been proven correct.
The 234 stars in Borra and Trottier’s study aren’t random. They’re “overwhelmingly in the F2 to K1 spectral range” according to the abstract. That’s significant because this is a small range centred around the spectrum of our own Sun. And our own Sun is the only one we know of that has an intelligent species living near it. If ours does, maybe others do too?
The authors acknowledge five potential causes of their findings: instrumental and data reduction effects, rotational transitions in molecules, the Fourier transform of spectral lines, rapid pulsations, and finally the ETI signal predicted by Borra (2012). They dismiss molecules or pulsations as causes, and they deem it highly unlikely that the signals are caused by the Fourier analysis itself. This leaves two possible sources for the detected signals. Either they’re a result of the Sloan instrument itself and the data reduction, or they are in fact a signal from extra-terrestrial intelligences.
This graph shows the number of detected signals by Spectral Type of star. Image: Ermanno F. Borra and Eric Trottier
The detected signals are pulses of light separated by a constant time interval. These types of signals were predicted by Borra in his 2012 paper, and they are what he and Trottier set out to find in the Sloan data. It may be a bit of a red flag when scientist’s find the very thing they predicted they would find. But Trottier and Borra are circumspect about their own results.
As the authors say in their paper, “Although unlikely, there is also a possibility that the signals are due to highly peculiar chemical compositions in a small fraction of galactic halo stars.” It may be unlikely, but lots of discoveries seem unlikely at first. Maybe there is a tiny subset of stars with chemical peculiarities that make them act in this way.
To sum it all up, the two astronomers have found a tiny number of stars, very similar to our own Sun, that seem to be the source of pulsed signals. These signals are the same as predicted if a technological society was using powerful lasers to communicate with distant stars.
We all want there to be aliens, and maybe the first sign of them will be pulsed light signals from stars like our own Sun. But it’s all still very preliminary, and as the authors acknowledge, “…at this stage, this hypothesis needs to be confirmed with further work.”
The Breakthrough team don’t seem that excited about Borra’s findings. They’ve already poured cold water on it, trotting out the old axiom that “Extraordinary claims require extraordinary evidence” in a statement on Borra’s paper. They also give Borra’s findings a score of 0 to 1 on the Rio Scale. The Rio Scale is something used by the international SETI community to rank detections of phenomena that could indicate advanced life beyond Earth. A rating of 0 to 1 means its insignificant.
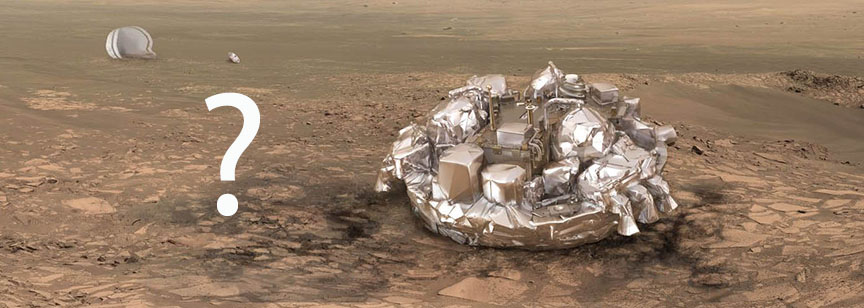
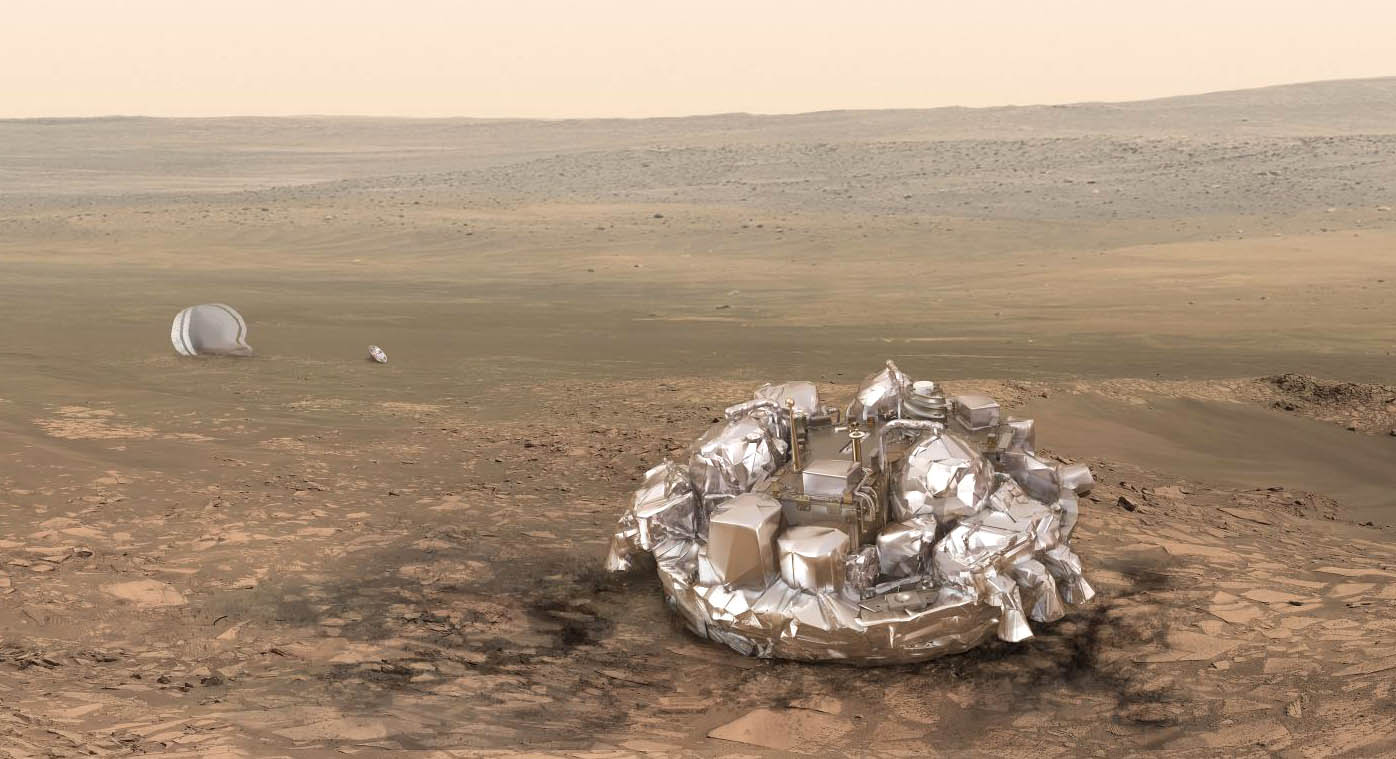
This artist's view shows the European Space Agency's Schiaparelli lander on Mars. It's unclear whether the landing was successful. Signals were received during its descent but then suddenly cut off. Mission control is working on the data now and will have an update on the status of the probe tomorrow morning Oct. 20. Credit: ESA/ATG medialab
This artist’s view shows the European Space Agency’s Schiaparelli lander on Mars. It’s unclear whether the landing was successful. Signals were received during its descent but then suddenly cut off. Mission control is working on the data now and will have an update on the status of the probe tomorrow morning Oct. 20. Credit: ESA/ATG medialab
Good news and bad news. First the good. After a seven-month and 300 million mile (483 million km) journey, the Trace Gas Orbiter (TGO) successfully achieved orbit around Mars today. A signal spike appeared out of the noise about 12:35 p.m. EDT to great applause and high-fives at ESA’s European Space Operations Center in Darmstadt, Germany.
Joy in the control room when the signal from the Trace Gas Orbiter was received this morning, signaling that the spacecraft had achieved orbit around Mars. Credit: ESA Livestream
Two hours later, news of the lander arrived. Not so good but to be fair, it’s still too early to tell. Schiaparelli broadcast a signal during its descent to the Red Planet that was received here on Earth and by the orbiting Mars Express. All well and good. But then mid-transmission, the signal cut out.
Paolo Ferri, head of ESA’s mission operations department, called the news “not good signs” but promised that his team would be analyzing the data through the night to determine the status of the lander. Their findings will be shared around mid-morning Friday Central European Time (around 5 a.m. EDT).
Three days ago, Schiaparelli separated from the orbiter and began a three-day coast to Mars. It entered the atmosphere today at an altitude of 76 miles (122 km) and speed of 13,049 mph (21,000 km/hr), protected from the hellish heat of re-entry by an aerodynamic heat shield.
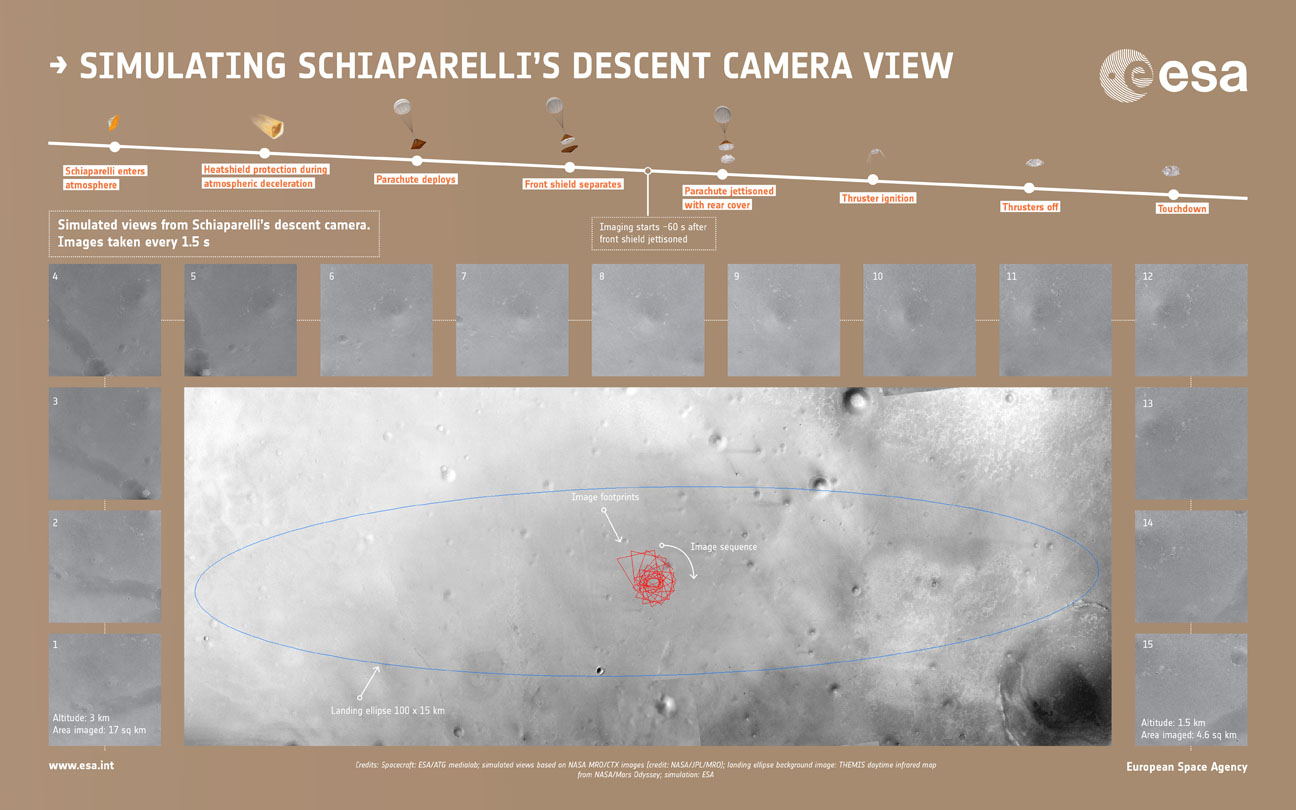
Simulated sequence of the 15 images that the descent camera Schiaparelli module should have taken during its descent to Mars this morning. In the simulated images shown here, the first was made from 3 km up. The camera had planned to take images every 1.5 seconds with the final image in this at ~1.5 km. Depending on Schiaparelli’s actual descent speed, the final image may have been snapped closer to the surface. The views were generated from images taken by NASA’s Mars Reconnaissance Orbiter of the center of Schiaparelli’s landing ellipse, and represent the views expected at each altitude. Copyright spacecraft: ESA/ATG medialab; simulated views from NASA images (credit: NASA/JPL/MRO); landing ellipse background image: Mars Odyssey; simulation: ESA
If all went well, at 6.8 miles (11 km) altitude, it would have deployed its parachute and moments later, dropped the heat shield. At 0.7 miles (1.2 km) above the surface, the lander would have jettisoned the chute and rear protective cover and fired its nine retrorockets while plummeting to the surface at 155 mph (255 mph). 29 seconds later, the thrusters would have shut off with Schiaparelli dropping the remaining 6.5 feet (2 meters) to the ground. Total elapsed time: just under 6 minutes.
For now, have hope. Given that Schiaparelli was primarily a test of landing technologies for future Mars missions, whatever happened, everything we learn from this unexpected turn of events will be invaluable. You can continue to follow updates on ESA’s Livestream.
** Update Oct. 20: It appears that the thrusters on Schiaparelli may have cut out too soon, causing the lander to drop from a higher altitude. In addition, the ejection of the parachute and back heat shield may have happened earlier than expected.
This from ESA:
“The data have been partially analyzed and confirm that the entry and descent stages occurred as expected, with events diverging from what was expected after the ejection of the back heat shield and parachute. This ejection itself appears to have occurred earlier than expected, but analysis is not yet complete.
The thrusters were confirmed to have been briefly activated although it seems likely that they switched off sooner than expected, at an altitude that is still to be determined.”
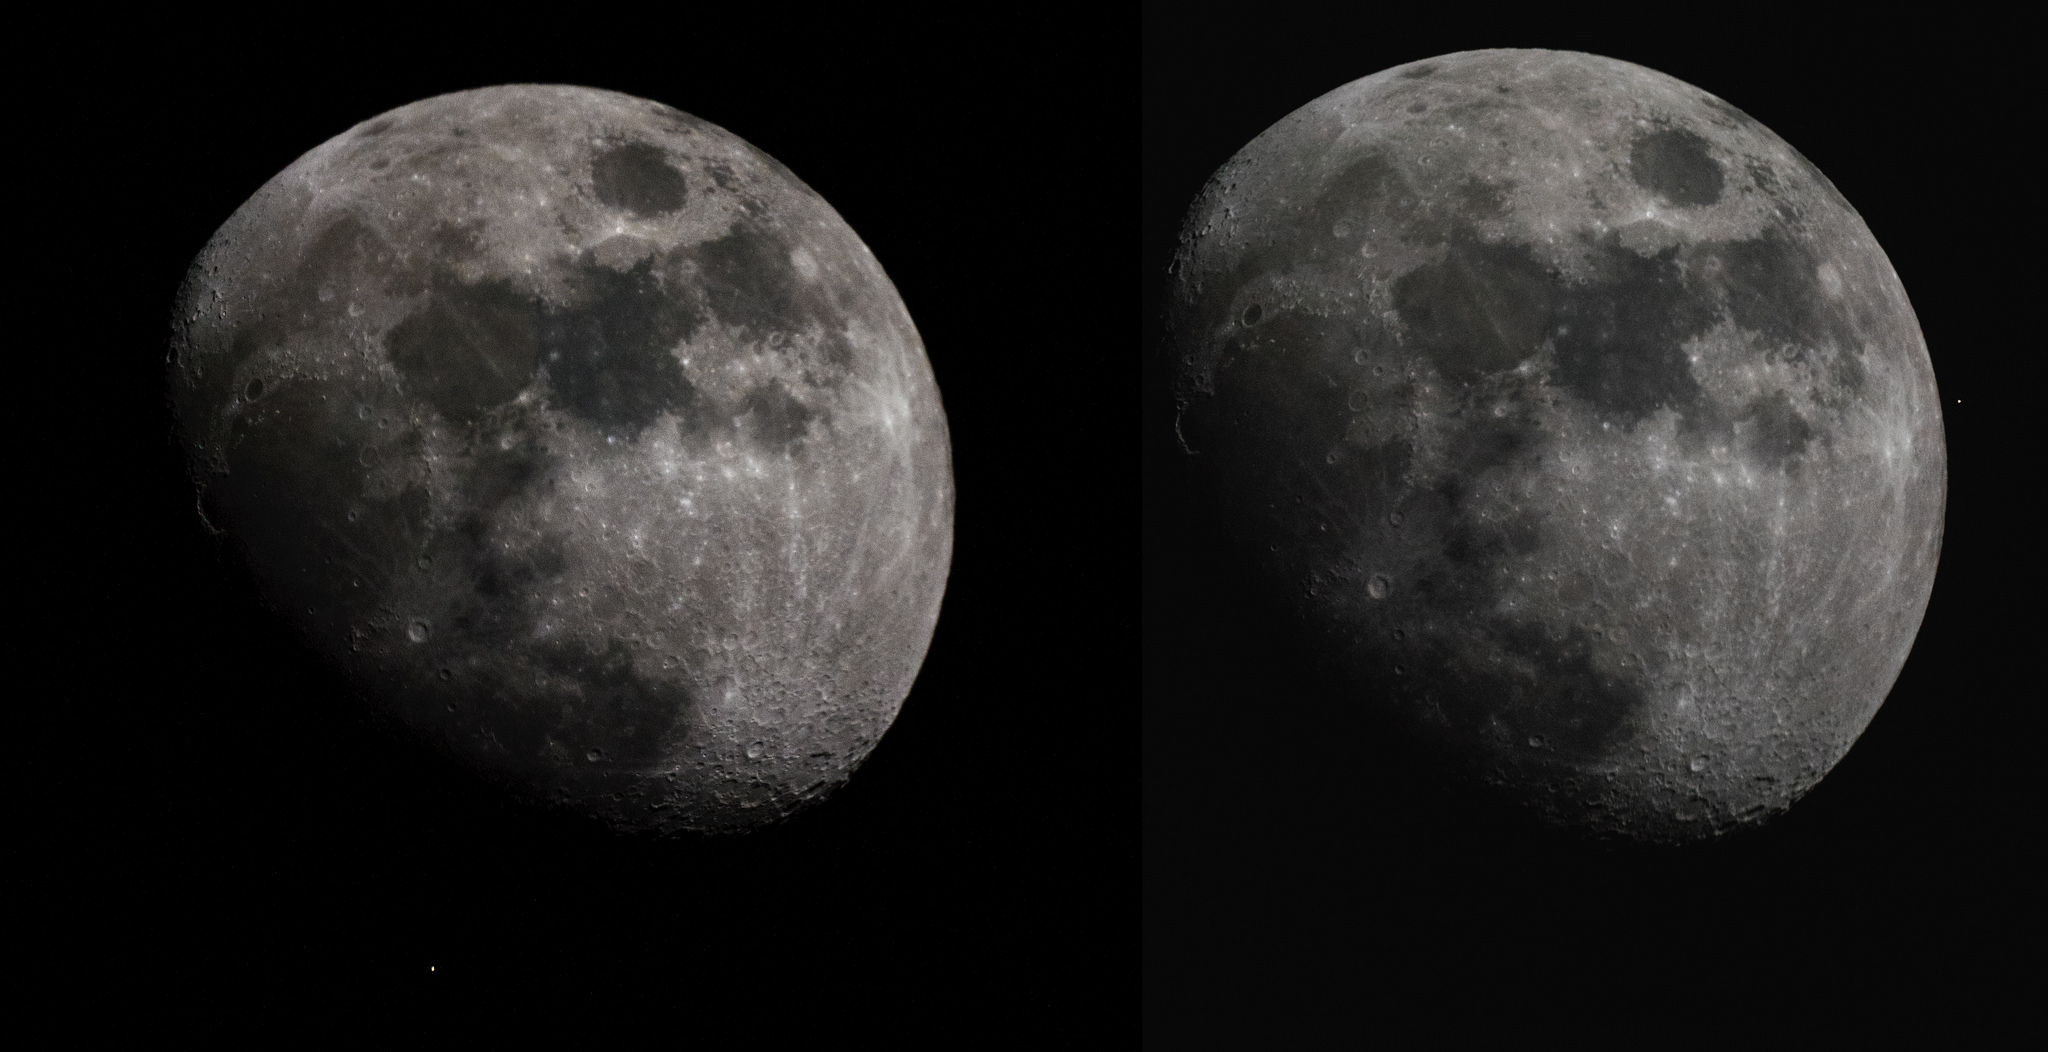
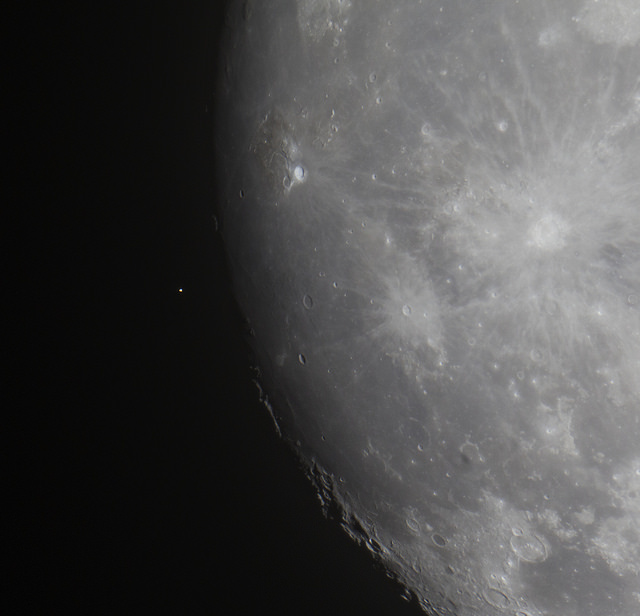
An occultation of Aldebaran by the Moon: before and after. Image credit and copyright: Eliot Herman.
How about that Hunter’s Supermoon this past weekend, huh? Follow that Moon, as it’s meeting up with the Hyades again this week, and occults (passes in front of) Aldebaran Tuesday night into Wednesday morning.
Here’s the lowdown on the event:
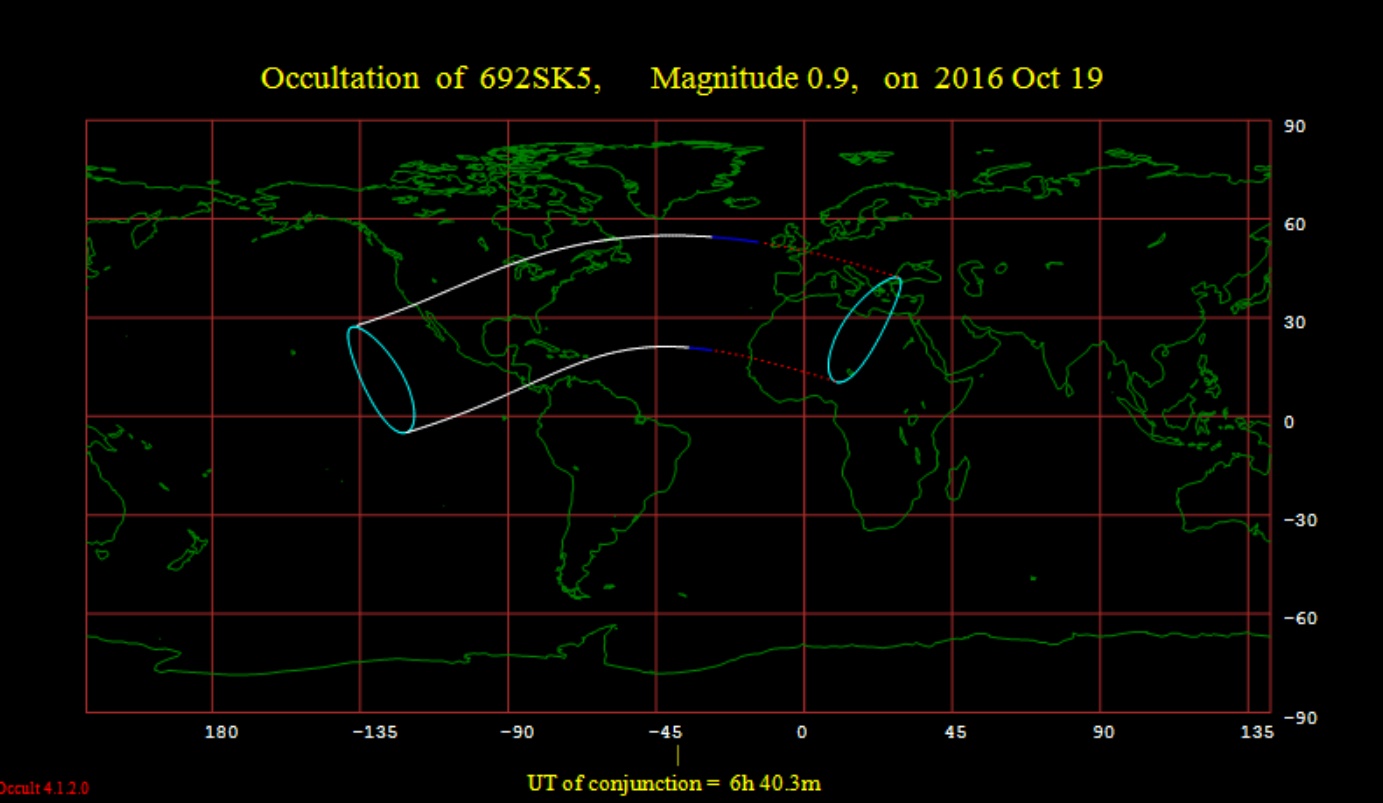
The 86% illuminated waning gibbous Moon occults the +0.9 magnitude star Aldebaran across North America, the Northern Atlantic and Europe. The Moon is three days past Full during the event. Both are located 136 degrees west of the Sun at the time of the event. The central time of conjunction is ~6:40 Universal Time (UT). The event occurs during the daylight hours over western Europe and northwestern Africa and under darkness for southeastern North America, including the eastern United States and Mexico. The Moon will next occult Aldebaran on November 15th, 2016. This is occultation 24 in the current series of 49 running from January 29th, 2015 to September 3rd 2018.
The occultation of Aldebaran by the Moon as seen from London on December 23rd, 2015. Image credit and copyright: Roger Hutchinson.
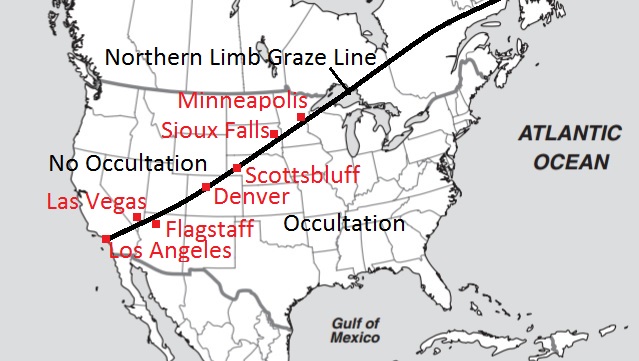
The graze line is of particular interest during this event. We’re talking about the very edge of the footprint of the Moon’s ‘shadow’ cast by Aldebaran, running through Canada and bisecting the United States. Observers based along this line could see a spectacular ‘grazing occultation’ of Aldebaran by the Moon. We usually think of the limb of the Moon as a smooth curve, but it’s actually jagged. What you may see is Aldebaran wink in and out as light shines down those lunar valleys and is alternately blocked out behind peaks and crater rims. This is an unforgettable sight, and makes for great video. A record of a grazing occultation by multiple observers can also be used to create a profile of the lunar limb. That light from Aldebaran took 65 years to get here, only to be blocked by our Moon at the very last second.
The occultation footprint for tonight’s event. The solid lines denote where the occultation occurs under dark nighttime skies, while the blue lines denote twilight, and the broken lines describe where the event occurs in the daytime. Image credit: Occult 4.2.
And observers (myself one of them) based in Europe shouldn’t count themselves out. Like brighter planets, you can spy a +1 magnitude star such as Aldebaran near the daytime Moon using binoculars or a telescope… if, of course, you have a high contrast deep blue sky and know exactly where to look for it. The International Occultation Timing Association has a page for the event with a complete list of ingress and egress times for key cities on three continents in the path. We’ll be watching the Wednesday event – clear skies willing — from our present basecamp in the Andalusian foothills just outside of Jimena de la Frontera, Spain.
The northern graze line for tonight’s occultation. Note that several major cities lie along the crucial path. Image credit: Dave Dickinson.
During our current epoch, the Moon can only occult four +1st magnitude stars: Regulus, Spica, Antares and Aldebaran. The slow motion movement of the Moon, the Earth and the background stars make this prestigious A-list change over time: until about two millennia ago, you could also count the bright star Pollux in Gemini among them.
In the current century, (2001-2100 AD) the Moon occults Aldebaran 247 times, topped only by Antares (386 times) and barely beating out Spica (220 times).
Timing an occultation is fun and as easy as shooting video of the Moon through a telescope at the appointed time of ingress or egress. Practice on framing the dazzling Moon first well in advance — probably the toughest part is getting the exposure of the bright limb stopped down enough to still see and image the star. We find that shooting anywhere from 1/100th to 1/500th frame rate for a gibbous Moon is about right. Don’t be afraid to crank up the magnification a bit, so you can place the bulk of the Moon out of view. Also, catching occultations of stars and planets during waning Moon phases are more challenging than waxing, as the star will ingress behind the bright leading limb and later reappear behind the dark trailing limb (waxing is vice versa).
Observing: Running an audible time hack in the background such as WWV radio out of Fort Collins, Colorado can provide a precise record of the occultation.
But wait, there’s more. When the Moon occults Aldebaran, its also crossing the background V-shaped open star cluster known as the Hyades. Worldwide the waning gibbous Moon also occults Gamma, 51, and Theta^1 and Theta^2, SAO 93975, and 119 Tauri. Chances are, there’s an occultation for YOU to catch this week, regardless of your location.
Want more? Well, the Moon continues to occult Aldebaran every lunation through 2017, and will also start a cycle of passes in front of Regulus on December 18th. In fact, the next occultation of Aldebaran on November 15th favors central Asia, and the event two lunations from now on December 13th brings the path back around the North America.
A great close out for 2016, for sure. Don’t miss this week’s occultation!
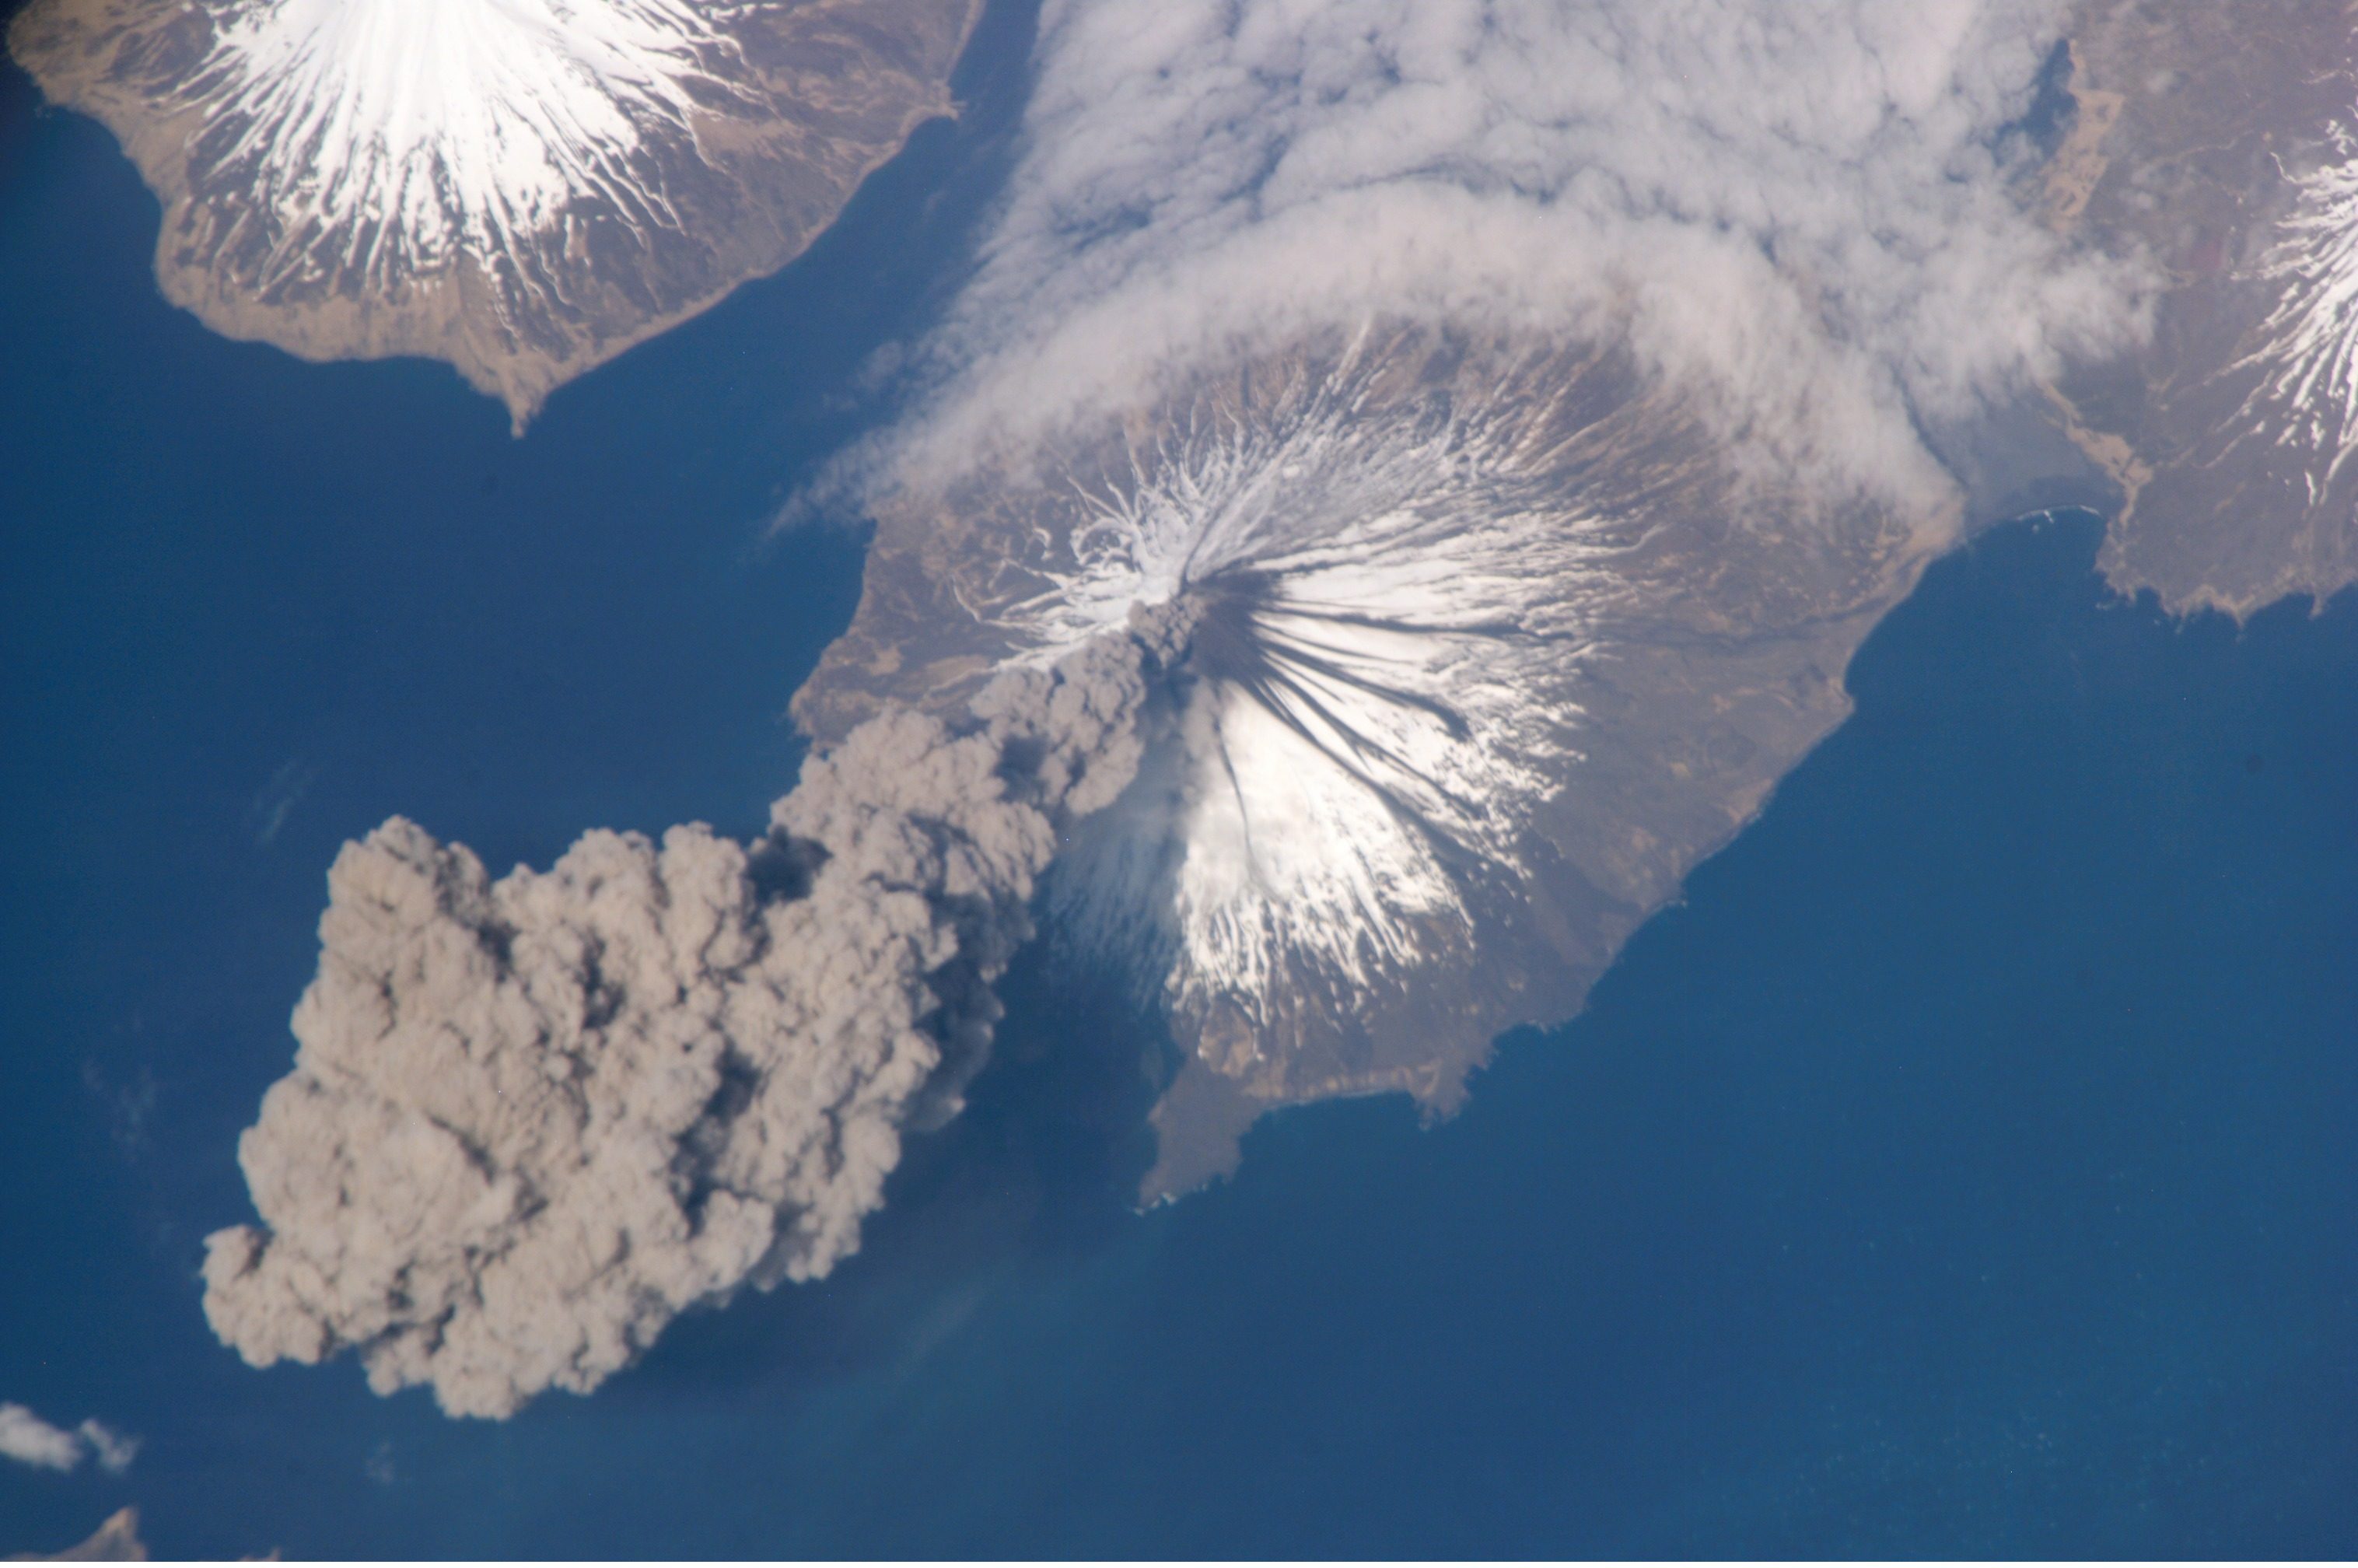
Image taken by a crew member of Expedition 13 from the ISS, showing the eruption of Cleveland Volcano, Aleutian Islands, Alaska. Credit: NASA
A volcano is an impressive sight. When they are dormant, they loom large over everything on the landscape. When they are active, they are a destructive force of nature that is without equal, raining fire and ash down on everything in site. And during the long periods when they are not erupting, they can also be rather beneficial to the surrounding environment.
But just what causes volcanoes? When it comes to our planet, they are the result of active geological forces that have shaped the surface of the Earth over the course of billions of years. And interestingly enough, there are plenty of examples of volcanoes on other bodies within our Solar System as well, some of which put those on Earth to shame!
Definition:
By definition, a volcano is a rupture in the Earth’s (or another celestial body’s) crust that allows hot lava, volcanic ash, and gases to escape from a magma chamber located beneath the surface. The term is derived from Vulcano, a volcanically-active island located of the coast of Italy who’s name in turn comes from the Roman god of fire (Vulcan).
Artist’s illustration of the Earth’s Tectonic Plates. Credit: msnucleus.org
On Earth, volcanoes are the result of the action between the major tectonic plates. These sections of the Earth’s crust are rigid, but sit atop the relatively viscous upper mantle. The hot molten rock, known as magma, is forced up to the surface – where it becomes lava. In short, volcanoes are found where tectonic plates are diverging or converging – such as the Mid-Atlantic Ridge or the Pacific Ring of Fire – which causes magma to be forced to the surface.
Volcanoes can also form where there is stretching and thinning of the crust’s interior plates, such as in the the East African Rift and the Rio Grande Rift in North America. Volcanism can also occur away from plate boundaries, where upwelling magma is forced up into brittle sections of the crust, forming volcanic islands – such as the Hawaiian islands.
Erupting volcanoes pose many hazards, and not just to the surrounding countryside. In their immediate vicinity, hot, flowing lava can cause extensive damage to the environment, property, and endanger lives. However, volcanic ash can cause far-reaching damage, raining sulfuric acid, disrupting air travel, and even causing “volcanic winters” by obscuring the Sun (thus triggering local crop failures and famines).
Types of Volcanoes:
There are four major types of volcanoes – cinder cone, composite and shield volcanoes, and lava domes. Cinder cones are the simplest kind of volcano, which occur when magma is ejected from a volcanic vent. The ejected lava rains down around the fissure, forming an oval-shaped cone with a bowl-shaped crater on top. They are typically small, with few ever growing larger than about 300 meters (1,000 feet) above their surroundings.
Paricutin, an example of a cinder cone volcano. Credit: USGS
Composite volcanoes (aka. stratovolcanoes) are formed when a volcano conduit connects a subsurface magma reservoir to the Earth’s surface. These volcanoes typically have several vents that cause magma to break through the walls and spew from fissures on the sides of the mountain as well as the summit.
These volcanoes are known for causing violent eruptions. And thanks to all this ejected material, these volcanoes can grow up to thousands of meters tall. Examples include Mount Rainier (4,392 m; 14,411 ft), Mount Fuji (3,776 m; 12,389 ft), Mount Cotopaxi (5,897 m; 19,347 ft) and Mount Saint Helens (2,549 mm; 8,363 ft).
Shield volcanoes are so-named because of their large, broad surfaces. With these types of volcanoes, the lava that pours forth is thin, allowing it to travel great distances down the shallow slopes. This lava cools and builds up slowly over time, with hundreds of eruptions creating many layers. They are therefore not likely to be catastrophic. Some of the best known examples are those that make up the Hawaiian Islands, especially Mauna Loa and Mauna Kea.
Volcanic or lava domes are created by small masses of lava which are too viscous to flow very far. Unlike shield volcanoes, which have low-viscosity lava, the slow-moving lava simply piles up over the vent. The dome grows by expansion over time, and the mountain forms from material spilling off the sides of the growing dome. Lava domes can explode violently, releasing a huge amount of hot rock and ash.
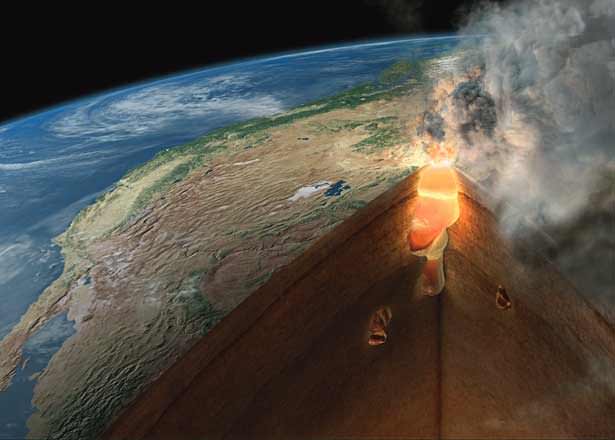
Artist’s impression of a what lies beneath the Yellowstone volcano. Credit: Hernán Cañellas/National Geographic
Volcanoes can also be found on the ocean floor, known as submarine volcanoes. These are often revealed through the presence of blasting steam and rocky debris above the ocean’s surface, though the pressure of the ocean’s water can often prevent an explosive release.
In these cases, lava cools quickly on contact with ocean water, and forms pillow-shaped masses on the ocean floor (called pillow lava). Hydrothermal vents are also common around submarine volcano, which can support active and peculiar ecosystems because of the energy, gases and minerals they release. Over time, the formations created by submarine volcanoes may become so large that they become islands.
Volcanoes can also developed under icecaps, which are known as subglacial volcanoes. In these cases, flat lava flows on top of pillow lava, which results from lava quickly cooling upon contact with ice. When the icecap melts, the lava on top collapses, leaving a flat-topped mountain. Very good examples of this type of volcano can be seen in Iceland and British Columbia, Canada.
Examples on Other Planets:
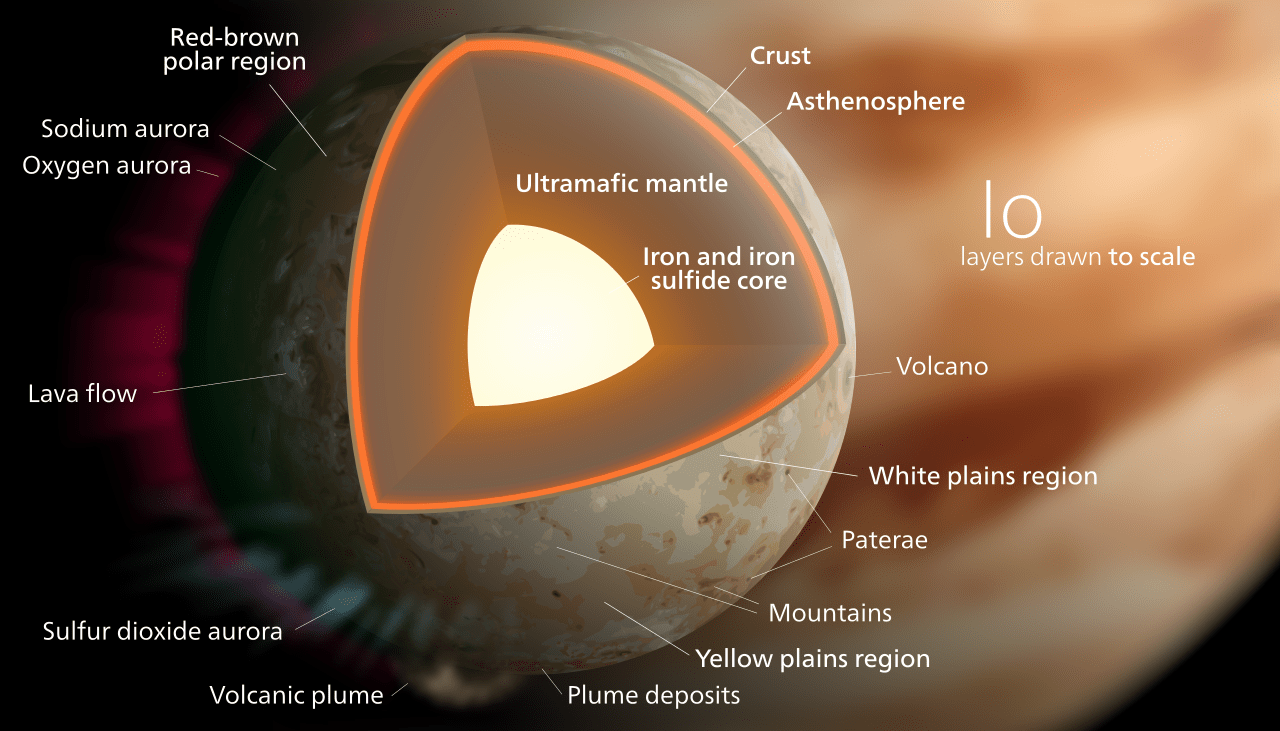
Volcanoes can be found on many bodies within the Solar System. Examples include Jupiter’s moon Io, which periodically experiences volcanic eruptions that reach up to 500 km (300 mi) into space. This volcanic activity is caused by friction or tidal dissipation produced in Io’s interior, which is responsible for melting a significant amount of Io’s mantle and core.
Model of the possible interior composition of Io with various features labelled. Credit: Wikipedia Commons/Kelvinsong
It’s colorful surface (orange, yellow, green, white/grey, etc.) shows the presence of sulfuric and silicate compounds, which were clearly deposited by volcanic eruptions. The lack of impact craters on its surface, which is uncommon on a Jovian moon, is also indicative of surface renewal.
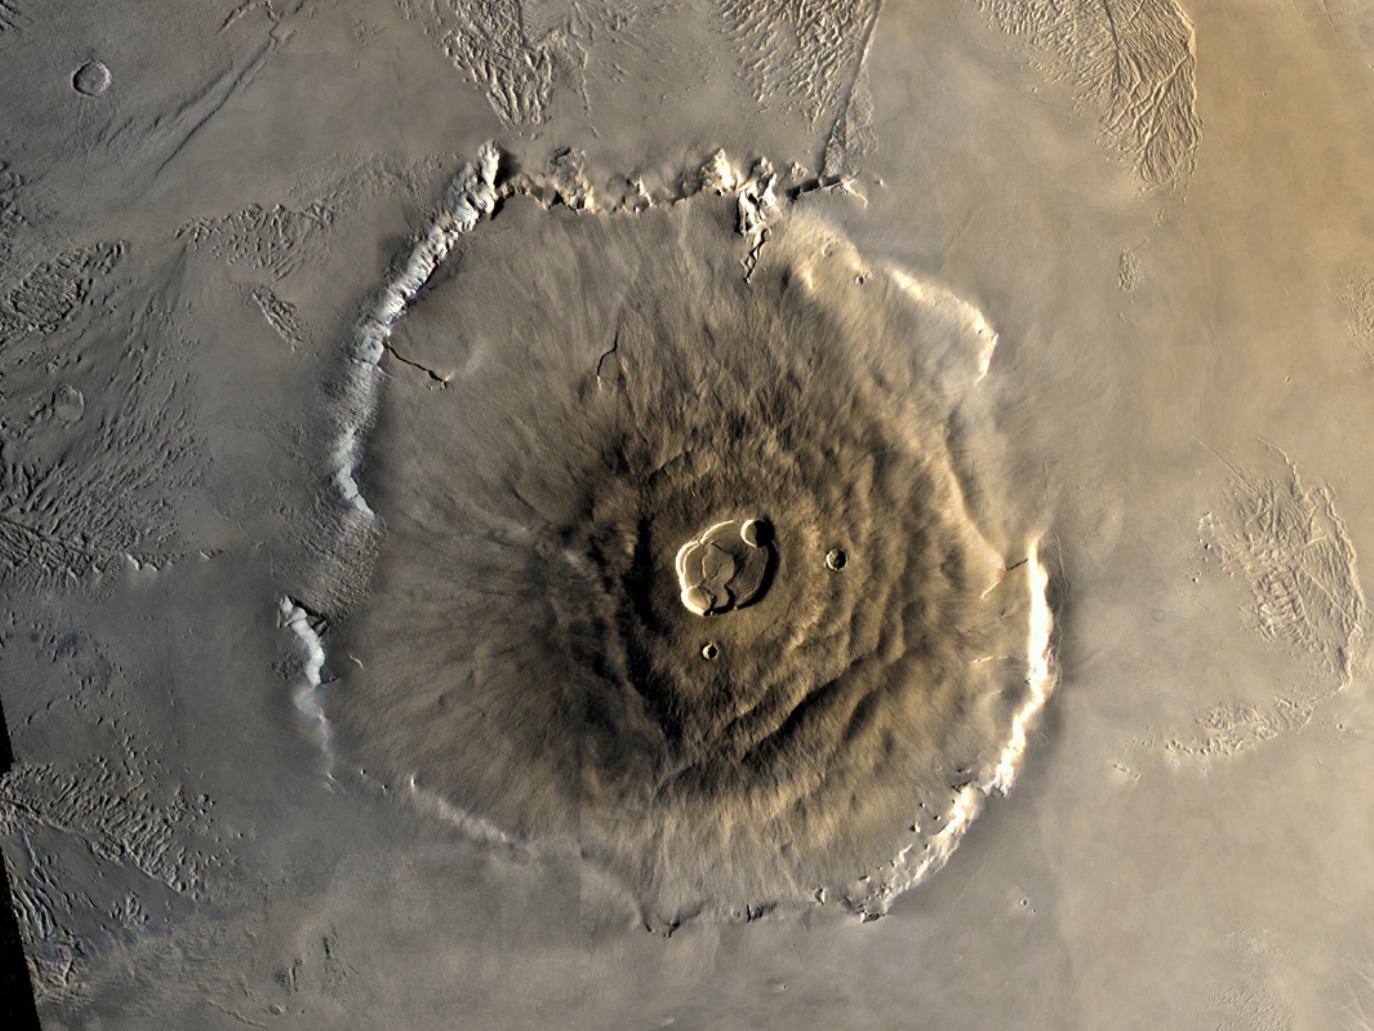
Mars has also experienced intense volcanic activity in its past, as evidenced by Olympus Mons – the largest volcano in the Solar System. While most of its volcanic mountains are extinct and collapsed, the Mars Express spacecraft observed evidence of more recent volcanic activity, suggesting that Mars may still be geologically active.
Much of Venus’ surface has been shaped by volcanic activity as well. While Venus has several times the number of Earth’s volcanoes, they were believed to all be extinct. However, there is a multitude of evidence that suggests that there may still be active volcanoes on Venus which contribute to its dense atmosphere and runaway Greenhouse Effect.
For instance, during the 1970s, multiple Soviet Venera missions conducted surveys of Venus. These missions obtained evidence of thunder and lightning within the atmosphere, which may have been the result of volcanic ash interacting with the atmosphere. Similar evidence was gathered by the ESA’s Venus Express probe in 2007.
3-D perspective of the Venusian volcano, Maat Mons generated from radar data from NASA’s Magellan mission. Credit: NASA/JPL
This same mission observed transient localized infrared hot spots on the surface of Venus in 2008 and 2009, specifically in the rift zone Ganis Chasma – near the shield volcano Maat Mons. The Magellan probe also noted evidence of volcanic activity from this mountain during its mission in the early 1990s, using radar-sounding to detect ash flows near the summit.
Cryovolcanism:
In addition to “hot volcanoes” that spew molten rock, there are also cryovolcanoes (aka. “cold volcanoes”). These types of volcanoes involve volatile compounds – i.e. water, methane and ammonia – instead of lava breaking through the surface. They have been observed on icy bodies in the Solar System where liquid erupts from ocean’s hidden in the moon’s interior.
For instance, Jupiter’s moon Europa, which is known to have an interior ocean, is believed to experiences cryovolcanism. The earliest evidence for this had to do with its smooth and young surface, which points towards endogenic resurfacing and renewal. Much like hot magma, water and volatiles erupt onto the surface where they then freeze to cover up impact craters and other features.
In addition, plumes of water were observed in 2012 and again in 2016 using the Hubble Space Telescope. These intermittent plumes were observed on both occasions to be coming in the southern region of Europa, and were estimated to be reach up to 200 km (125 miles) before depositing water ice and material back onto the surface.
In 2005, the Cassini-Huygens mission detected evidence of cryovolcanism on Saturn’s moons Titan and Enceladus. In the former case, the probe used infrared imaging to penetrate Titan’s dense clouds and detect signs of a 30 km (18.64 mi) formation, which was believed to be caused by the upwelling of hydrocarbon ices beneath the surface.
On Enceladus, cryovolcanic activity has been confirmed by observing plumes of water and organic molecules being ejected from the moon’s south pole. These plumes are are thought to have originated from the moon’s interior ocean, and are composed mostly of water vapor, molecular nitrogen, and volatiles (such as methane, carbon dioxide and other hydrocarbons).
In 1989, the Voyager 2 spacecraft observed cryovolcanoes ejecting plumes of water ammonia and nitrogen gas on Neptune’s moon Triton. These nitrogen geysers were observed sending plumes of liquid nitrogen 8 km (5 mi) above the surface of the moon. The surface is also quite young, which was seen as indication of endogenic resurfacing. It is also theorized that cryovolcanism may also be present on the Kuiper Belt Object Quaoar.
Here on Earth, volcanism takes the form of hot magma being pushed up through the Earth’s silicate crust due to convention in the interior. However, this kind of activity is present on all planet that formed from silicate material and minerals, and where geological activity or tidal stresses are known to exist. But on other bodies, it consists of cold water and materials from the interior ocean being forced through to the icy surface.
Color Mosaic of Olympus Mons on Mars. Credit: NASA/JPL
Today, our knowledge of volcanism (and the different forms it can take) is the result of improvements in both the field of geology, as well as space exploration. The more we learn of about other planets, the more we are able to see startling similarities and contrasts with our own (and vice versa).
A brand new crater on the Moon! This new 12 meter (39 foot) diameter impact crater formed between 25 October 2012 and 21 April 2013 Credit: NASA/GSFC/Arizona State University].
Animation of a temporal pair of the new 39-foot (12-meter) impact crater on the moon photographed by NASA’s Lunar Reconnaissance Orbiter Credit: NASA/GSFC/Arizona State University
We often hear how the Moon’s appearance hasn’t changed in millions or even billions of years. While micrometeorites, cosmic rays and the solar wind slowly grind down lunar rocks, the Moon lacks erosional processes such as water, wind and lurching tectonic plates that can get the job done in a hurry.
One of a series of photos Apollo 11 astronaut Edwin Aldrin made of his bootprint in the dusty, sandy lunar soil, called regolith. Based on a newy study, the impression may disappear in a few tens of thousands of years instead a few million. Credit: NASA
Remember Buzz Aldrin’s photo of his boot print in the lunar regolith? It was thought the impression would last up to 2 million years. Now it seems that estimate may have to be revised based on photos taken by the Lunar Reconnaissance Orbiter (LRO) that reveal that impacts are transforming the surface much faster than previously thought.
This map shows the distribution of new impact craters (yellow dots) discovered by analyzing 14,000 narrow-angle camera (NAC) temporal pairs. The two red dots mark the location of the March 17, 2013 and September 11, 2013 impacts that were recorded by Earth-based video monitoring. LRO’s mission was recently extended an addition two years through September 2018. Credit: NASA/GSFC/ASUThe LRO’s high resolution camera, which can resolve features down to about 3 feet (1-meter) across, has been peering down at the Moon from orbit since 2009. Taking before and after images, called temporal pairs, scientists have identified 222 impact craters that formed over the past 7 years. The new craters range from 10 feet up to 141 feet (3-43 meters) in diameter.
By analyzing the number of new craters and their size, and the time between each temporal pair, a team of scientists from Arizona State University and Cornell estimated the current cratering rate on the Moon. The result, published in Nature this week, was unexpected: 33% more new craters with diameters of at least 30 feet (10 meters) were found than anticipated by previous cratering models.
LRO before and after images of an impact event on March 17, 2013. The newly formed crater is 59 feet (18 meters) in diameter. Subsurface regolith not exposed to sunlight forms a bright halo around the new crater. There also appears to be a larger nimbus of darker reflectance material visible much further beyond but centered on the impact. Credit: NASA/GSFC/Arizona State University
Similar to the crater that appeared on March 17, 2013 (above), the team also found that new impacts are surrounded by light and dark reflectance patterns related to material ejected during crater formation. Many of the larger impact craters show up to four distinct bright or dark reflectance zones. Nearest to the impact site, there are usually zone of both high and low reflectance. These two zones likely formed as a layer of material that was ejected from the crater during the impact shot outward to about 2½ crater diameters from the rim.
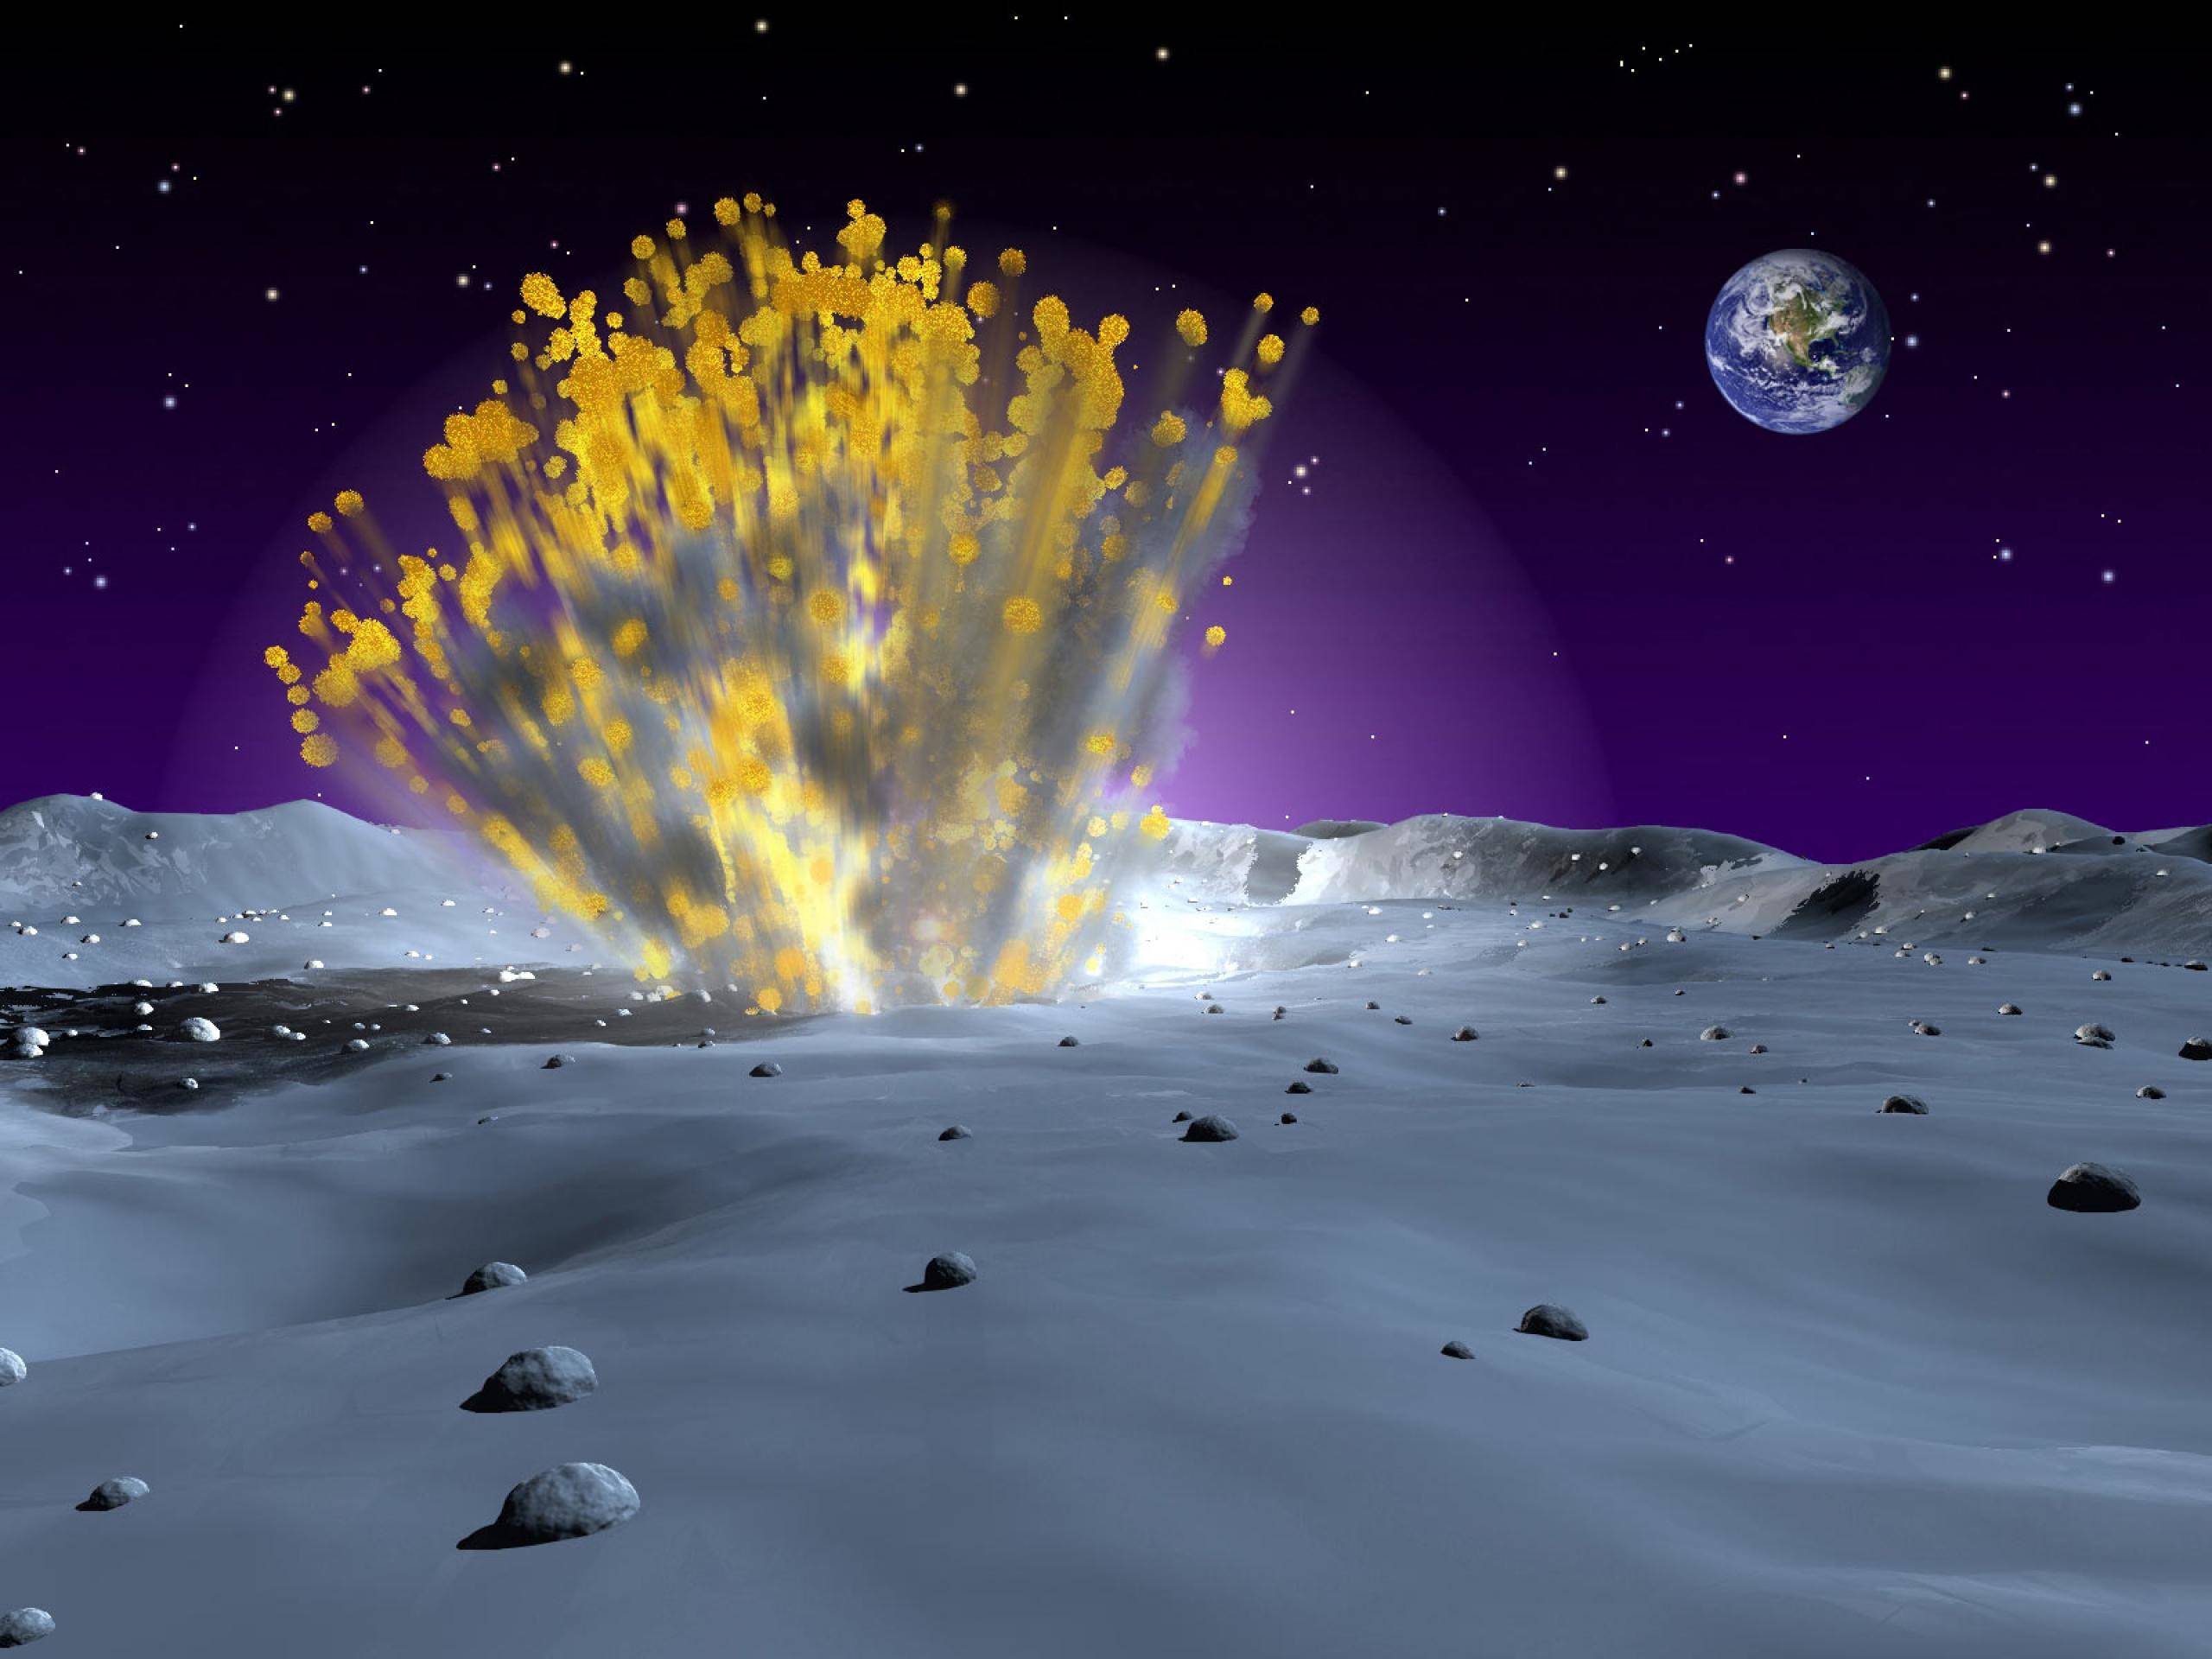
An artist’s illustration of a meteoroid impact on the Moon. Impacts dig up fresh material from below as well as send waves of hot rock vapor and molten rock across the lunar landscape, causing a much faster turnover of the moon soil than previously thought. Credit: NASA
From analyzing multiple impact sites, far flung ejecta patterns wrap around small obstacles like hills and crater rims, indicating the material was traveling nearly parallel to the ground. This kind of path is only possible if the material was ejected at very high speed around 10 miles per second or 36,000 miles per hour! The jet contains vaporized and molten rock that disturb the upper layer of lunar regolith, modifying its reflectance properties.
How LRO creates temporal pairs and scientists use them to discover changes on the moon’s surface.
In addition to discovering impact craters and their fascinating ejecta patterns, the scientists also observed a large number of small surface changes they call ‘splotches’ most likely caused by small, secondary impacts. Dense clusters of these splotches are found around new impact sites suggesting they may be secondary surface changes caused by material thrown out from a nearby primary impact. From 14,000 temporal pairs, the group identified over 47,000 splotches so far.
Here are two examples of a low reflectance (top) and high reflectance (bottom) splotch created either by a small impactor or more likely from secondary ejecta. In either case, the top few inches of the regolith (soil) was churned Credit: NASA/GSFC/Arizona State UniversityBased on estimates of size, depth and frequency of formation, the group estimated that the relentless churning caused by meteoroid impacts will turn over 99% of the lunar surface after about 81,000 years. Keep in mind, we’re talking about the upper regolith, not whole craters and mountain ranges. That’s more than 100 times faster than previous models that only took micrometeorites into account. Instead of millions of years for those astronaut boot prints and rover tracks to disappear, it now appears that they’ll be wiped clean in just tens of thousands!
Colour-coded topographic view of the Colles Nili region, showing the relative heights and depths of terrain. Credit: ESA/DLR/FU Berlin
In the northern hemisphere of Mars, between the planet’s southern highlands and the northern lowlands, is a hilly region known as Colles Nilli. This boundary-marker is a very prominent feature on Mars, as it is several kilometers in height and surrounded by the remains of ancient glaciers.
And thanks to the Mars Express mission, it now looks like this region is also home to some buried glaciers. Such was the conclusion after the orbiting spacecraft took images that revealed a series of eroded blocks along this boundary, which scientists have deduced are chunks of ice that became buried over time.
The Mars Express images show a plethora of these features along the north-south boundary. They also reveal several features that hint at the presence of buried ice and erosion – such as layered deposits as well as ridges and troughs. Similar features are also found in nearby impact craters. All of these are believed to have been caused by an ancient glacier as it retreated several hundred million years ago.
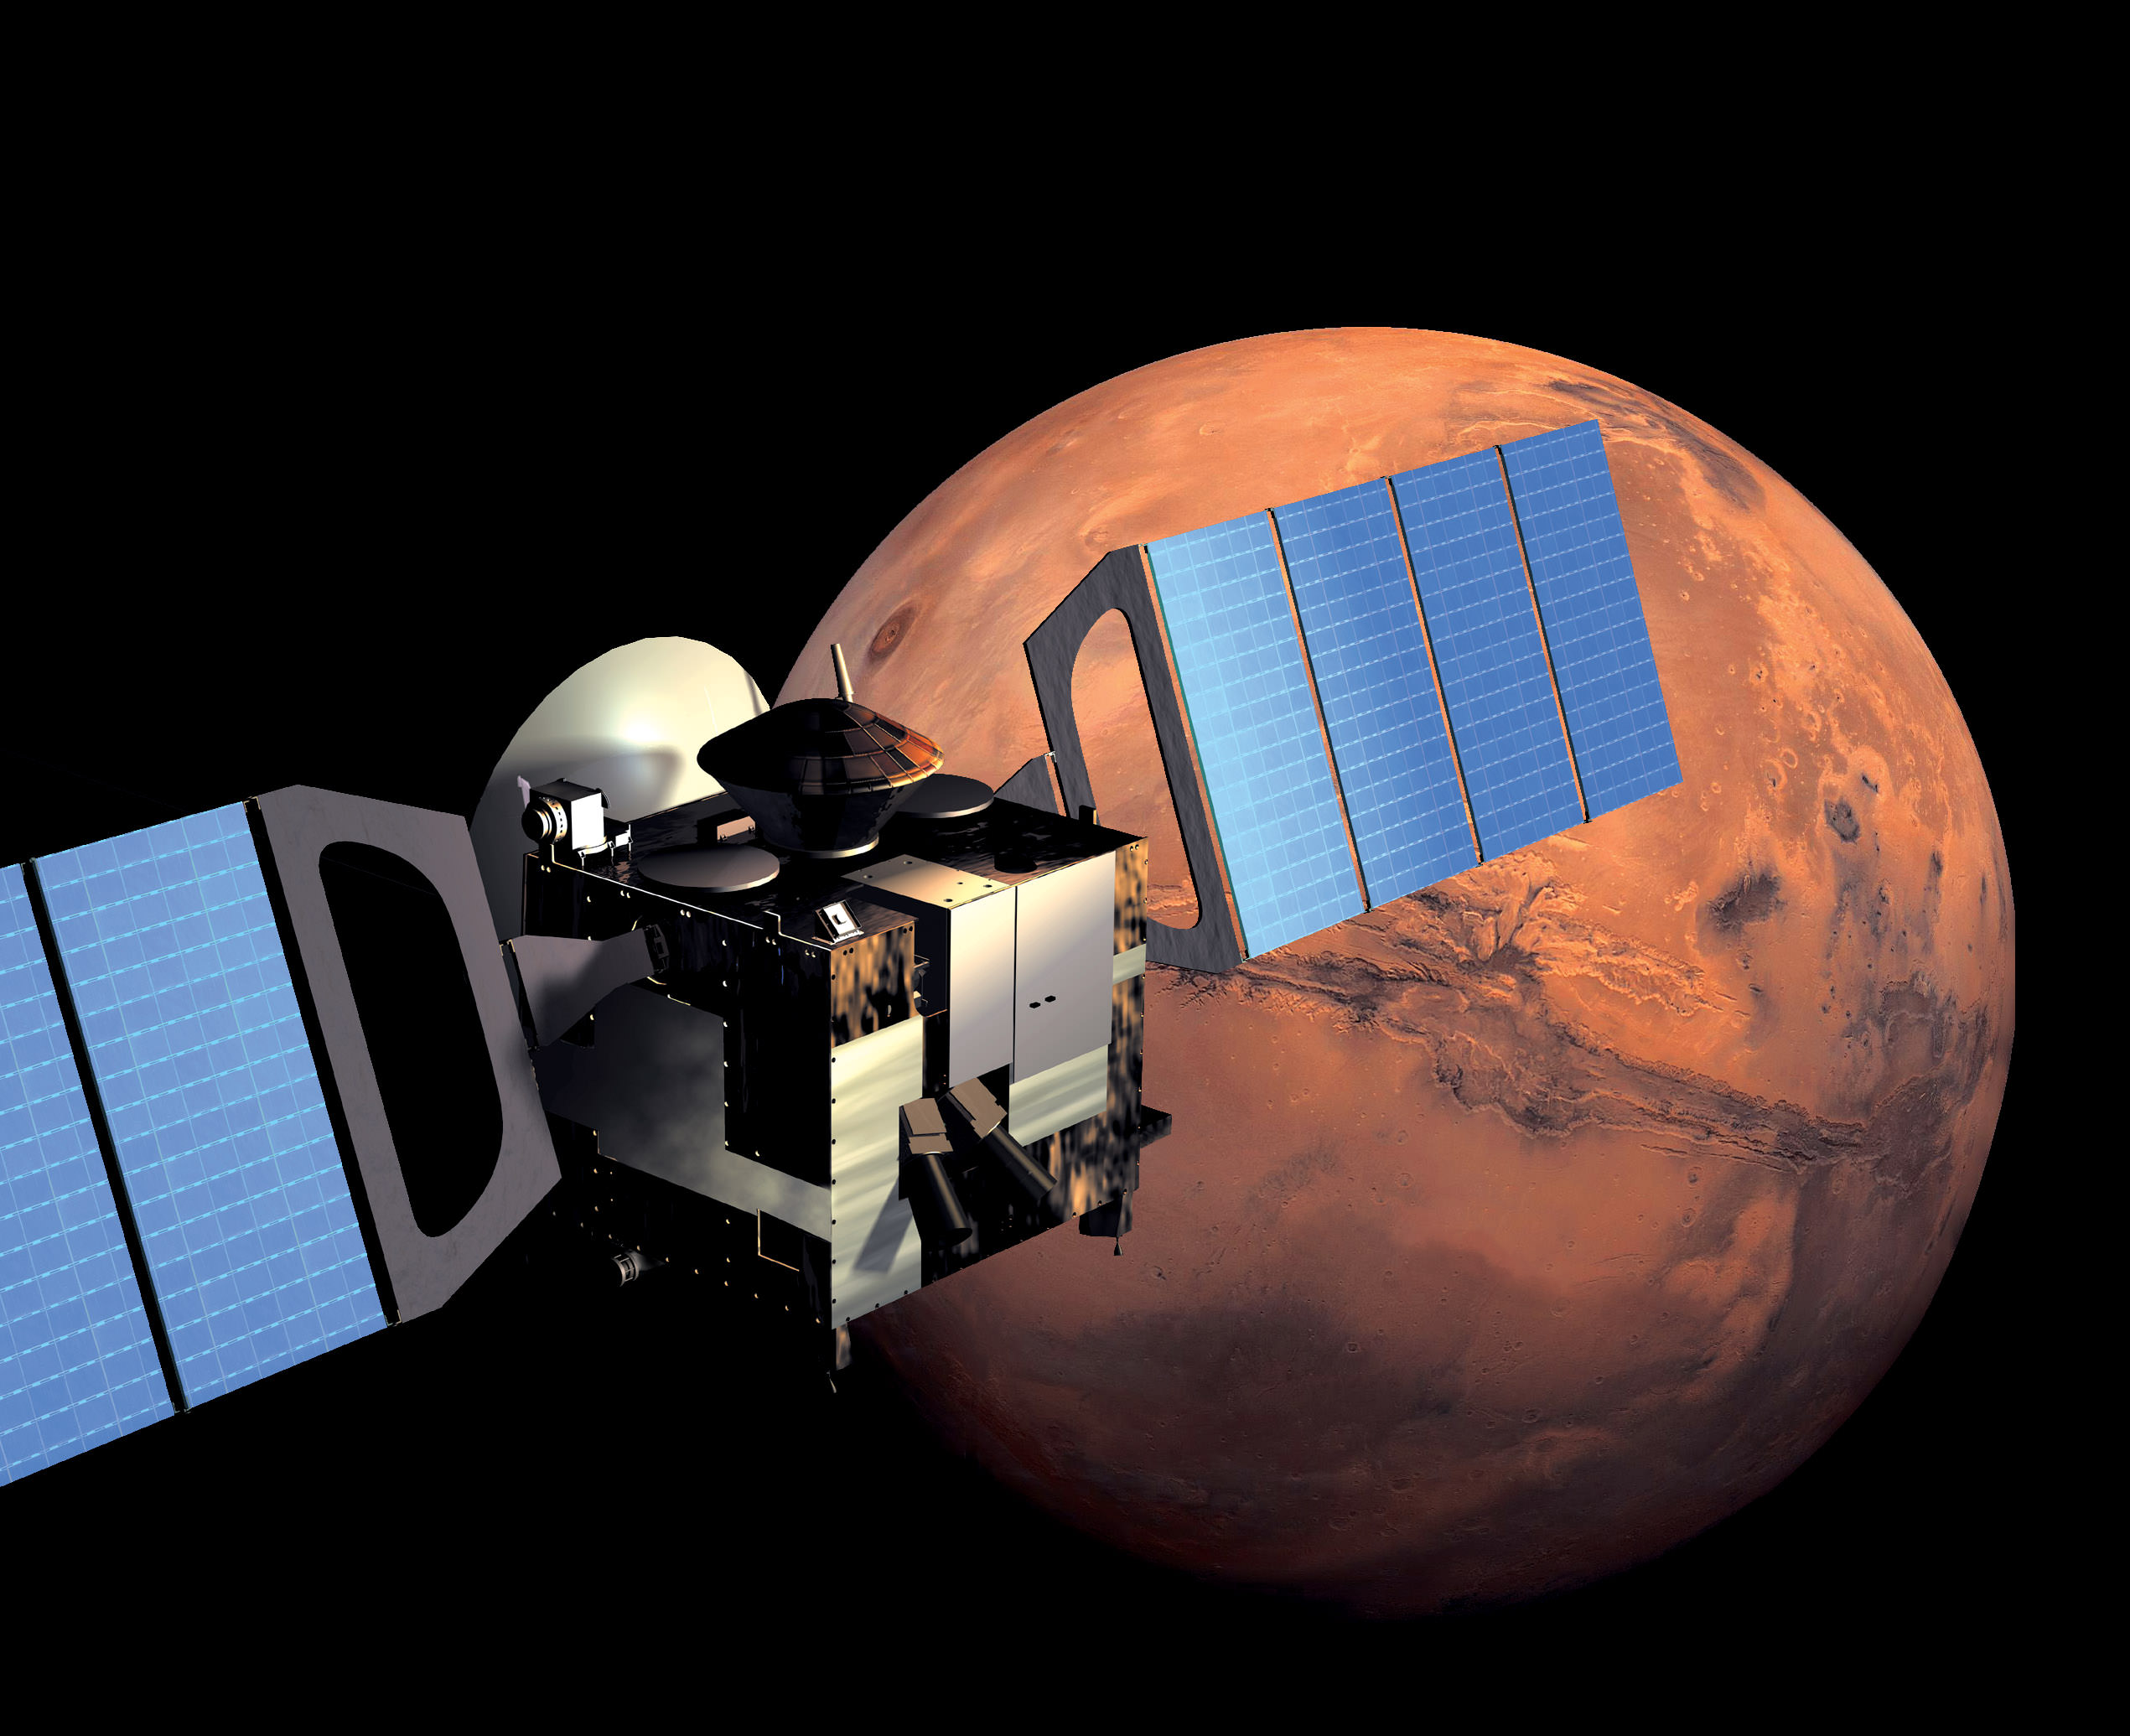
Artist’s impression of the Mars Express spacecraft in orbit. Credit: ESA/Medialab
It is further reasoned that these remaining ice deposits were covered by debris that was deposited from the plateau as it eroded. Wind-borne dust was also deposited over time, which is believed to be the result of volcanic activity. This latter source is evidenced by steaks of dark material deposited around the blocks, as well as dark sand dunes spotted within the impact craters.
Similar features are believed to exist within many boundary regions on Mars, and are believed to represent periods of glaciation that took place over the course of eons. And this is not the first time buried glaciers have been spotted on Mars.
For instance, back in 2008, the Mars Reconnaissance Orbiter (MRO) used its ground-penetrating radar to locate water ice under blankets or rocky debris, and at latitudes far lower than any that had been previously identified. At the time, this information shed light on a long-standing mystery about Mars, which was the presence of what are called “aprons”.
These gently-sloping rocky deposit, which are found at the bases of taller features, were first noticed by NASA’s Viking orbiters during the 1970s. A prevailing theory has been that these aprons are the result of rocky debris lubricated by small amounts of ice.
Artist’s impression of the separation of the ExoMars entry, descent and landing demonstrator module (Schiaparelli) from the Trace Gas Orbiter (TGO). Credit: ESA/ATG medialab
Combined with this latest info taken from the northern hemisphere, it would appear that there is plenty of ice deposits all across the surface of Mars. The presence (and prevalence) of these icy remnants offer insight into Mars’ geological past, which – like Earth – involved some “ice ages”.
The Mars Express mission has been actively surveying the surface of Mars since 2003. On October 19th, it will be playing a vital role as the Exomars mission inserts itself into Martian orbit and the Schiaparelli lander makes its descent and landing on the Martian surface.
Alongside the MRO and the ExoMars Orbiter, it will be monitoring signals from the lander to confirm its safe arrival, and will relay information sent from the surface during the course of its mission.
The ESA will be broadcasting this event live. And given that this mission will be the ESA’s first robotic lander to reach Mars, it should prove to be an exciting event!


![Distribution of new impact craters (yellow dots) discovered by analyzing 14,000 NAC temporal pairs. The two red dots mark the location of the 17 March 2013 and the 11 September 2013 impacts that were recorded by Earth-based video monitoring [NASA/GSFC/Arizona State University]](https://www.universetoday.com/wp-content/uploads/2016/10/Moon-new-crater-distribution-NASA-GSFC-ASU.jpg)
![Example of a low reflectance (top) and high reflectance (bottom) splotch created either by a small impactor or more likely from secondary ejecta. In either case, the top few centimeters of the regolith (soil) was churned [NASA/GSFC/Arizona State University].](https://www.universetoday.com/wp-content/uploads/2016/10/Moon-craters-splotches-NASA.gif)