Becoming an astronaut is a rare honor. The rigorous selection process, the hard training, and then… the privilege of going into space! It is something few human beings will ever be privileged enough to experience. But what about other species of animal that have gone into space? Are we not being just the slightest bit anthropocentric in singling out humans for praise?
What about all those brave simians and mice that were sent into space? What about the guinea pigs and rats? And what of “Man’s Best Friend”, the brave canines that helped pave the way for “manned” spaceflight? During the 1950s and 60s, the Soviets sent over 20 dogs into space, some of which never returned. Here’s what we know about these intrepid canines who helped make humanity a space-faring race!
Background:
During the 1950s and 60s, the Soviets and Americans found themselves locked in the Space Race. It was a time of intense competition as both superpowers attempted to outmaneuver the other and become the first to achieve spaceflight, conduct crewed missions to orbit, and eventually land crews on another celestial body (i.e. the Moon).
Before crewed missions could be sent, however, both the Soviet space program and NASA conducted rigorous tests involving animal test subjects, as a way of gauging the stresses and physical tolls going into space would have. These tests were not without precedent, as animals had been used for aeronautical tests in previous centuries.
For instance, in 1783, the Montgolfier brothers sent a sheep, a duck and a rooster when testing their hot air balloon to see what the effects would be. Between 1947-1960, the US launched several captured German V-2 rockets (which contained animal test subjects) to measure the effect traveling to extremely high altitudes would have on living organisms.
Because of the shortage of rockets, they also employed high-altitude balloons. These tests were conducted using fruit flies, mice, hamsters, guinea pigs, cats, dogs, frogs, goldfish and monkeys. The most famous test case was Albert II, a rhesus monkey that became the first monkey to go into space on June 14th, 1949.
For the Soviets, it was felt that dogs would be the perfect test subjects, and for several reasons. For one, it was believed that dogs would be more comfortable with prolonged periods of inactivity. The Soviets also selected female dogs (due to their better temperament) and insisted on stray dogs (rather than house dogs) because they felt they would be able to tolerate the extreme stresses of space flight better.
Training:
For the sake of preparing the dogs that were used for the sake of test flights, the Soviets confined the subjects in small boxes of decreasing size for periods of between 15 and 20 days at a time. This was designed to simulate spending time inside the small safety modules that would housed them for the duration of their flights.
Other exercises designed to get the dogs prepared for space flight included having them stand still for long periods of time. They also sought to get the dogs accustomed to wearing space suits, and made them ride in centrifuges that simulated the high acceleration experienced during launch.
Suborbital Flights:
Between 1951 and 1956, the Russians conducted their first test flights using dogs. Using R-1 rockets. a total of 15 missions were flown and were all suborbital in nature, reaching altitudes of around 100 km (60 mi) above sea level. The dogs that flew in these missions wore pressure suits with acrylic glass bubble helmets.
The first to go up were Dezik and Tsygan, who both launched aboard an R-1 rocket on July 22nd, 1951. The mission flew to a maximum altitude of 110 km, and both dogs were recovered unharmed afterwards. Dezik made another sub-orbital flight on July 29th, 1951, with a dog named Lisa, although neither survived because their capsule’s parachute failed to deploy on re-entry.
Several more launches took place throughout the Summer and Fall of 1951, which included the successful launch and recovery of space dogs Malyshka and ZIB. In both cases, these dogs were substitutes for the original space dogs – Smelaya and Bolik – who ran away just before the were scheduled to launch.
By 1954, space dogs Lisa-2 (“Fox” or “Vixen”, the second dog to bear this name after the first died), Ryzhik (“Ginger” because of the color of her fur) made their debut. Their mission flew to an altitude of 100 km on June 2nd, 1954, and both dogs were recovered safely. The following year, Albina and Tsyganka (“Gypsy girl”) were both ejected out of their capsule at an altitude of 85 km and landed safely.
Between 1957 to 1960, 11 flights with dogs were made using the R-2A series of rockets, which flew to altitudes of about 200 km (124 mi). Three flights were made to an altitude of about 450 km (280 mi) using R-5A rockets in 1958. In the R-2 and R-5 rockets, the dogs were contained in a pressured cabin
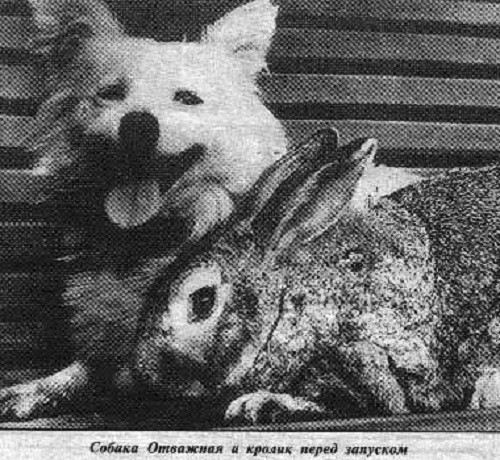
Those to take part in these launches included Otvazhnaya (“Brave One”) who made a flight on July 2nd, 1959, along with a rabbit named Marfusha (“Little Martha”) and another dog named Snezhinka (“Snowflake”). Otvazhnaya would go to make 5 other flights between 1959 and 1960.
Orbital Flights:
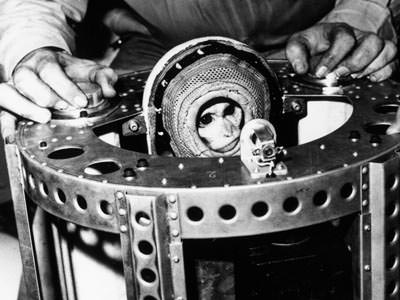
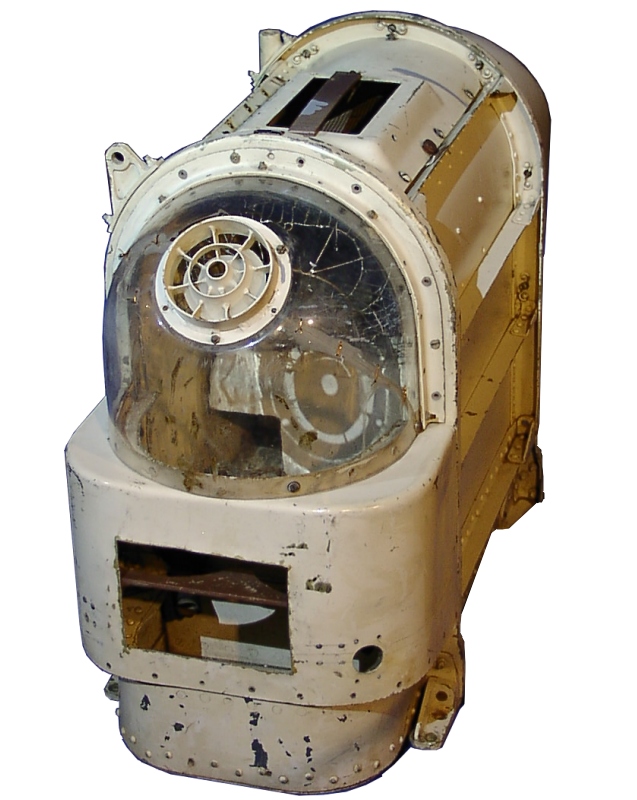
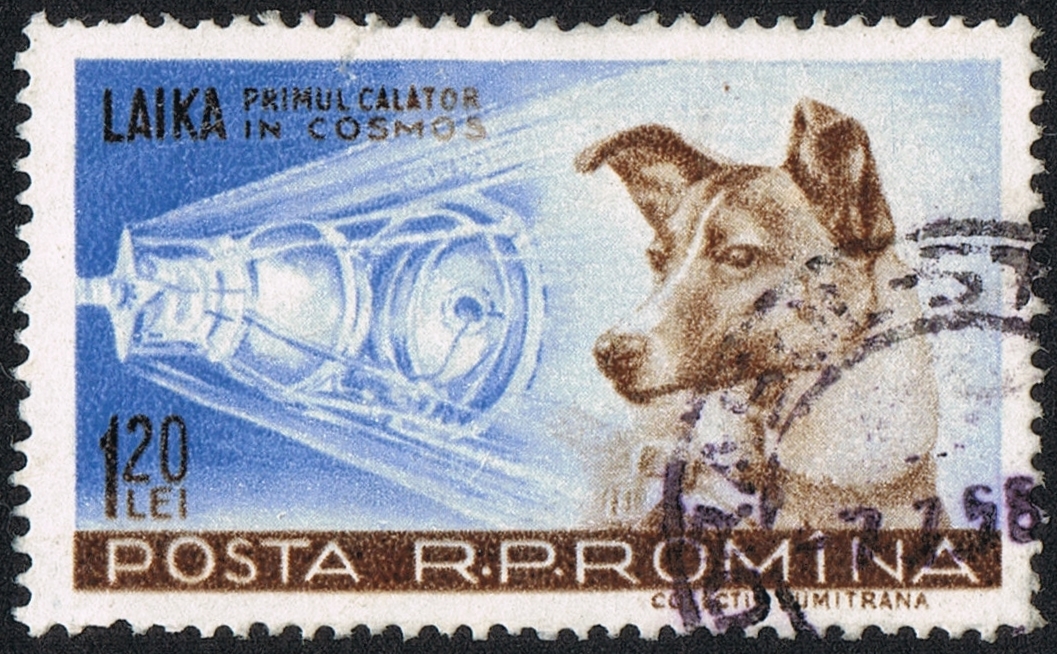
By the late 1950s, and as part of the Sputnik and Vostok programs, Russian dogs began to be sent into orbit around Earth aboard R-7 rockets. On November 3rd, 1957, the famous space dog Laika became the first animal to go into orbit as part of the Sputnik-2 mission. The mission ended tragically, with Laika dying in flight. But unlike other missions where dogs were sent into suborbit, her death was anticipated in advance.
It was believed Laika would survive for a full ten days, when in fact, she died between five and seven hours into the flight. At the time, the Soviet Union claimed she died painlessly while in orbit due to her oxygen supply running out. More recent evidence however, suggests that she died as a result of overheating and panic.
This was due to a series of technical problems which resulted from a botched deployment. The first was the damage that was done to the thermal system during separation, the second was some of the satellite’s thermal insulation being torn loose. As a result of these two mishaps, temperatures in the cabin reached over 40º C.

The mission lasted 162 days before the orbit finally decayed and it fell back to Earth. Her sacrifice has been honored by many countries through a series of commemorative stamps, and she was honored as a “hero of the Soviet Union”. Much was learned from her mission about the behavior of organisms during space flight, though it has been argued that what was learned did not justify the sacrifice.
The next dogs to go into space were Belka (“Squirrel”) and Strelka (“Little Arrow”), which took place on Aug. 19th, 1960, as part of the Sputnik-5 mission. The two dogs were accompanied by a grey rabbit, 42 mice, 2 rats, flies, and several plants and fungi, and all spent a day in orbit before returning safely to Earth.
Strelka went on to have six puppies, one of which was named Pushinka (“Fluffy”). This pup was presented to President John F. Kennedy’s daughter (Caroline) by Nikita Khrushchev in 1961 as a gift. Pushinka went on to have puppies with the Kennedy’s dog (named Charlie), the descendants of which are still alive today.
On Dec. 1st, 1960, space dogs Pchyolka (“Little Bee”) and Mushka (“Little Fly”) went into space as part of Sputnik-6. The dogs, along with another compliment of various test animals, plants and insects, spent a day in orbit. Unfortunately, all died when the craft’s retrorockets experienced an error during reentry, and the craft had to be intentionally destroyed.

Sputnik 9, which launched on March 9th, 1961, was crewed by spacedog Chernenko (“Blackie”) – as well as a cosmonaut dummy, mice and a guinea pig. The capsule made one orbit before returning to Earth and making a soft landing using a parachute. Chernenko was safely recovered from the capsule.
On March 25th, 1961, the dog Zvyozdocha (“Starlet”) who was named by Yuri Gagarin, made one orbit on board the Sputnik-10 mission with a cosmonaut dummy. This practice flight took place a day before Gagarin’s historic flight on April 12th, 1961, in which he became the first man to go into space. After re-entry, Zvezdochka safely landed and was recovered.
Spacedogs Veterok (“Light Breeze”) and Ugolyok (“Coal”) were launched on board a Voskhod space capsule on Feb. 22nd, 1966, as part of Cosmos 110. This mission, which spent 22 days in orbit before safely landing on March 16th, set the record for longest-duration spaceflight by dogs, and would not be broken by humans until 1971.
Legacy:
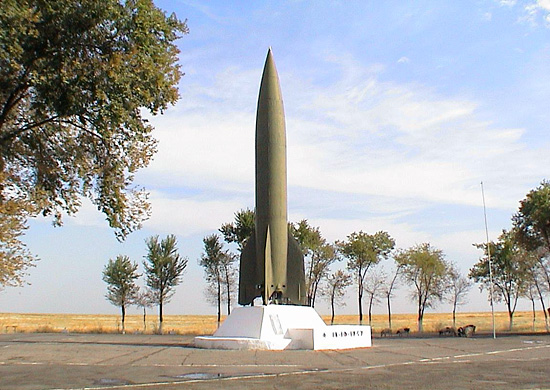
To this day, the dogs that took part in the Soviet space and cosmonaut training program as seen as heroes in Russia. Many of them, Laika in particular, were put on commemorative stamps that enjoyed circulation in Russia and in many Eastern Bloc countries. There are also monuments to the space dogs in Russia.
These include the statue that exists outside of Star City, the Cosmonaut training facility in Moscow. Created in 1997, the monument shows Laika positioned behind a statue of a cosmonaut with her ears erect. The Monument to the Conquerors of Space, which was constructed in Moscow in 1964, includes a bas-relief of Laika along with representations of all those who contributed to the Soviet space program.
On April 11, 2008, at the military research facility in Moscow where Laika was prepped for her mission to space, officials unveiled a monument of her poised inside the fuselage of a space rocket (shown at top). Because of her sacrifice, all future missions involving dogs and other test animals were designed to be recoverable.
Four other dogs died in Soviet space missions, including Bars and Lisichka (who were killed when their R-7 rocket exploded shortly after launch). On July 28, 1960, Pchyolka and Mushka also died when their space capsule was purposely destroyed after a failed re-entry to prevent foreign powers from inspecting the capsule.
However, their sacrifice helped to advance safety procedures and abort procedures that would be used for many decades to come in human spaceflight.
We have written many interesting articles about animals and space flight here at Universe Today. Here’s Who was the First Dog to go Into Space?, What was the First Animal to go into Space?, What Animals Have been to Space?, Who was “Space Dog” Laika?, and Russian Memorial for Space Dog Laika.
For more information, check out Russian dogs lost in space and NASA’s page about the history of animals in space.
Astronomy Cast has an episode on space capsules.
Sources: