With the Scientific Revolution, astronomers became aware of the fact that the Earth and the other planets orbit the Sun. And thanks to Copernicus, Galileo, Kepler, and Newton, the study of their orbits was refined to the point of mathematical precision. And with the subsequent discoveries of Uranus, Neptune, Pluto and the Kuiper Belt Objects, we have come to understand just how varied the orbits of the Solar Planets are.
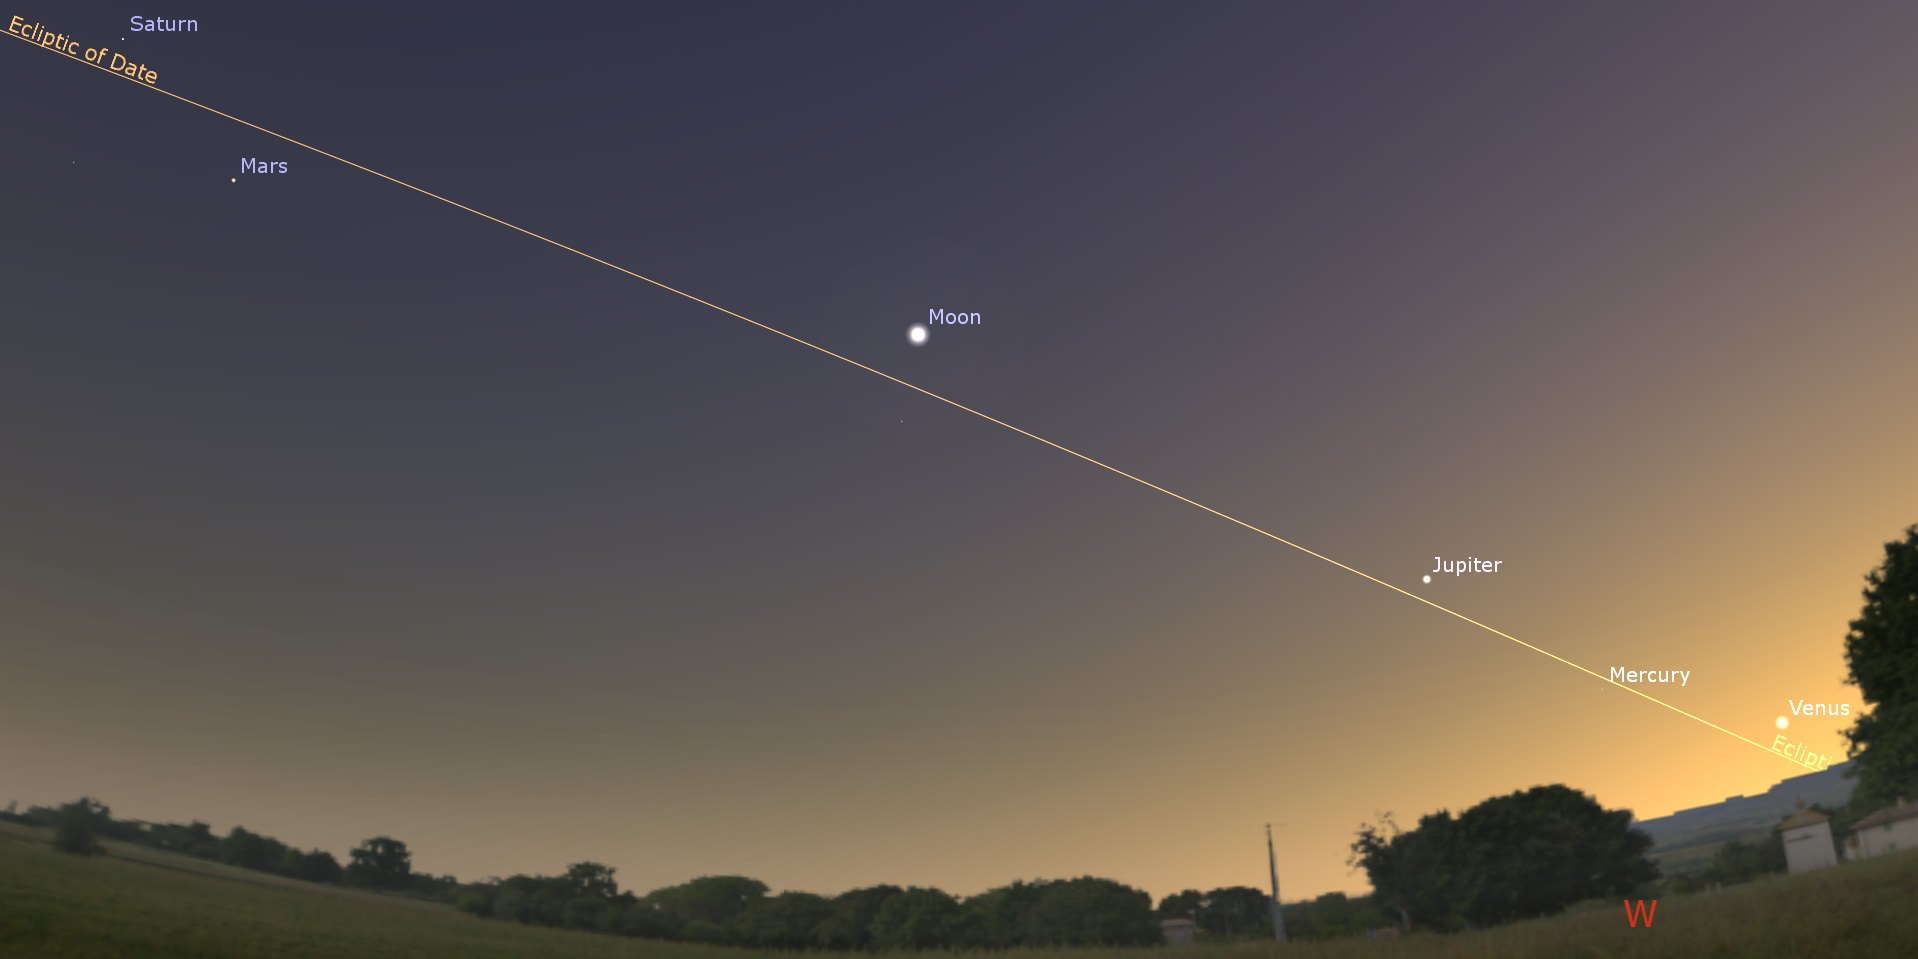
Consider Mars, Earth’s second-closest neighbor, and a planet that is often referred to as “Earth’s Twin”. While it has many things in common with Earth, one area in which they differ greatly is in terms of their orbits. In addition to being farther from the Sun, Mars also has a much more elliptical orbit, which results in some rather interesting variations in temperature and weather patterns.
Perihelion and Aphelion:
Mars orbits the Sun at an average distance (semi-major axis) of 228 million km (141.67 million mi), or 1.524 astronomical units (over one and a half times the distance between Earth and the Sun). However, Mars also has the second most eccentric orbit of all the planets in the Solar System (0.0934), which makes it a distant second to crazy Mercury (at 0.20563).
This means that Mars’ distance from the Sun varies between perihelion (its closest point) and aphelion (its farthest point). In short, the distance between Mars and the Sun ranges during the course of a Martian year from 206,700,000 km (128.437 million mi) at perihelion and 249,200,000 km (154.8457 million mi) at aphelion – or 1.38 AU and 1.666 AU.
Speaking of a Martian year, with an average orbital speed of 24 km/s, Mars takes the equivalent of 687 Earth days to complete a single orbit around the Sun. This means that a year on Mars is equivalent to 1.88 Earth years. Adjusted for Martian days (aka. sols) – which last 24 hours, 39 minutes, and 35 seconds – that works out to a year being 668.5991 sols long (still almost twice as long).
Mars in also the midst of a long-term increase in eccentricity. Roughly 19,000 years ago, it reached a minimum of 0.079, and will peak again at an eccentricity of 0.105 (with a perihelion distance of 1.3621 AU) in about 24,000 years. In addition, the orbit was nearly circular about 1.35 million years ago, and will be again one million years from now.
Axial Tilt:
Much like Earth, Mars also has a significantly tilted axis. In fact, with an inclination of 25.19° to its orbital plane, it is very close to Earth’s own tilt of 23.439°. This means that like Earth, Mars also experiences seasonal variations in terms of temperature. On average, the surface temperature of Mars is much colder than what we experience here on Earth, but the variation is largely the same.

All told, the average surface temperature on Mars is -46 °C (-51 °F). This ranges from a low of -143 °C (-225.4 °F), which takes place during winter at the poles; and a high of 35 °C (95 °F), which occurs during summer and midday at the equator. This means that at certain times of the year, Mars is actually warmer than certain parts of Earth.
Orbit and Seasonal Changes:
Mars’ variations in temperature and its seasonal changes are also related to changes in the planet’s orbit. Essentially, Mars’ eccentric orbit means that it travels more slowly around the Sun when it is further from it, and more quickly when it is closer (as stated in Kepler’s Three Laws of Planetary Motion).
Mars’ aphelion coincides with Spring in its northern hemisphere, which makes it the longest season on the planet – lasting roughly 7 Earth months. Summer is second longest, lasting six months, while Fall and Winter last 5.3 and just over 4 months, respectively. In the south, the length of the seasons is only slightly different.
Mars is near perihelion when it is summer in the southern hemisphere and winter in the north, and near aphelion when it is winter in the southern hemisphere and summer in the north. As a result, the seasons in the southern hemisphere are more extreme and the seasons in the northern are milder. The summer temperatures in the south can be up to 30 K (30 °C; 54 °F) warmer than the equivalent summer temperatures in the north.

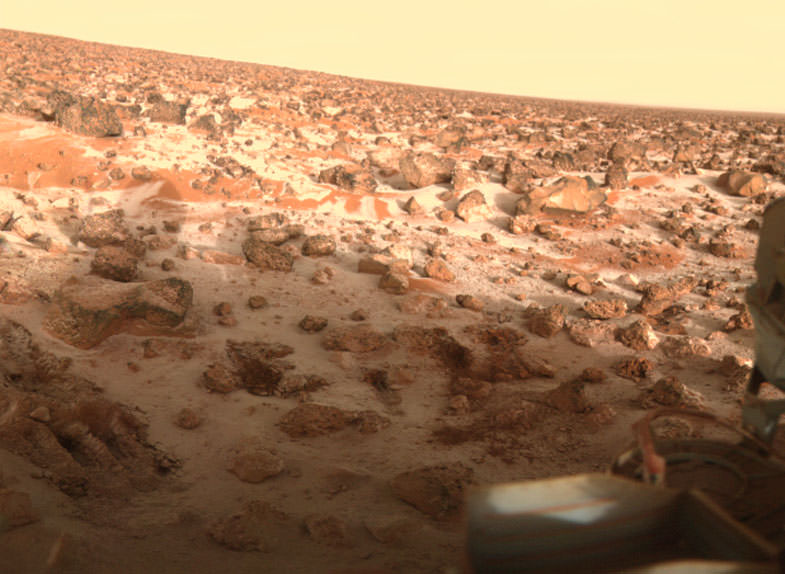
It also snows on Mars. In 2008, NASA’s Phoenix Lander found water ice in the polar regions of the planet. This was an expected finding, but scientists were not prepared to observe snow falling from clouds. The snow, combined with soil chemistry experiments, led scientists to believe that the landing site had a wetter and warmer climate in the past.
And then in 2012, data obtained by the Mars Reconnaissance Orbiter revealed that carbon-dioxide snowfalls occur in the southern polar region of Mars. For decades, scientists have known that carbon-dioxide ice is a permanent part of Mars’ seasonal cycle and exists in the southern polar caps. But this was the first time that such a phenomena was detected, and it remains the only known example of carbon-dioxide snow falling anywhere in our solar system.
In addition, recent surveys conducted by the Mars Reconnaissance Orbiter, the Mars Science Laboratory, the Mars Orbiter Mission (MOM), the Mars Atmosphere and Volatile Evolution (MAVEN) and the Opportunity and Curiosity Rovers have revealed some startling things about Mars’ deep past.
For starters, soil samples and orbital observation have demonstrated conclusively that roughly 3.7 billion years ago, the planet had more water on its surface than is currently in the Atlantic Ocean. Similarly, atmospheric studies conducted on the surface and from space have proven that Mars also had a viable atmosphere at that time, one which was slowly stripped away by solar wind.

Weather Patterns:
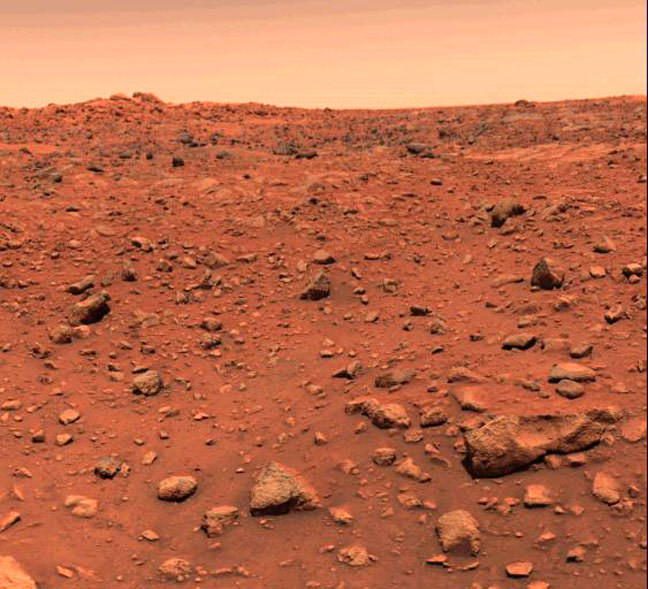
These seasonal variations allow Mars to experience some extremes in weather. Most notably, Mars has the largest dust storms in the Solar System. These can vary from a storm over a small area to gigantic storms (thousands of km in diameter) that cover the entire planet and obscure the surface from view. They tend to occur when Mars is closest to the Sun, and have been shown to increase the global temperature.
The first mission to notice this was the Mariner 9 orbiter, which was the first spacecraft to orbit Mars in 1971, it sent pictures back to Earth of a world consumed in haze. The entire planet was covered by a dust storm so massive that only Olympus Mons, the giant Martian volcano that measures 24 km high, could be seen above the clouds. This storm lasted for a full month, and delayed Mariner 9‘s attempts to photograph the planet in detail.
And then on June 9th, 2001, the Hubble Space Telescope spotted a dust storm in the Hellas Basin on Mars. By July, the storm had died down, but then grew again to become the largest storm in 25 years. So big was the storm that amateur astronomers using small telescopes were able to see it from Earth. And the cloud raised the temperature of the frigid Martian atmosphere by a stunning 30° Celsius.
These storms tend to occur when Mars is closest to the Sun, and are the result of temperatures rising and triggering changes in the air and soil. As the soil dries, it becomes more easily picked up by air currents, which are caused by pressure changes due to increased heat. The dust storms cause temperatures to rise even further, leading to Mars’ experiencing its own greenhouse effect.
We have written many interesting articles about the distance of the planets from the Sun here at Universe Today. Here’s How Far Are the Planets from the Sun?, How Far is Mercury from the Sun?, How Far is Venus from the Sun?, How Far is the Earth from the Sun?, How Far is the Moon from the Sun?, How Far is Jupiter from the Sun?, How Far is Saturn from the Sun?, What is Uranus’ Distance from the Sun?, What is the Distance of Neptune from the Sun? and How Far is Pluto from the Sun?
For more information, Astronomy for beginners teaches you how to calculate the distance to Mars.
Finally, if you’d like to learn more about Mars in general, we have done several podcast episodes about the Red Planet at Astronomy Cast. Episode 52: Mars, and Episode 91: The Search for Water on Mars.


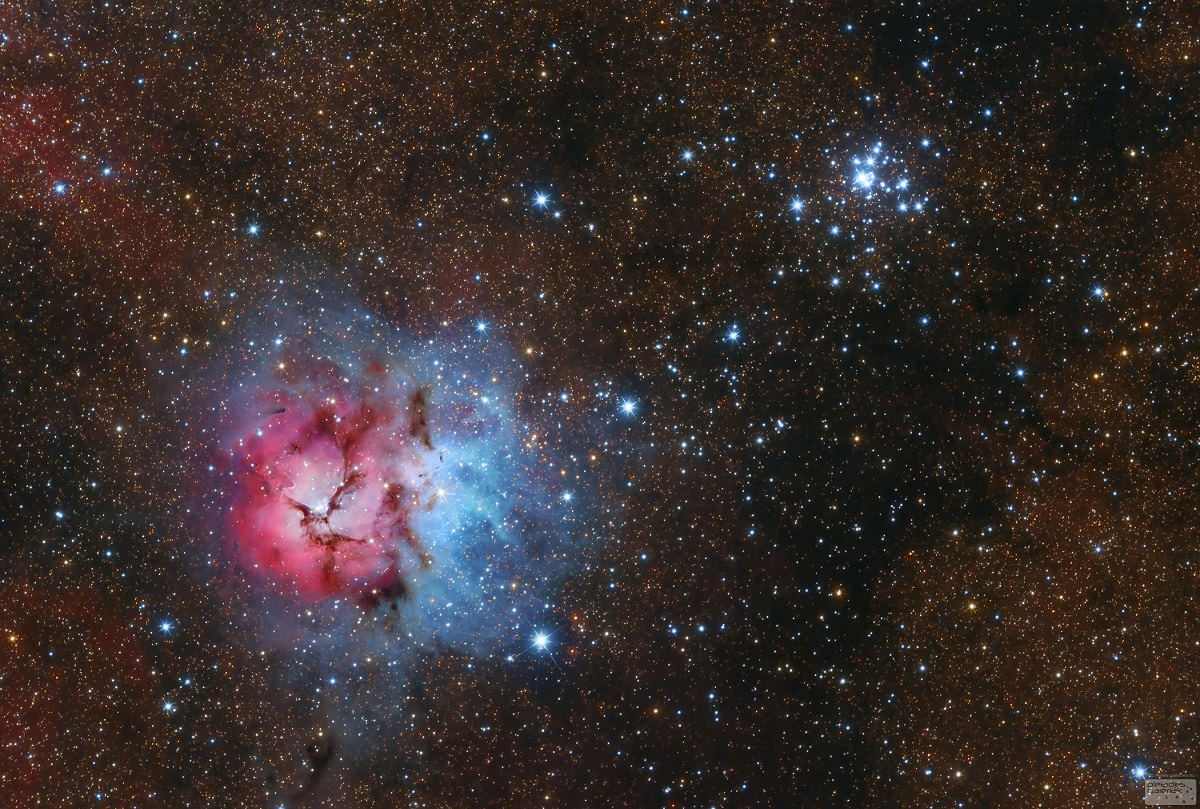
![The Trifid nebula (M20, NGC NGC 6514) in pseudocolor. Image taken with the Palomar 1.5-m telescope. The field of view is 16’ ´ 16’. Red shows [S II] ll 6717+6731. Green shows Ha l 6563. Blue shows [O III] l 5007. The WFPC2 field of view is indicated. Image: Jeff Hester (Arizona State University), Palomar telescope.](https://www.universetoday.com/wp-content/uploads/2009/06/Trifid-Nebula-M20-e1469471610624-580x515.jpg)