Welcome back to Messier Monday! In our ongoing tribute to the great Tammy Plotner, we take a look at the Messier 17 nebula – aka. The Omega Nebula (and a few other names).
In the 18th century, while searching the night sky for comets, French astronomer Charles Messier began noticing a series of “nebulous objects” in the night sky. Hoping to ensure that other astronomers did not make the same mistake, he began compiling a list of these objects,. Known to posterity as the Messier Catalog, this list has come to be one of the most important milestones in the research of Deep Sky objects.
One of these is the star-forming nebula known as Messier 17 – or as it’s more famously known, the Omega Nebula (or Swan Nebula, Checkmark Nebula, and Horseshoe Nebula). Located in the Sagittarius constellation, this beautiful nebula is considered one of the brightest and most massive star-forming regions in our galaxy.
Description:
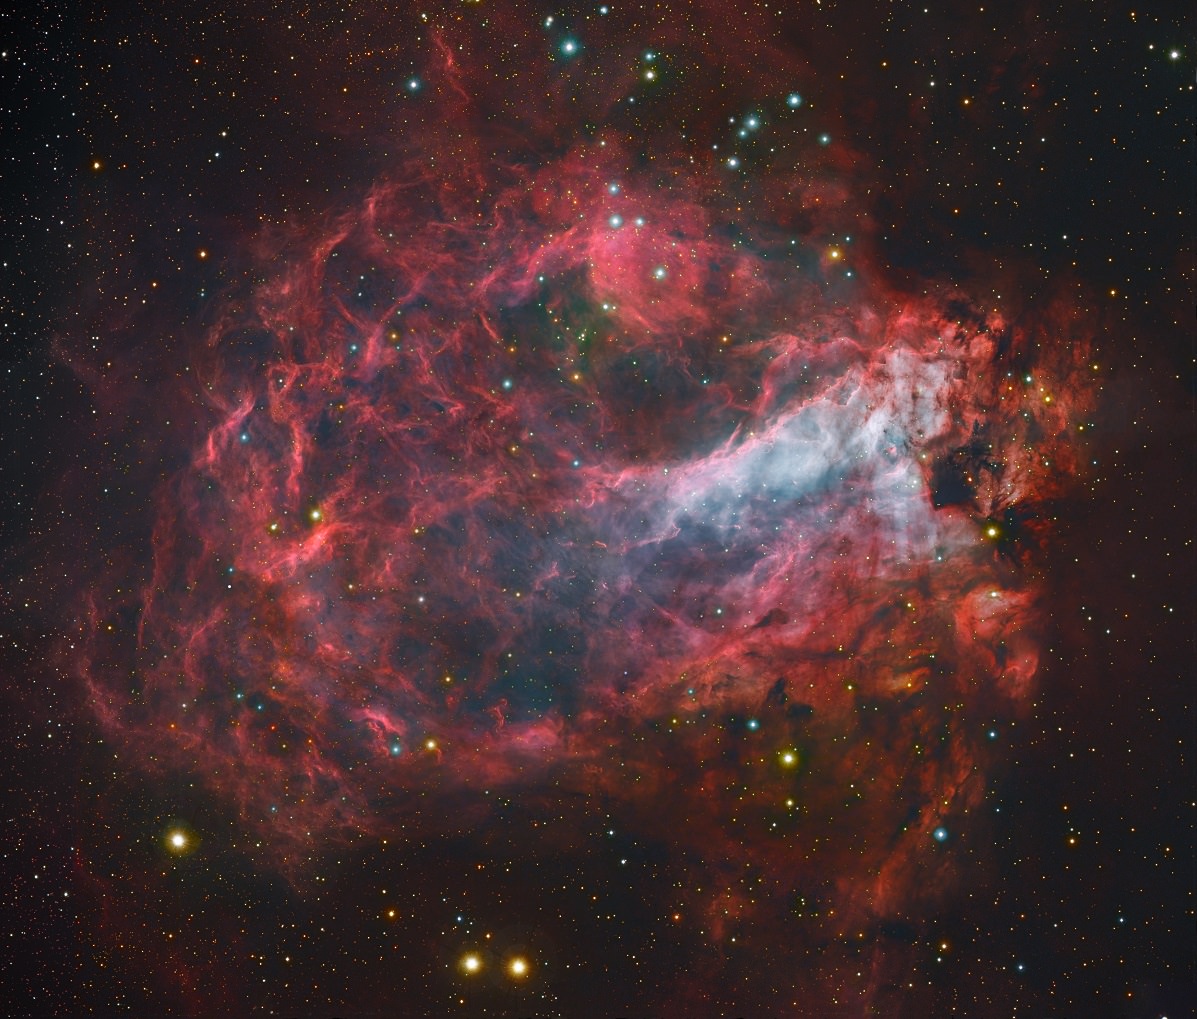
From its position in space some 5,000 to 6,000 light years from Earth, the “Omega” nebula occupies a region as large as 40 light years across, with its brightest porition covering a 15 light year expanse. Like many nebulae, this giant cosmic cloud of interstellar matter is a starforming region in the Sagittarius or Sagittarius-Carina arm of our Milky Way galaxy.
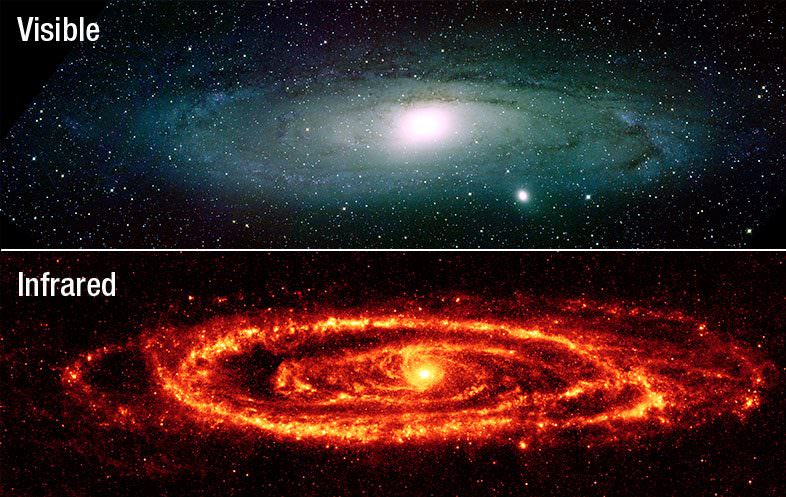
What you see is the hot hydrogen gas that is illuminated when its particles are excited by the hottest of the stars that have just formed within the nebula. Also, some of the light is being reflected by the nebula’s own dust. These remain hidden by dark obscuring material, and we know their presence only through the detection of their infrared radiation.
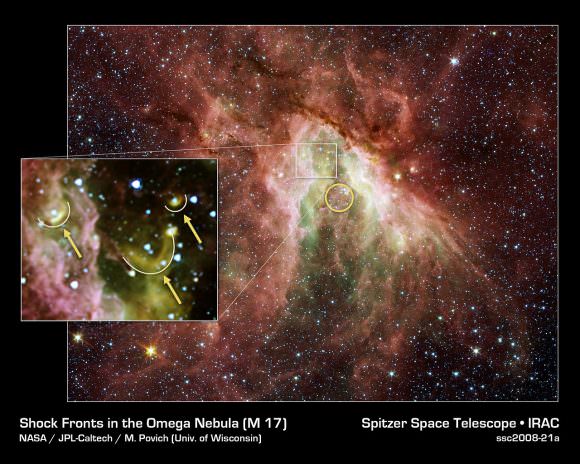
In an study titled “Interstellar Weather Vanes: GLIMPSE Mid-Infrared Stellar-Wind Bowshocks in M17 and RCW49“, astronomer Matthew S. Povich (et al.) of the University of Wisconsin-Madison said of M17:
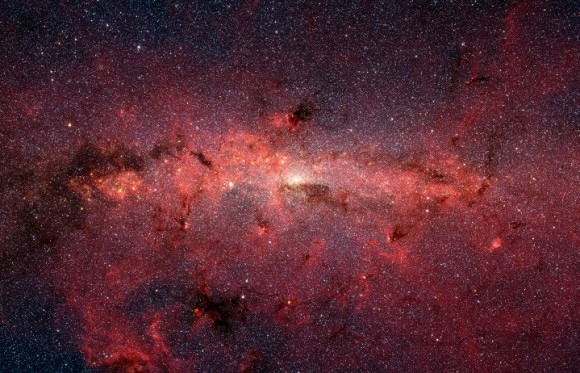
“We report the discovery of six infrared stellar-wind bowshocks in the Galactic massive star formation regions M17 and RCW49 from Spitzer GLIMPSE (Galactic Legacy Infrared Mid-Plane Survey Extraordinaire) images. The InfraRed Array Camera (IRAC) on the Spitzer Space Telescope clearly resolves the arc-shaped emission produced by the bowshocks. We use the stellar SEDs to estimate the spectral types of the three newly-identified O stars in RCW49 and one previously undiscovered O star in M17. One of the bowshocks in RCW49 reveals the presence of a large-scale flow of gas escaping the HII region. Radiation-transfer modeling of the steep rise in the SED of this bowshock toward longer mid-infrared wavelengths indicates that the emission is coming principally from dust heated by the star driving the shock. The other 5 bowshocks occur where the stellar winds of O stars sweep up dust in the expanding HII regions.”
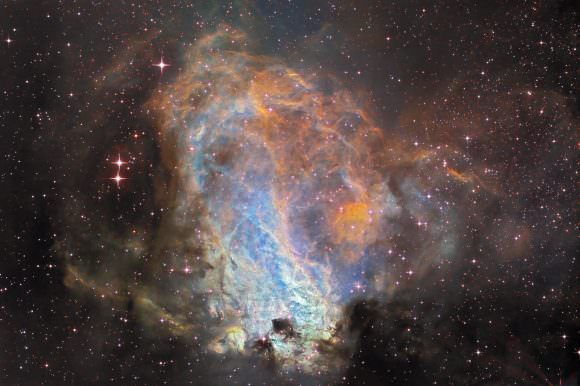
Is Messier 17 still actively producing stars? You bet. Even protostars have been discovered hiding in its folds. As M. Nielbock (et al), wrote in 2008:
“For the first time, we resolve the elongated central infrared emission of the large accretion disk in M 17 into a point-source and a jet-like feature that extends to the northeast. We regard the unresolved emission as to originate from an accreting intermediate to high-mass protostar. In addition, our images reveal a weak and curved southwestern lobe whose morphology resembles that of the previously detected northeastern one. We interpret these lobes as the working surfaces of a recently detected jet interacting with the ambient medium at a distance of 1700 AU from the disk centre. The accreting protostar is embedded inside a circumstellar disk and an envelope causing a visual extinction. This and its K-band magnitude argue in favour of an intermediate to high-mass object, equivalent to a spectral type of at least B4. For a main-sequence star, this would correspond to a stellar mass of 4 M.”
How many new stars lay hidden inside? Far more than the famous Orion nebula may contain. So says a 2013 study produced by L. Eisa (et al):
“The complex resembles the Orion Nebula/KL region seen nearly edge-on: the bowl-shaped ionization blister is eroding the edge of the clumpy molecular cloud and triggering massive star formation, as evidenced by an ultra-compact HII region and luminous protostars. Only the most massive members of the young NGC 6618 stellar cluster exciting the nebula have been characterized, due to the comparatively high extinction. Near-infrared imagery and spectroscopy reveal an embedded cluster of about 100 stars earlier than B9. These studies did not cover the entire cluster, so even more early stars may be present. This is substantially richer than the Orion Nebula Cluster which has only 8 stars between O6 and B9.”
History of Observation:
The Omega Nebula was first discovered by Philippe Loys de Cheseaux and is just one of the six nebulae in his documents. As he wrote of his discovery:
“Finally, another nebula, which has never been observed. It is of a completely different shape than the others: It has perfectly the form of a ray, or of the tail of a comet, of 7′ length and 2′ broadth; its sides are exactly parallel and rather well terminated, as are its two ends. Its middle is whiter than the border.” Because De Cheseaux’s work wasn’t widely read, Charles Messier independently rediscovered it on June 3, 1764 and cataloged it in his own way: “In the same night, I have discovered at little distance of the cluster of stars of which I just have told, a train of light of five or six minutes of arc in extension, in the shape of a spindle, and in almost the same as that in the girdle of Andromeda; but of a very faint light, not containing any star; one can see two of them nearby which are telescopic and placed parallel to the Equator: in a good sky one perceives very well that nebula with an ordinary refractor of 3 feet and a half. I have determined its position in right ascension of 271d 45′ 48″, and its declination of 16d 14′ 44” south.“
By historical accounts, it was Sir William Herschel who may have truly had a little bit of insight on what this object might one day mean when he observed it on his own and reported:
“1783, July 31. A very singular nebula; it seems to be the link to join the nebula in Orion to others, for this is not without a possibility of being stars. I think a great deal more of light and a much higher power would be of service. 1784, June 22 (Sw. 231). A wonderful nebula. Very much extended, with a hook on the preceding [Western] side; the nebulosity of the milky kind; several stars visible in it, but they seem to have no connection with the nebula, which is far more distant. I saw it only through short intervals of flying clouds and haziness; but the extent of the light including the hook is above 10′. I suspect besides, that on the following [Eastern] side it goes on much farther and diffuses itself towards the north and south. It is not of equal brightness throughout and has one or more places where the milky nebulosity seems to degenerate into the resolvable [mottled] kind; such a one is that just following the hook towards the north. Should this be confirmed on a very fine night, it would bring on the step between these two nebulosities which is at present wanting, and would lead us to surmise that this nebula is a stupendous stratum of immensely distant fixed stars, some of whose branches come near enough to us to be visible as a resolvable nebulosity, while the rest runs on to so great a distance as only to appear under the milky form.”
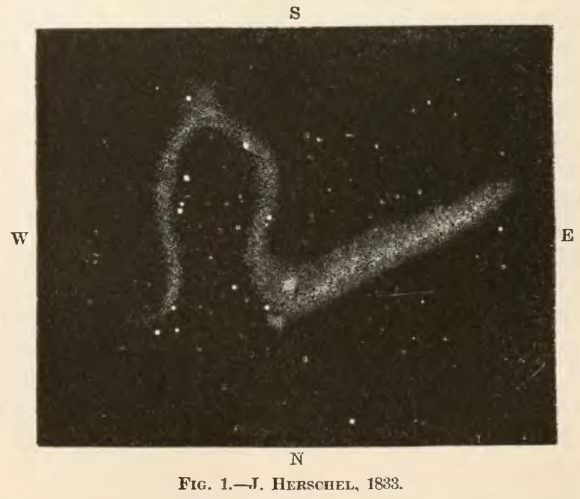
So where did the name “Omega Nebula” come from? That credit goes to John Herschel, who stated in his observing notes:
“The figure of this nebula is nearly that of the Greek capital Omega, somewhat distorted and very unequally bright. It is remarkable that this is the form usually attributed to the great nebula in Orion, though in that nebula I confess I can discern no resemblence whatever to the Greek letter. Messier perceived only the bright preceding branch of the nebula now in question, without any of the attached convolutions which were first noticed by my Father. The chief peculiarities which I have observed in it are, 1st, the resolvable knot in the following portion of the bright branch, which is in a considerable degree insulated from the surrounding nebula; strongly suggesting the idea of an absorption of nebulous matter; and 2ndly, the much feebler and smaller knot in the north preceding end of the same branch, where the nebula makes a sudden bend at an acute angle. With a view to a more exact representation of this curious nebula, I have at different times taken micrometrical measures of the relative places of the stars in and near it, by which, when laid down on the chart, its limits may be traced and identified, as I hope soon to have better opportunity to do than its low situation in this latitudes will permit.”
Locating Messier 17:
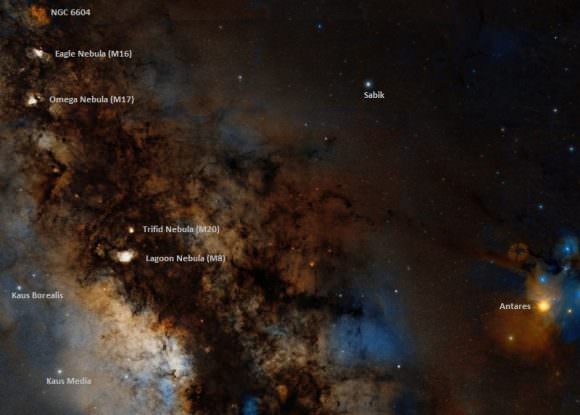
Because M17 is both large and quite bright, its distinctive “2” shape isn’t hard to make out in optics of any size. For binoculars and image correct finderscopes, try starting with the constellation of Aquila and begin tracing the stars down the eagle’s back to Lambda. When you reach that point, continue to extend the line through to Alpha Scuti, then southwards towards Gamma Scuti. M16 is slightly more than 2 degrees (about a fingerwidth) southwest of this star.
If you are in a dark sky location, you can also identify it easily in binoculars by starting at the M24 “Star Cloud”, north of Lambda Sagittari (the teapot lid star), and simply scanning north. This nebula is bright enough to even cut through moderately light polluted skies with ease, but don’t expect to see it when the Moon is nearby. You’ll enjoy the rich starfields combined with an interesting nebula in binoculars, while telescopes will easily begin resolving the interior stars.
And here are the quick facts on M17 for your convenience:
Object Name: Messier 17
Alternative Designations: M17, NGC 6618, Omega, Swan, Horseshoe, or Lobster Nebula
Object Type: Open Star Cluster with Emission Nebula
Constellation: Sagittarius
Right Ascension: 18 : 20.8 (h:m)
Declination: -16 : 11 (deg:m)
Distance: 5.0 (kly)
Visual Brightness: 6.0 (mag)
Apparent Dimension: 11.0 (arc min)
And be sure to enjoy this video from the European Southern Observatory (ESO) that shows this nebula in all its glory:
We have written many interesting articles about Messier Objects here at Universe Today. Here’s Tammy Plotner’s Introduction to the Messier Objects, , M1 – The Crab Nebula, M8 – The Lagoon Nebula, and David Dickison’s articles on the 2013 and 2014 Messier Marathons.
Be to sure to check out our complete Messier Catalog. And for more information, check out the SEDS Messier Database.