We’re always talking about Pluto, or Saturn or Mars. But nobody ever seems to talk about Jupiter any more. Why is that? I mean, it’s the largest planet in the Solar System. 318 times the mass of the Earth has got to count for something, right? Right?

Jupiter with Io and Ganymede taken by amateur astronomer Damian Peach. Credit: NASA / Damian Peach
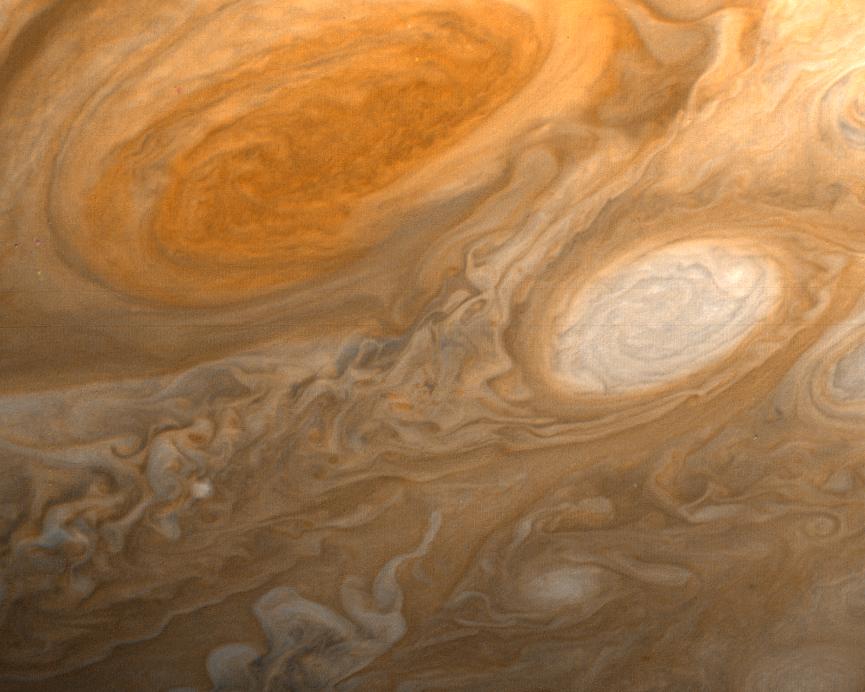
Jupiter is one of the most important places in the Solar System. The planet itself is impressive; with ancient cyclonic storms larger than the Earth, or a magnetosphere so powerful it defies comprehension.
One of the most compelling reasons to visit Jupiter is because of its moons. Europa, Callisto and Ganymede might all contain vast oceans of liquid water underneath icy shells. And as you probably know, wherever we find liquid water on Earth, we find life.
And so, the icy moons of Jupiter are probably the best place to look for life in the entire Solar System.
And yet, as I record this video in early 2016, there are no spacecraft at Jupiter or its moons. In fact, there haven’t been any there for years. The last spacecraft to visit Jupiter was NASA’s New Horizons in 2007. Mars is buzzing with orbiters and rovers, we just got close up pictures of Pluto! and yet we haven’t seen Jupiter close up in almost 10 years. What’s going on?
Part of the problem is that Jupiter is really far away, and it takes a long time to get there.
How long? Let’s take a look at all the spacecraft that have ever made this journey.
The first spacecraft to ever cross the gulf from the Earth to Jupiter was NASA’s Pioneer 10. It launched on March 3, 1972 and reached on December 3, 1973. That’s a total of 640 days of flight time.
But Pioneer 10 was just flying by, on its way to explore the outer Solar System. It came within 130,000 km of the planet, took the first close up pictures ever taken of Jupiter, and then continued on into deep space for another 11 years before NASA lost contact.
Pioneer 11 took off a year later, and arrived a year later. It made the journey in 606 days, making a much closer flyby, getting within 21,000 kilometers of Jupiter, and visiting Saturn too.
Next came the Voyager spacecraft. Voyager 1 took only 546 days, arriving on March 5, 1979, and Voyager 2 took 688 days.
So, if you’re going to do a flyby, you’ll need about 550-650 days to make the journey.
But if you actually want to slow down and go into orbit around Jupiter, you’ll need to take a much slower journey. The only spacecraft to ever stick around Jupiter was NASA’s Galileo spacecraft, which launched on October 18, 1989.
Instead of taking the direct path to Jupiter, it made two gravitational assisting flybys of Earth and one of Venus to pick up speed, finally arriving at Jupiter on December 8, 1995. That’s a total of 2,242 days.
So why did Galileo take so much longer to get to Jupiter? It’s because you need to be going slow enough that when you reach Jupiter, you can actually enter orbit around the planet, and not just speed on past.
And now, after this long period of Jupiterlessness, we’re about to have another spacecraft arrive at the massive planet and go into orbit. NASA’s Juno spacecraft was launched back on August 5, 2011 and it’s been buzzing around the inner Solar System, building up the velocity to make the journey to Jupiter.

NASA’s Juno spacecraft launched on August 6, 2011 and should arrive at Jupiter on July 4, 2016. Credit: NASA / JPL
It did a flyby of Earth back in 2013, and if everything goes well, Juno will make its orbital insertion into the Jovian system on July 4, 2016. Total flight time: 1,795 days.
Once again, we’ll have a spacecraft observing Jupiter and its moon.s
This is just the beginning. There are several more missions to Jupiter in the works. The European Space Agency will be launching the Jupiter Icy Moons Mission in 2022, which will take nearly 8 years to reach Jupiter by 2030.
NASA’s Europa Multiple-Flyby Mission [Editor’s note: formerly known as the Europa Clipper] will probably launch in the same timeframe, and spend its time orbiting Europa, trying to get a better understand the environment on Europa. It probably won’t be able to detect any life down there, beneath the ice, but it’ll figure out exactly where the ocean starts.
So, how long does it take to get to Jupiter? Around 600 days if you want to just do a flyby and aren’t planning to stick around, or about 2,000 days if you want to actually get into orbit.