What Is a Tsunami?

11 March 2011: The wave from a tsunami crashes over a street in Miyako City, Japan Credit: REUTERS/Mainichi Shimbun

For people living in oceanfront communities, the prospect of a tsunami is a frightening one. Much like earthquakes, volcanoes, hurricanes and tornadoes, tsunamis are one of the most destructive natural forces on the planet. And much like these other phenomena, they require the right conditions to happen and are more common in some areas of the world than others.

Knowing how and when a tsunami will strike has therefore a subject of great interest for scientists over the ages. But for anyone who has lived in certain parts of the world where “tsunami zones” are common – namely Japan and the South Pacific – it is a matter of survival.

Definition:
Numerous terms are used in the English language to describe large waves created by the displacement of water, with varying degrees of accuracy. The term tsunami, for example, is literally translated from Japanese to mean “harbor wave”. There are only a few other languages that have an equivalent native word, though similar meanings can be found in Indonesia, Sri Lanka, and the Indian Subcontinent.

The term tidal wave has also been used, which is derived from the most common appearance of a tsunami – an extraordinarily high tidal bore. However, in recent years, the term “tidal wave” has fallen out of favor with the scientific community because tsunami actually have nothing to do with tides, which are produced by the gravitational pull of the moon and sun rather than the displacement of water.
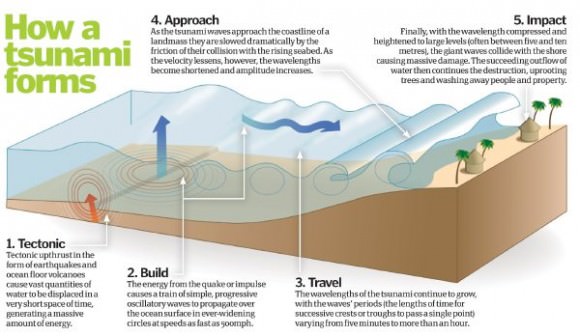
Tsunamis initiate when an earthquake causes the seabed to rupture, which leads to a rapid decrease in sea surface height directly above it. Credit: howitworksdaily.com

The term seismic sea wave also is used to refer to the phenomenon, due to the fact that the waves most often are generated by seismic activity such as earthquakes. However, like “tsunami,” “seismic sea wave” is not a completely accurate term, as forces other than earthquakes – including underwater landslides, volcanic eruptions, underwater explosions, land or ice slumping into the ocean, meteorite impacts, or even sudden changes in weather – can generate such waves by displacing water.

Causes:
The principal cause of a tsunami is the displacement of a substantial volume of water or perturbation of the sea. This is usually the result of earthquakes, landslides, volcanic eruptions, glacier calvings, or more rarely by meteorites and nuclear tests. The waves formed in this way are then sustained by gravity.

Tectonic earthquakes trigger tsunamis when the sea floor abruptly deforms and vertically displaces the water above. More specifically, a tsunami can be generated when thrust faults associated with convergent or destructive plate boundaries move abruptly and displace water.

Tsunamis have a small amplitude (wave height) offshore, and a very long wavelength (often hundreds of kilometers long), and only grow in height when they reach shallower water. Once there, the wavelength shortens as the wave encounters resistance, thus increasing the amplitude increases and causing the wave to rears up in a massive tidal bore.

In the 1950s, it was discovered that tsunamis larger than what had previously been believed possible could be caused by giant submarine landslides. These rapidly displace large water volumes, as energy transfers to the water at a rate faster than the water can absorb. Their existence was confirmed in 1958, when a giant landslide in Lituya Bay, Alaska, caused the highest wave ever recorded (524 meters/1700 feet).

 A village near the coast of Sumatra that was devastated by the 2004 Tsunami. Credit: US Navy
A village near the coast of Sumatra that was devastated by the Tsunami that struck South-East Asia in 2004. Credit: US Navy/Public Domain

In general, landslides generate displacements mainly in the shallower parts of the coastline, such as in closed bays and lakes. But an open oceanic landslide large enough to cause a tsunami across an ocean has not yet happened since the advent of modern seismology, and only rarely in human history.

Meteorological phenomena, such tropical cyclones, can generate a storm surge that will cause sea levels to rise, often in coastal regions. These are what is known as meteotsunamis, which are tsunamis triggered by sudden changes in weather. When such tsunamis reach shore, they rear up in shallows and surge laterally, just like earthquake-generated tsunamis.

Tsunamis can also be triggered by external factors, such as meteors or human intervention. For instance, when a meteor of significant strikes a region of the ocean, the resulting impact is enough to displace high volumes of water, thus triggering a tsunami. There has also been much speculation since World War II of how a nuclear detonations have trigger a tsunami, but all attempts at research (especially in the Pacific) have yielded poor results.

Characteristics and Effects:
Tsunamis can travel at well over 800 kilometers per hour (500 mph), but as they approach the coast, wave shoaling compresses the wave and its speed decreases to below 80 kilometers per hour (50 mph). A tsunami in the deep ocean has a much larger wavelength of up to 200 kilometers (120 mi), but diminishes to less than 20 kilometers (12 mi) when it reaches shallow water.

When the tsunami’s wave peak reaches the shore, the resulting temporary rise in sea level is termed run up. Run up is measured in metres above a reference sea level. A large tsunami may feature multiple waves arriving over a period of hours, with significant time between the wave crests.

Tsunamis cause damage by two mechanisms. First, there is the smashing force of a wall of water traveling at high speed, while the second is the destructive power of a large volume of water draining off the land and carrying a large amount of debris with it.

It is often difficult for people to recognize a tsunami in the open ocean because the waves are much smaller further out at sea than they are close to shore. As with earthquakes, several attempts have been made to set up scales of tsunami intensity or magnitude to allow comparison between different events.
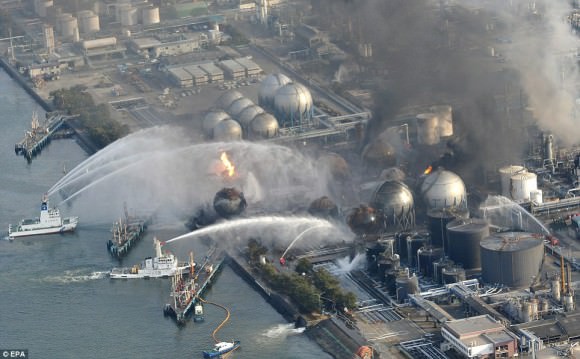
Ships try to extinguish a blaze at oil refinery tanks in Ichihara, Chiba Prefecture, which has been burning since Friday's earthquake and tsunami Read more: http://www.dailymail.co.uk/news/article-1366395/Japan-tsunami-earthquake-Rescuers-pick-way-apocalypse-wasteland.html#ixzz3dvVfz0hr Follow us: @MailOnline on Twitter | DailyMail on Facebook Credit: EPA
Ships try to extinguish a blaze at oil refinery tanks in Ichihara, Chiba Prefecture, after the tsunami that struck in March, 2011. Credit: EPA

The first scales used routinely to measure the intensity of tsunami were the Sieberg-Ambraseys scale, used in the Mediterranean Sea and the Imamura-Iida intensity scale, used in the Pacific Ocean. This latter scale was modified by Soloviev to become the Soloviev-Imamura tsunami intensity scale, which is used in the global tsunami catalogs compiled by the NGDC/NOAA and the Novosibirsk Tsunami Laboratory as the main parameter for the size of the tsunami.

In 2013, following the intensively studied tsunamis in 2004 and 2011, a new 12 point scale was proposed, known as the Integrated Tsunami Intensity Scale (ITIS-2012). This scale was intended to match as closely as possible to the modified ESI2007 and EMS earthquake intensity scales.

Tsunamis throughout History:
Japan and the Pacific Ocean may have the longest recorded history of tsunamis, but they are an often underestimated hazard in the Mediterranean Sea region and Europe in general. In his History of the Peloponnesian War (426 BCE), Greek historian Thucydides offered what could be considered the first recorded speculation about the causes of tsunamis – where he argued that earthquakes at sea were the reason for them.
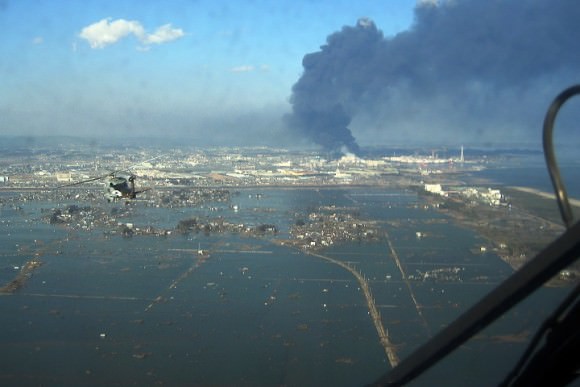
An aerial view of tsunami damage in T?hoku. Credit: US Navy
An aerial view of tsunami damage in Tohoku. Credit: US Navy

After the tsunami of 365 CE devastated Alexandria, Roman historian Ammianus Marcellinus described the typical sequence of a tsunami. His descriptions included an earthquake and the sudden retreat of the sea, followed by a gigantic wave.

More modern examples include the 1755 Lisbon earthquake and tsunami (which was caused by activity in the Azores–Gibraltar Transform Fault); the 1783 Calabrian earthquakes, which caused several ten thousand deaths; and the 1908 Messina earthquake and tsunami – which caused 123,000 deaths in Sicily and Calabria and is considered one of the most deadly natural disasters in modern European history.

But by far, the 2004 Indian Ocean earthquake and tsunami was the most devastating of its kind in modern times, killing around 230,000 people and laying waste to communities throughout Indonesia, Thailand, and Southern Asia.

In 2010, an earthquake triggered a tsunami which devastated several coastal towns in south-central Chile, damaged the port at Talcahuano and caused 4334 confirmed fatalities. The earthquake also generated a blackout that affected 93 percent of the Chilean population.

In 2011, an earthquake off the Pacific coast of Tohoku led to a tsunami that struck Japan and led to 5,891 deaths, 6,152 injuries, and 2,584 people to be declared missing across twenty prefectures. The tsunami also caused meltdowns at three reactors in the Fukushima Daiichi Nuclear Power Plant complex.

Tsunamis are a force of nature, without a doubt. And knowing when, where, and how severely they will strike is intrinsic to ensuring that we can limit the damage they do cause.

Universe Today has articles on about tsunamis and causes of tsunamis.

For more information, try tsunami and causes of tsunamis.

Astronomy Cast has an episode on Earth.

Source:
Wikipedia

What is the Biggest Planet in the Solar System?

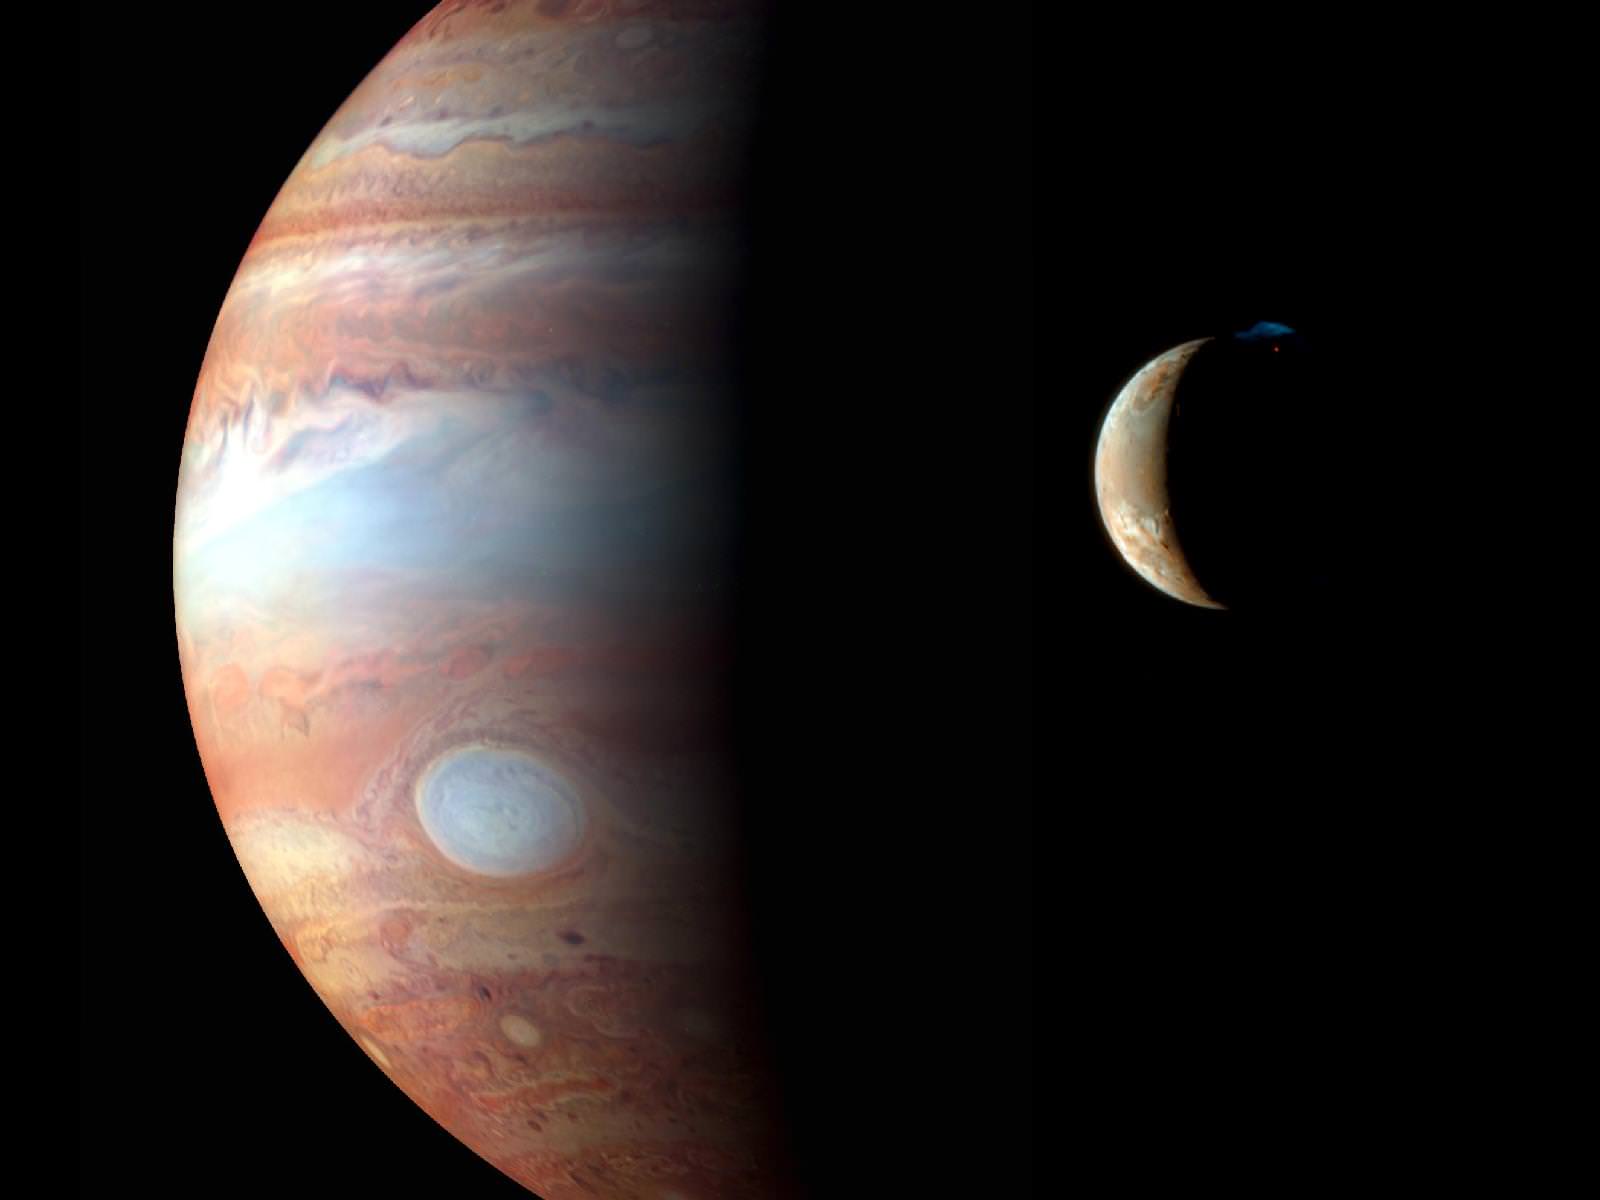
Jupiter and Io
Io and Jupiter as seen by New Horizons during its 2008 flyby. (Credit: NASA/Johns Hopkins University APL/SWRI).

Ever since the invention of the telescope four hundred years ago, astronomers have been fascinated by the gas giant of Jupiter. Between it’s constant, swirling clouds, its many, many moons, and its Giant Red Spot, there are many things about this planet that are both delightful and fascinating.

But perhaps the most impressive feature about Jupiter is its sheer size. In terms of mass, volume, and surface area, Jupiter is the biggest planet in our Solar System by a wide margin. But just what makes Jupiter so massive, and what else do we know about it?

Size and Mass:

Jupiter’s mass, volume, surface area and mean circumference are 1.8981 x 1027 kg, 1.43128 x 10¹⁵ km3, 6.1419 x 10¹⁰ km2, and 4.39264 x 10⁵ km respectively. To put that in perspective, Jupiter diameter is roughly 11 times that of Earth, and 2.5 the mass of all the other planets in the Solar System combined.

But, being a gas giant, Jupiter has a relatively low density – 1.326 g/cm3 – which is less than one quarter of Earth’s. This means that while Jupiter’s volume is equivalent to about 1,321 Earths, it is only 318 times as massive. The low density is one way scientists are able to determine that it is made mostly of gases, though the debate still rages on what exists at its core (see below).

Composition:

Jupiter is composed primarily of gaseous and liquid matter. It is the largest of the gas giants, and like them, is divided between a gaseous outer atmosphere and an interior that is made up of denser materials. Its upper atmosphere is composed of about 88–92% hydrogen and 8–12% helium by percent volume of gas molecules, and approx. 75% hydrogen and 24% helium by mass, with the remaining one percent consisting of other elements.

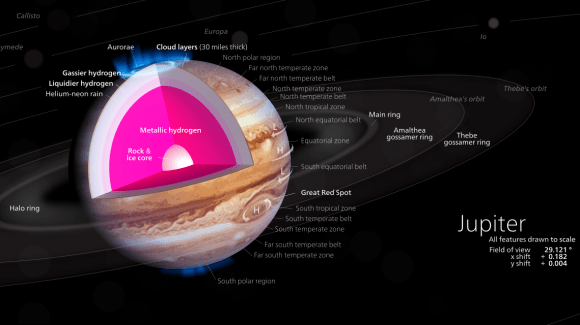
This cut-away illustrates a model of the interior of Jupiter, with a rocky core overlaid by a deep layer of liquid metallic hydrogen. Credit: Kelvinsong/Wikimedia Commons

The atmosphere contains trace amounts of methane, water vapor, ammonia, and silicon-based compounds as well as trace amounts of benzene and other hydrocarbons. There are also traces of carbon, ethane, hydrogen sulfide, neon, oxygen, phosphine, and sulfur. Crystals of frozen ammonia have also been observed in the outermost layer of the atmosphere.

The interior contains denser materials, such that the distribution is roughly 71% hydrogen, 24% helium and 5% other elements by mass. It is believed that Jupiter’s core is a dense mix of elements – a surrounding layer of liquid metallic hydrogen with some helium, and an outer layer predominantly of molecular hydrogen. The core has also been described as rocky, but this remains unknown as well.

In 1997, the existence of the core was suggested by gravitational measurements, indicating a mass of from 12 to 45 times the Earth’s mass, or roughly 4%–14% of the total mass of Jupiter. The presence of a core is also supported by models of planetary formation that indicate how a rocky or icy core would have been necessary at some point in the planet’s history in order to collect its bulk of hydrogen and helium from the protosolar nebula.

However, it is possible that this core has since shrunk due to convection currents of hot, liquid, metallic hydrogen mixing with the molten core. This core may even be absent now, but a detailed analysis is needed before this can be confirmed. The Juno mission, which launched in August 2011, is expected to provide some insight into these questions, and thereby make progress on the problem of the core.

The temperature and pressure inside Jupiter increase steadily toward the core. At the “surface”, the pressure and temperature are believed to be 10 bars and 340 K (67 °C, 152 °F). At the “phase transition” region, where hydrogen becomes metallic, it is believed the temperature is 10,000 K (9,700 °C; 17,500 °F) and the pressure is 200 GPa. The temperature at the core boundary is estimated to be 36,000 K (35,700 °C; 64,300 °F) and the interior pressure at roughly 3,000–4,500 GPa.

Moons:

The Jovian system currently includes 67 known moons. The four largest are known as the Galilean Moons, which are named after their discoverer, Galileo Galilei. They include: Io, the most volcanically active body in our Solar System; Europa, which is suspected of having a massive subsurface ocean; Ganymede, the largest moon in our Solar System; and Callisto, which is also thought to have a subsurface ocean and features some of the oldest surface material in the Solar System.

Then there’s the Inner Group (or Amalthea group), which is made up of four small moons that have diameters of less than 200 km, orbit at radii less than 200,000 km, and have orbital inclinations of less than half a degree. This groups includes the moons of Metis, Adrastea, Amalthea, and Thebe. Along with a number of as-yet-unseen inner moonlets, these moons replenish and maintain Jupiter’s faint ring system.

Jupiter also has an array of Irregular Satellites, which are substantially smaller and have more distant and eccentric orbits than the others. These moons are broken down into families that have similarities in orbit and composition, and are believed to be largely the result of collisions from large objects that were captured by Jupiter’s gravity.

Illustration of Jupiter and the Galilean satellites. Credit: NASA

Interesting Facts:

Much like Earth, Jupiter experiences auroras near its northern and southern poles. But on Jupiter, the auroral activity is much more intense and rarely ever stops. The intense radiation, Jupiter’s magnetic field, and the abundance of material from Io’s volcanoes that react with Jupiter’s ionosphere creates a light show that is truly spectacular.

Jupiter also has a violent atmosphere. Winds in the clouds can reach speeds of up to 620 kph (385 mph). Storms form within hours and can become thousands of km in diameter overnight. One storm, the Great Red Spot, has been raging since at least the late 1600s. The storm has been shrinking and expanding throughout its history; but in 2012, it was suggested that the Giant Red Spot might eventually disappear.

The discovery of exoplanets has revealed that planets can get even bigger than Jupiter. In fact, the number of “Super Jupiters” observed by the Kepler space probe (as well as ground-based telescopes) in the past few years has been staggering. In fact, as of 2015, more than 300 such planets have been identified.

Notable examples include PSR B1620-26 b (Methuselah), which was the first super-Jupiter to be observed (in 2003). At 12.7 billion years of age, it is also the third oldest known planet in the universe. There’s also HD 80606 b (Niobe), which has the most eccentric orbit of any known planet, and 2M1207b (Lerna), which orbits the brown dwarf Fomalhaut b (Illion).

Scientist theorize that a gas gain could get 15 times the size of Jupiter before it began deuterium fusion, making it a brown dwarf star. Good thing too, since the last thing the Solar System needs if for Jupiter to go nova!

Jupiter was appropriately named by the ancient Romans, who chose to name after the king of the Gods (Jupiter, or Jove). The more we have come to know and understand about this most-massive of Solar planets, the more deserving of this name it appears.

If you’re wondering, here’s how big planets can get with a lot of mass, and here’s what is the biggest star in the Universe. And here’s the 2nd largest planet in the Solar System.

Here’s another article about the which is the largest planet in the Solar System, and here’s what’s the smallest planet in the Solar System.

We have recorded a whole series of podcasts about the Solar System at Astronomy Cast. Check them out here.

Sources:

About Time: Is the June 30th Leap Second the Last?

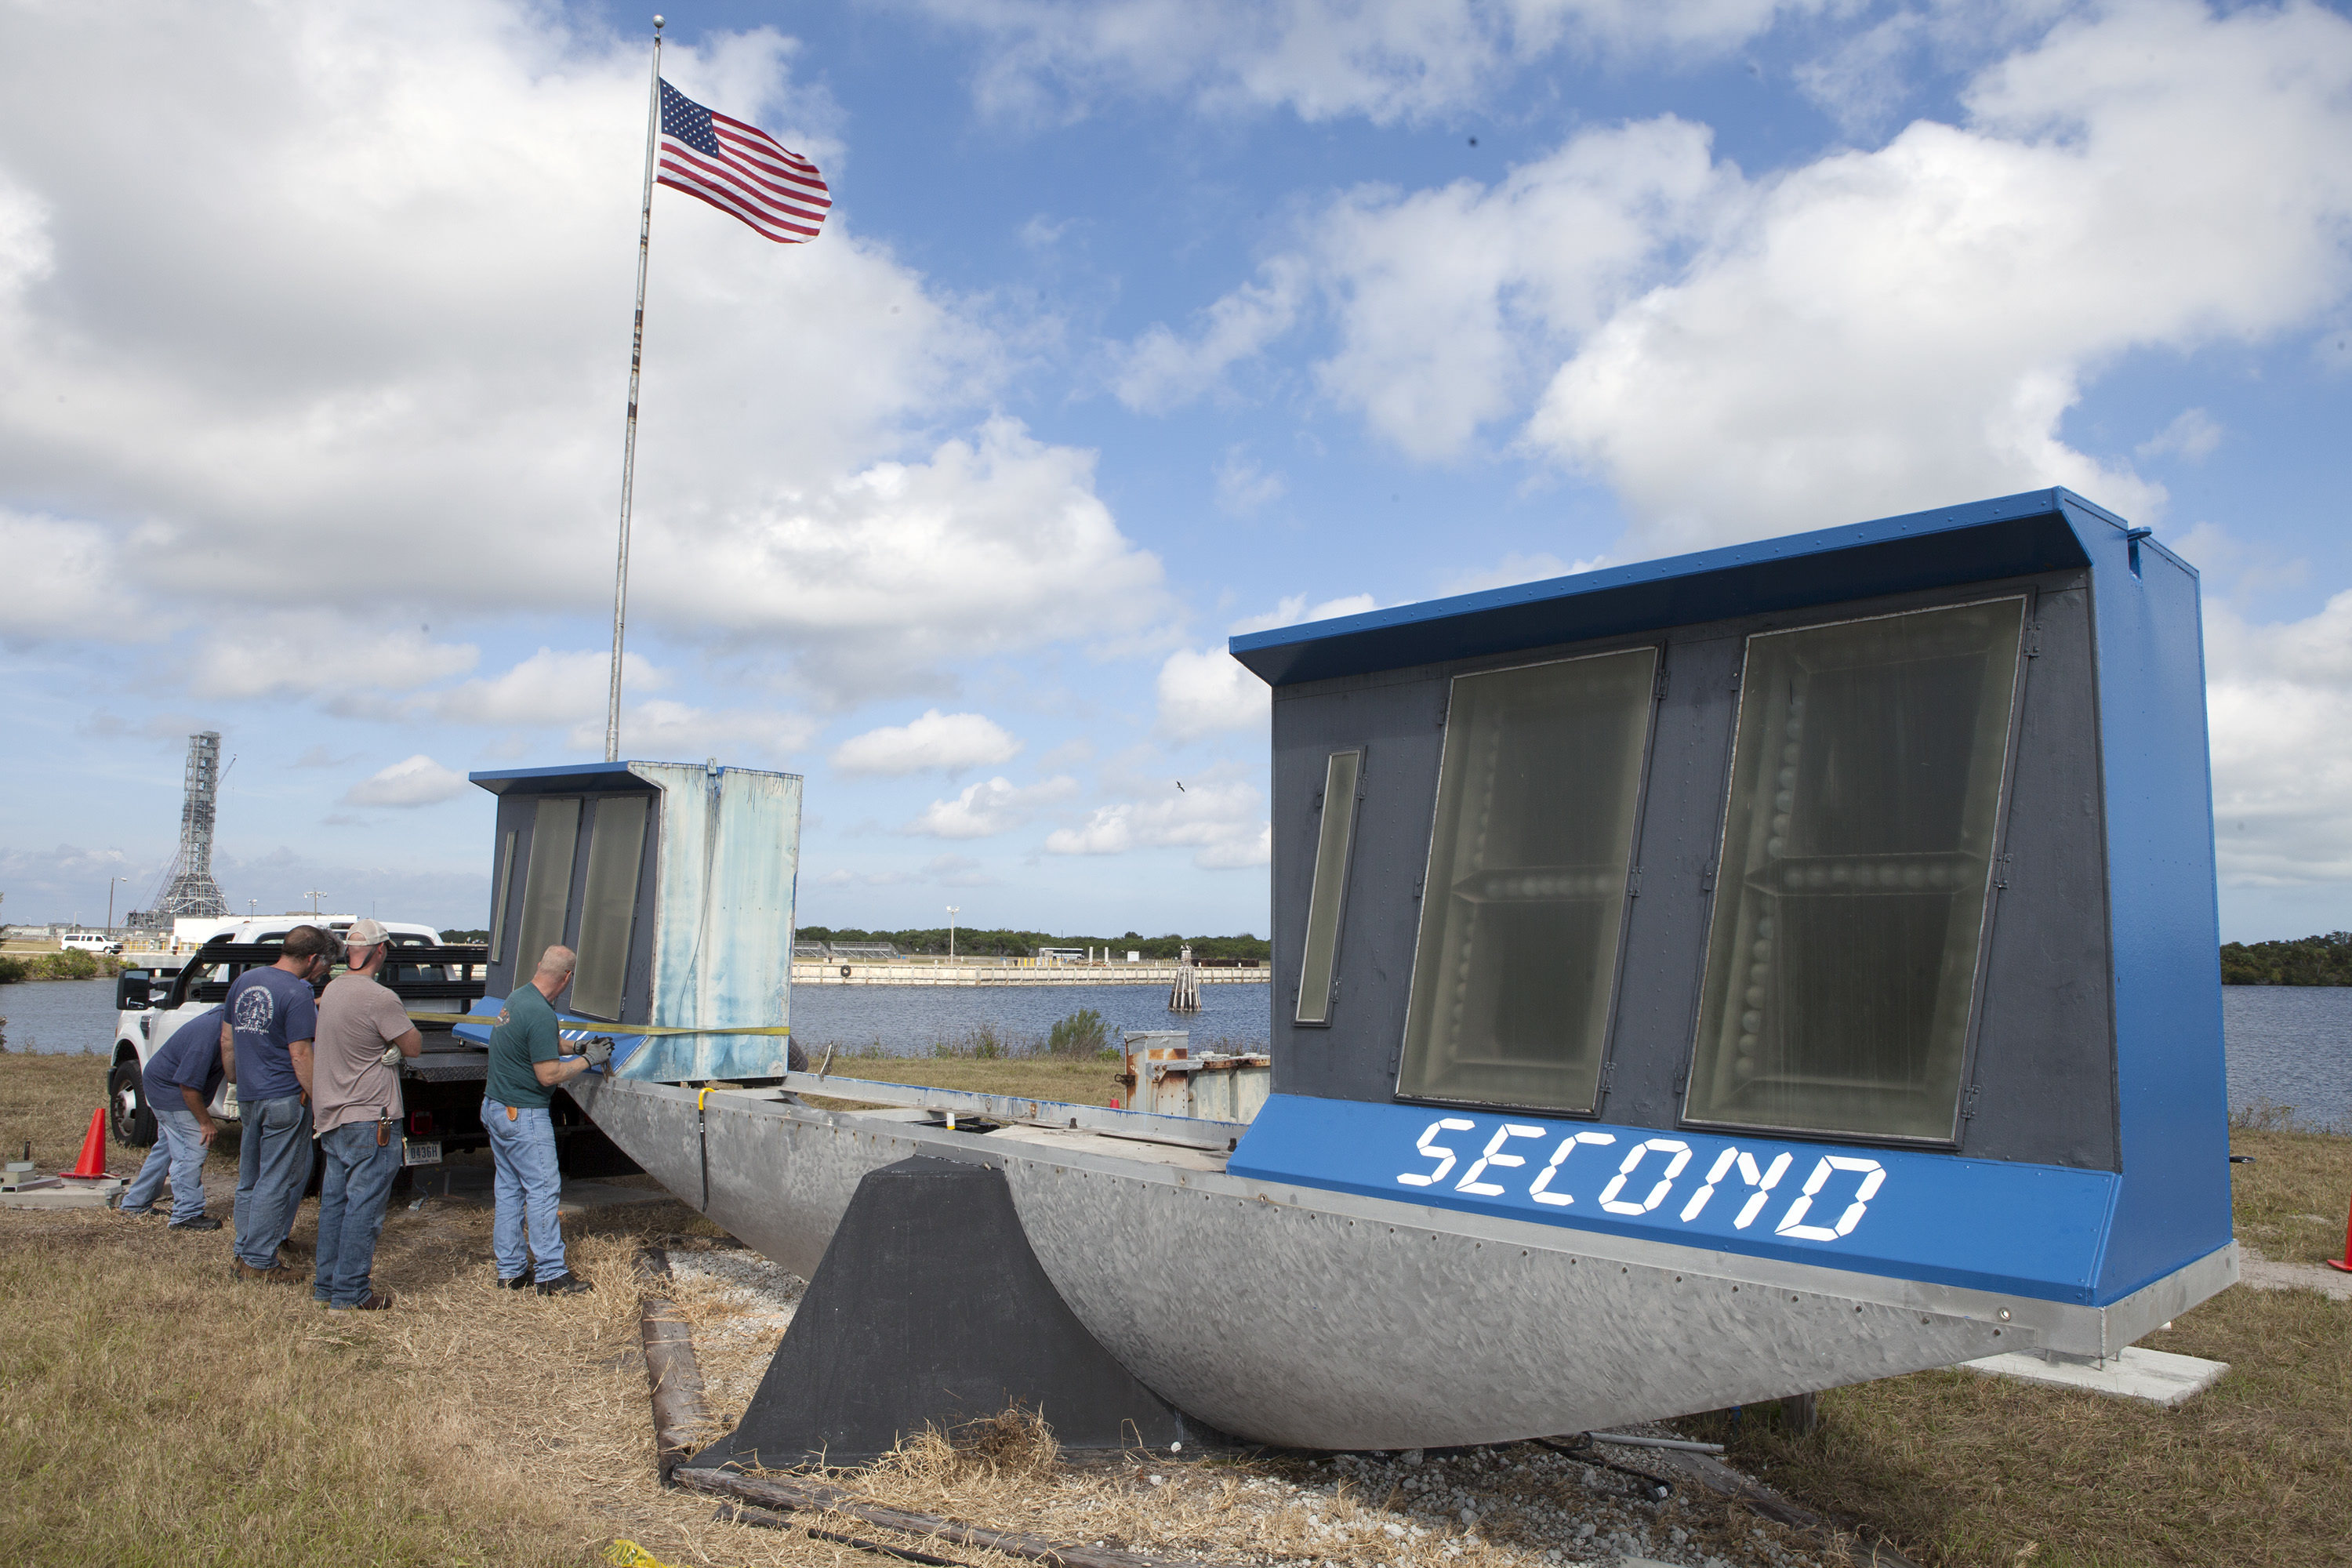
Out with the old... changing out the historic coundown clock at the Kennedy Space Center, perhaps an easier 'time change' than the insertion of the leap second. Image credit: NASA/Frankie Martin

The month of June 2015 is just a tad longer than usual… but not for the reason you’ve been told.

Chances are, you’ll soon be hearing that we’re tacking on an extra second to the very end of June 30th, though the reason why is a bit more complex than the explanation you’ll be hearing.

It’s an error that comes around and is repeated about every 500 days or so, as we add a leap second to June 30th or December 31st.

‘The rotation of the Earth is slowing down,’ your local weather newscaster/website/anonymous person on Twitter will say. ‘This is why we need to add in an extra second every few years, to keep our accounting for time in sync.’

Image credit:
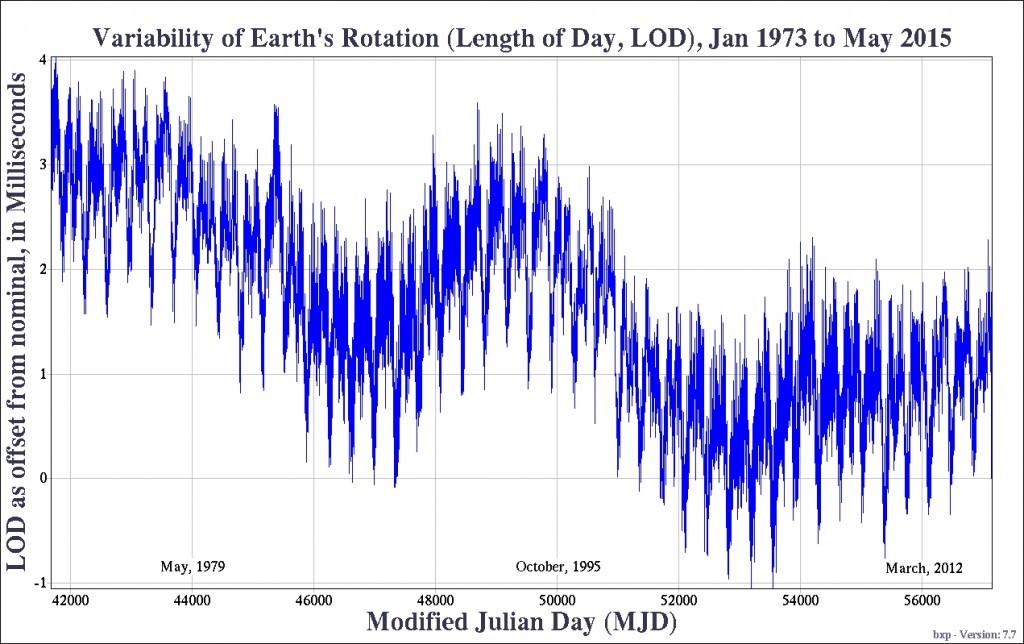
The observed variation of the Earth’s rotation in milliseconds since the adoption of the leap second. Image credit: The United States Naval Observatory

Now, I know what you’re thinking.

Doesn’t adding a second once every 18-24 months or so add up to an awful lot? Are we really slowing down to the tune of (calculator apps out) over 11 minutes per millennium? What’s going on here?

Here’s what your weatherman won’t tell you.

The story of the second and the insertion of the modern day leap second is a curious case of modern astronomical history.

Universe Today recently covered the quirks of the Earth’s rotation on this past weekend’s June solstice. We are indeed slowing down, to the tune of an average of 2.3 milliseconds (thousands of a second) of a day per century in the current epoch, mostly due to the tidal braking action of the Moon. The advent of anthropogenic global warming will also incur variations in the Earth’s rotation rate as well.

Historically, the second was defined as 1/86,400th (60 seconds x 60 minutes x 24 hours) of a mean solar day. We’ve actually been on an astronomical standard of time of one sort or another for thousands of years, though it’s only been over the last two centuries that we’ve really needed—or could even reliably measure—time to an accuracy of less than a second. These early observations were made by astronomers using transit instruments as they watched stars ‘cross the wire’ in an eyepiece using nothing more sophisticated than a Mark-1 eyeball.

Image credit:
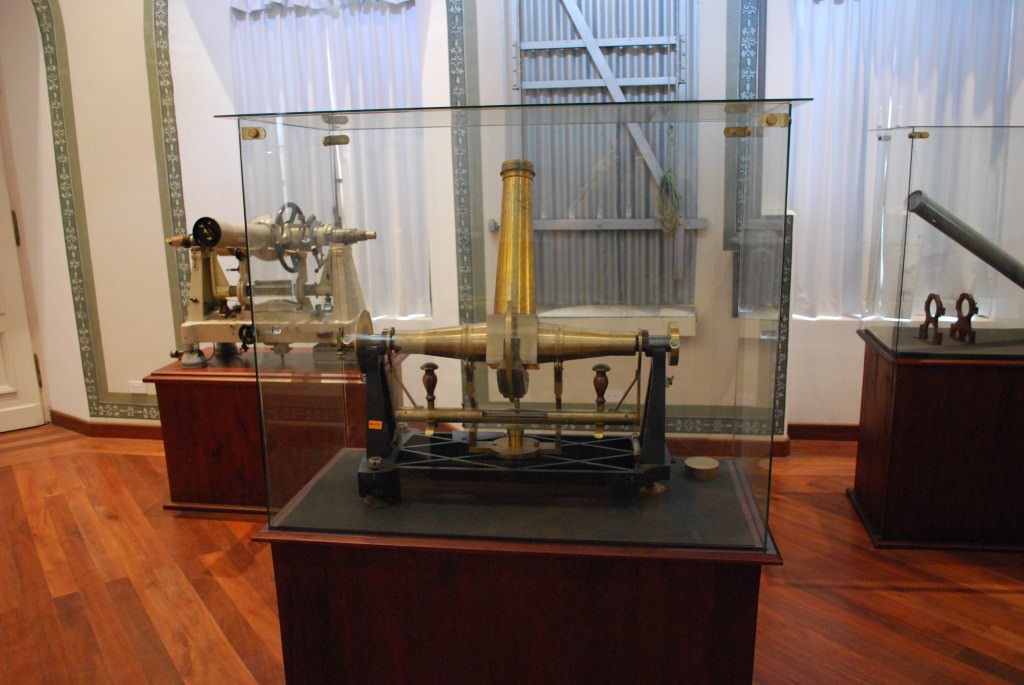
A transit instrument on display at the Quito Observatory in Quito, Ecuador. Image credit: David Dickinson

The whole affair was addressed in 1956 by the International Committee for Weights and Measures, which defined what was known as the ephemeris, or astronomical second as a fraction—1/31,556,925.9747th to be precise—of the tropical year set at noon on January 1st 1900.

Image credit:
Simon Newcomb. Image in the Public Domain

Now, this decision relied on measurements contained in Simon Newcomb’s 1895 book Tables of the Sun to describe the motion of the Earth. Extrapolating back, a day was exactly 86,400 modern seconds long… in 1820.

In the intervening 195 years, the modern day is now about an extra 1/500th (86,400.002) of an SI second long. In turn, the SI second was defined in 1967 as:

The duration of 9,192,631,770 periods of radiation corresponding to the transition between two hyperfine levels of the ground state of the Cesium-133 atom.

Image credit:
An atomic clock at the Federal Office of Metrology in Bern, Switzerland. Image credit: Wikimedia Commons/Public Domain

Now, physicists love to have an SI definition that isn’t reliant on an artifact. In fact, the pesky holdout known as the kilogram is the last of the seven SI base units that is based on an object and not a constant that anyone can measure in a lab worldwide. Simply locking a second at 1/86,400th of a mean solar day would mean that the second itself was slowly lengthening, creating its own can of worms…

So the leap second came to be, as a compromise between UT1 (Astronomical observed time) and UTC (Coordinated Universal Time), which defines a day as being comprised of 86,400 SI seconds. These days, the United States Naval Observatory utilizes observations which include quasars, GPS satellites and laser ranging experiments left on the Moon by Apollo astronauts to measure UT1.

The difference between Universal and Terrestrial Time is often referred to as Delta T.

Image credit:
An 1853 Universal Dial Plate depicting time worldwide before the adoption of Universal Time. Image credit: Wikimedia Commons/Public Domain image

The first leap second was inserted on June 30th 1972, and 25 leap seconds have been introduced up until the extra June 30th second next week.

But the Earth’s rotation isn’t actually slowing down a second every time we add one… this is the point most folks get wrong. Think of it this way: the modern Gregorian calendar inserts a leap day every four years to keep it in sync with the mean tropical year… but the length of the year itself doesn’t increase by a day every four years. Those fractions of a second per day just keep adding up until the difference between UT1 and UTC mounts towards one second, and the good folks at the International Earth Rotation Service  decide something must be done.

And don’t fear the leap second, though we’ve already seen many ‘Y2K redux’ cries already cropping up around the web. We do this every 18-24 months or so, and Skynet hasn’t become self-aware… or at least, not yet.

Of course, programmers hate the leap second, and much like the patchwork of daylight saving time and time zone rules, it causes a colossal headache to assure all of those exceptions and rules are accounted for. Consider, for example, how many transactions (emails, tweets, etc) fly around the globe every second. Many services such as Google instead apply what’s known as a ‘leap smear,’ which slices the leap second out into tinier micro-second sized bites.

With the current system in place, leap seconds will become ever more frequent as the Earth’s rotation continues to slow. There have been calls over the years to even do away with the astronomical standard for measuring time entirely, and go exclusively to the SI second and UTC. This would also create a curious situation of not only, say, throwing off local sunset and sunrise times, but users of GOTO telescope pointing systems would probably note errors within a few decades or so.

This coming November, The World Radiocommunication Conference being held in Geneva, Switzerland is looking to address the issue, though we suspect that, for now at least, the future of the leap second is secure… perhaps, if we did indeed go off the astronomical time standard for the first time in the history of modern human civilization, a leap hour might have to be instituted somewhere around oh say, 2600 AD.

What do you, the reader think? Should it be ‘down with the leap second,’ or should we keep our clocks in lock step with the cosmos?

This Father’s Day is One of the Longest Days in the History of the Earth – Here’s Why

June 21st is an important day this year. Not only is it the summer solstice (that is to say, the longest day of the year in the northern hemisphere), but it is also one of the longest days ever in the history of the Earth. Not only is it one of the longest days ever, but it’s Father’s day!

My dad inspired me to become a scientist and astronomer. He is one of the most curious people I know; in fact, I guarantee that he will be one of the first people to read this article. Back when I lived in a suburb of Seattle filled with light pollution, he would enthusiastically break out his refracting telescope. From the end of our driveway, pointing away from that damn streetlight that would never turn off, we’d gaze upon Saturn and Jupiter.
Continue reading “This Father’s Day is One of the Longest Days in the History of the Earth – Here’s Why”

How Many Moons Does Uranus Have?

Uranus and Moons
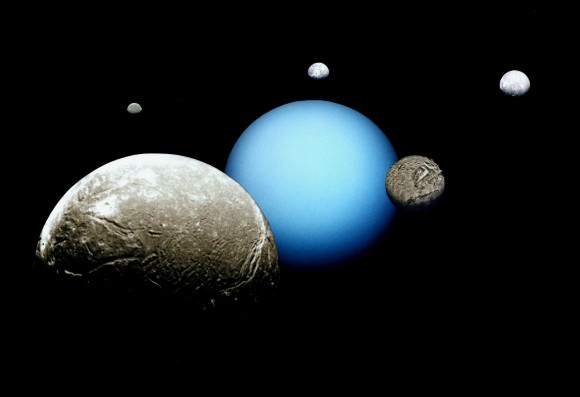
Uranus and its system of Moons. Credit: NASA/JPL

In the outer Solar System, there are many worlds that are so large and impressive to behold that they will probably take your breath away. Not only are these gas/ice giants magnificent to look at, they are also staggering in size, have their own system a rings, and many, many moons. Typically, when one speaks of gas (and/or ice) giants and their moons, one tends to think about Jupiter (which has the most, at 67 and counting!).

But have you ever wondered how many moons Uranus has? Like all of the giant planets, it’s got rather a lot! In fact, astronomers can now account for 27 moons that are described as “Uranian”. Just like the other gas and ice giants, these moons are motley bunch that tell us much about the history of the Solar System. And, just like Jupiter and Saturn, the process of discovering these moons has been long and involved on multiple astronomers.

Continue reading “How Many Moons Does Uranus Have?”

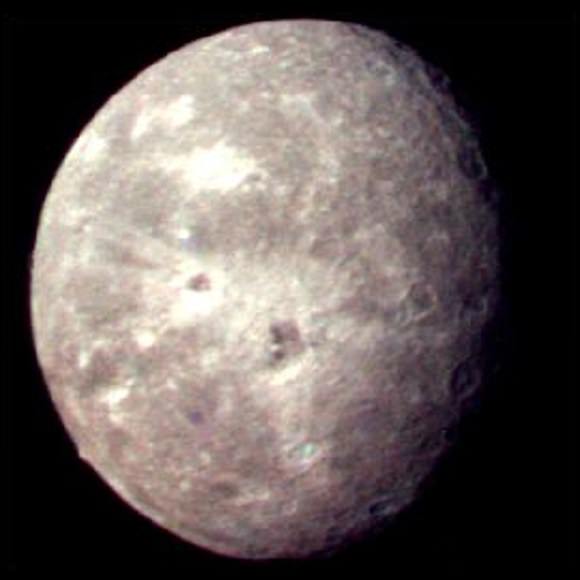
Uranus’s Moon Oberon

Oberon, as imaged by the Voyager 2 probe during its flyby on Jan. 24, 1986. Credit: NASA

In 1610, Galileo’s observed four satellites orbiting the distant gas giant of Jupiter. This discovery would ignite a revolution in astronomy, and encouraged further examinations of the outer Solar System to see what other mysteries it held. In the centuries that followed, astronomers not only discovered that other gas giants had similar systems of moons, but that these systems were rather extensive.

For example, Uranus has a system of 27 confirmed satellites. Of these, Oberon is the outermost satellite, as well as the second largest and second most-massive. Named in honor of a mythical king of fairies, it is also the ninth most massive moon in the Solar System.

Discovery and Naming:

Discovered in 1787 by Sir William Herschel, Oberon was one of two major satellites discovered in a single day (the other being Uranus’ moon of Titania). At the time, he reported observing four other moons; however, the Royal Astronomical Society would later determine that these were spurious. It would be almost five decades after the moons were discovered that an astronomer other than Herschel observed them.

Initially, Oberon was referred to as “the second satellite of Uranus”, and in 1848, was given the designation Uranus II by William Lassell. In 1851, Lassell discovered Uranus’ other two moons – later named Ariel and Miranda – and began numbering them based on their distance from the planet . Oberon was thus given the designation of Uranus IV.

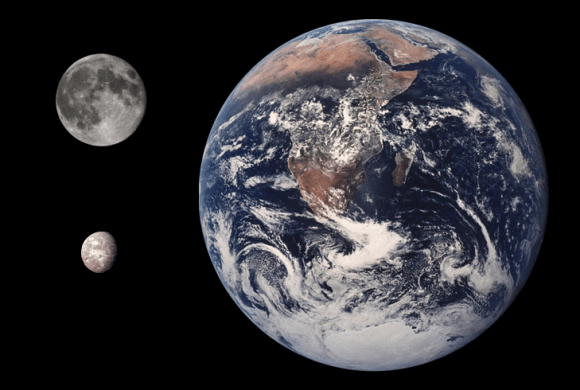
Size comparison between the Earth, the Moon, and Saturn's moon of Oberon. Credit: Tom.Reding/Public Domain
Size comparison between the Earth, the Moon, and Uranus’ moon of Oberon. Credit: Tom.Reding/Public Domain

By 1852, Herschel’s son John suggested naming the moon’s his father observed Oberon and Titania, at the request of Lassell himself. All of these names were taken from the works of William Shakespeare and Alexander Pope, with the name Oberon being derived from the King of the Fairies in A Midsummer Night’s Dream.

Size, Mass and Orbit:

With a diameter of approx. 1,523 kilometers, a surface area of 7,285,000 km², and a mass of 3.014 ± 0.075 x 10²¹ kilograms, Oberon is the second largest, and second most massive of Uranus’ moons. It is also the ninth most massive moon in the solar system.

At a distance of 584,000 km from Uranus, it is the farthest of the five major moons from Uranus. However, this distance is subject to change, as Oberon has a small orbital eccentricity and inclination relative to Uranus’ equator. It has an orbital period of about 13.5 days, coincident with its rotational period. This means that Oberon is a tidally-locked, synchronous satellite with one face always pointing toward the planet.

Since (like all of Uranus’ moons) Oberon orbits the planet around its equatorial plane, and Uranus orbits the Sun almost on its side, the moon experiences a rather extreme seasonal cycle. Essentially, both the northern and southern poles spend a period of 42 years in complete darkness or complete sunlight – with the sun rising close to the zenith over one of the poles at each solstice.

Voyager 2:

So far, the only close-up images of Oberon have been provided by the Voyager 2 probe, which photographed the moon during its flyby of Uranus in January 1986.  The images cover about 40% of the surface, but only 25% of the surface was imaged with a resolution that allows geological mapping.

In addition, the time of the flyby coincided with the southern hemisphere’s summer solstice, when nearly the entire northern hemisphere was in darkness. This prevented the northern hemisphere from being studied in any detail. No other spacecraft has visited the Uranian system before or since, and no missions to the planet are currently being planned.

Composition:

Oberon’s density is higher than the typical density of Uranus’ satellites, at 1.63 g/cm³. This would indicate that the moon consists of roughly equal proportions of water ice and a dense non-ice component. The latter could be made of rock and carbonaceous material including heavy organic compounds.

Spectroscopic observations have confirmed the presence of crystalline water ice in the surface of the moon. It is believed that Oberon, much like the other Uranian moons, consists of an icy mantle surrounding a rocky core. If this is true, then the radius of the core (480 km) would be equal to approx. 63% of the radius of the moon, and its mass would be around 54% of the moon’s mass.

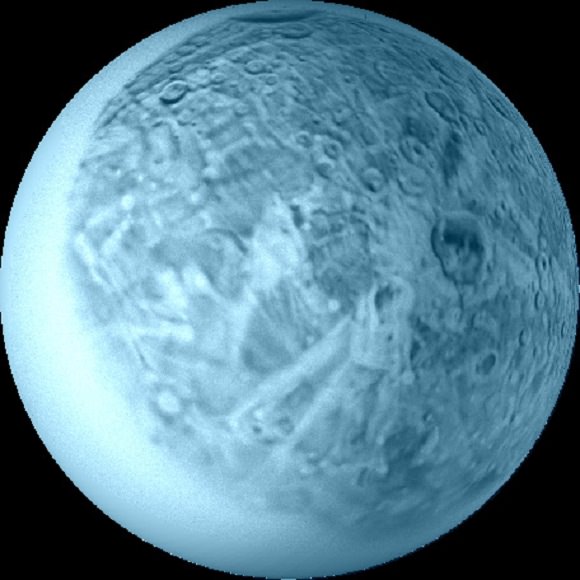
A computer-projected false-color image of Oberon. The white region has not yet been photographed by a spacecraft. The large crater with the dark floor (right of center) is Hamlet; the crater Othello is to its lower left, and the 'canyon' Mommur Chasma is at upper left. Credit: USGS Astrogeology Research Program
False-color image of Oberon, showing the Hamlet and Othello craters (right of center and lower left) and the Mommur Chasma (upper left). Credit: USGS Astrogeology Research Program

Currently, the full composition of the icy mantle is unknown. However, it it were to contain enough ammonia or other antifreeze compounds, the moon may possess a liquid ocean layer at the core–mantle boundary. The thickness of this ocean, if it exists, would be up to 40 km and its temperature would be around 180 K.

It is unlikely that at these temperatures, such an ocean could support life. But assuming that hydrothermal vents exist in the interior, it is possible life could exist in small patches near the core. However, the internal structure of Oberon depends heavily on its thermal history, which is poorly known at present.

Interesting Facts:

Oberon is the second-darkest large moon of Uranus (after Umbriel), with a surface that appears to be generally red in color – except where fresh impact deposits have left neutral or slightly blue colors. In fact, Oberon is the reddest moon amongst its peers, with a trailing hemisphere that is significantly redder than its leading hemisphere.

The reddening of the surfaces is often a result of space weathering caused by bombardment of the surface by charged particles and micrometeorites over many millions of years. However, the color asymmetry of Oberon is more likely caused by accretion of a reddish material spiraling in from outer parts of the Uranian system.

Oberon’s surface is the most heavily cratered of all the Uranian moons, which would indicate that Oberon has the most ancient surface among them. Consistent with the planet’s name, these surface features are named after characters in Shakespearean plays. The largest known crater, Hamlet, measures 206 kilometers in diameter, while the Macbeth, Romeo, and Othello craters measure 203, 159, and 114 km respectively.

Uranus and its five major moons
Uranus and its five major moons. Credit: space.com

Other prominent surface features are what is known as chasmata – steep-sided depressions that are comparable to rift valleys or escarpments here on Earth. The largest known chasmata on Oberon is the Mommur Chasma, which measures 537 km in diameter and takes its name from the enchanted forest in French folklore that was ruled by Oberon.

As you can plainly see, there is much that remains unknown about this satellite. Much like its peers, how they came to be, and what secrets may lurk beneath their surfaces, is still open to speculation. One can only hope that future generations will choose to mount another Voyager-like expedition to the Outer Solar System for the sake of studying the Uranian satellites.

We have written many interesting articles on the moons of Uranus here at Universe Today. Here’s How Many Moons Does Uranus Have? and Interesting Facts About Uranus.

For more information, check out NASA’s Solar System Exploration page on Oberon and Nine Planet’s page on Oberon.

Astronomy Cast also has a good episode on the subject. Here’s Episode 62: Uranus.

Sources:

Iridium NEXT Set to Begin Deployment This Year

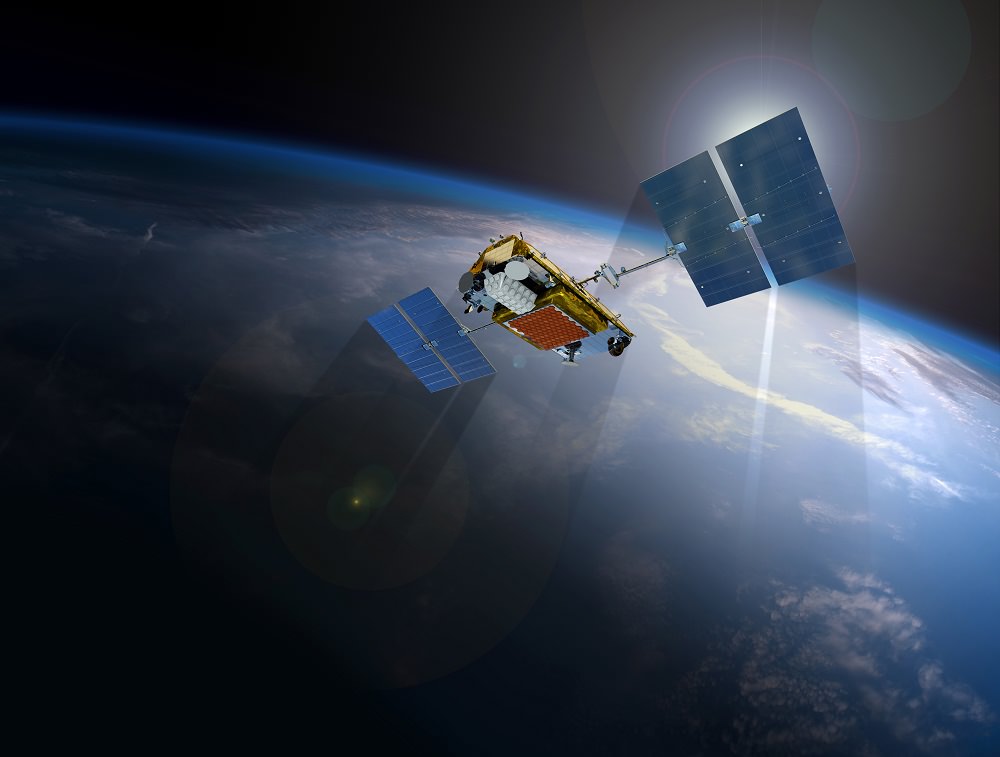
An artist's conception of an Iridium-NEXT satellite in low Earth orbit. Credit: Iridium Communications Inc.

The skies, they are uh changin’…  I remember reading in Astronomy magazine waaaay back in the late 1990s (in those days, news was disseminated in actual paper magazines) about a hot new constellation of satellites that were said to flare in a predictable fashion.

This is the Iridium satellite constellation, a series of 66 active satellites and six in-orbit and nine ground spares. The ‘Iridium’ name comes from the element with atomic number 77 of the same name (the original project envisioned 77 satellites in low Earth orbit), and the satellites serve users with global satellite phone coverage.

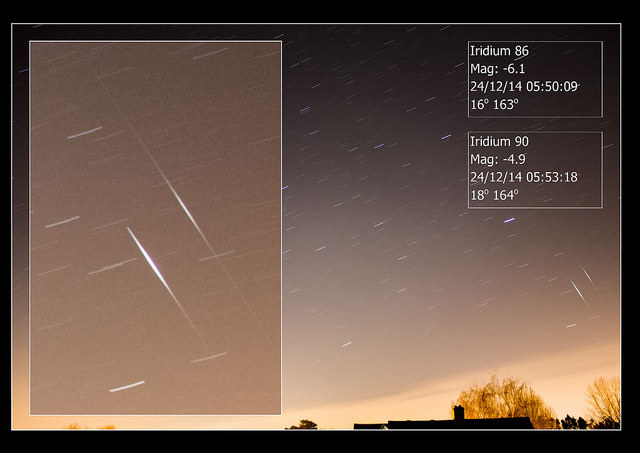
A 'double Iridium flare' capture! Image credit: Mary Spicer
A ‘double Iridium flare’ capture! Image credit: Mary Spicer

Over the years, Iridium satellite flares have become a common sight in the night sky… but that may change soon.

The next generation of Iridium communications satellites begins launching later this year through 2017.

Known as Iridium-NEXT, the first launch is set for October of this year from Dombarovsky air base Russia atop a converted ICBM Dnepr rocket. The Dnepr can carry two satellites on each launch, and SpaceX has also recently agreed to deploy 70 satellites over the span of seven missions launching from Vandenberg Air Force Base in California later this year.

Both the initial Iridium satellites and Iridium NEXT are operated by Iridium Communications Incorporated. The original satellites were built by Motorola and Lockheed Martin, and the prime contract for Iridium NEXT construction went to Thales Alenia Space.

There are also several fascinating issues surrounding the history of the Iridium constellation, both past and present.

Originally fielded by Motorola in the 1990s, satellite phones were to be “the next big thing” until mobile phones took over. Conceived in the late 1980s, the concept of satellite phones was practically obsolete before the first Iridium satellite got off the ground. The high cost of satellite phone services assured they could never manage to compete with the explosive growth of the mobile phone industry, and satellite phones at best only found niche applications for remote operations worldwide.  Iridium Communications declared bankruptcy in 1999, and the $6 billion US dollar project was bought by a group of private investors for only $35 million dollars.

Airmen using an Iridium satellite phone in Antarctica. Image credit: Robert Tingle/USAF

The original Iridium constellation employed a unique system of Inter-Satellite Links, enabling them to directly route signals from satellite to satellite. Iridium NEXT will use an innovative L-band phased array antenna, allowing for larger bandwidth and faster data transmission. The Iridium NEXT constellation is planned to eventually contain 81 satellites including spares, and the system will be much more robust and reliable.

The Iridium NEXT constellation will also face some stiff competition, as Google, SpaceX and OneWeb are also looking to get into the business of satellite Internet and communications. This will also place hundreds of new satellites—not to mention the growing flock of CubeSats—into an already very crowded region of low Earth orbit. The Iridium 33 satellite collision with the defunct Kosmos 2251 satellite in 2009 highlighted the ongoing issues surrounding space debris.

The company applied for a plan to deorbit the original Iridium constellation starting in 2017 as soon as the new Iridium NEXT satellites are in place.

Now, I know what the question of the hour is, as it’s one that we get frequently from other satellite spotters and lovers of artificial things that flash in the sky:

Will the Iridium NEXT satellites flare in manner similar to their predecessors?

Unfortunately, the prospects aren’t good. Missing on Iridium NEXT are the three large refrigerator-sized antennae which are the source of those brilliant -8 magnitude flares. And sure, while these flares weren’t Iridium’s sole mission purpose, they were sure fun to watch!

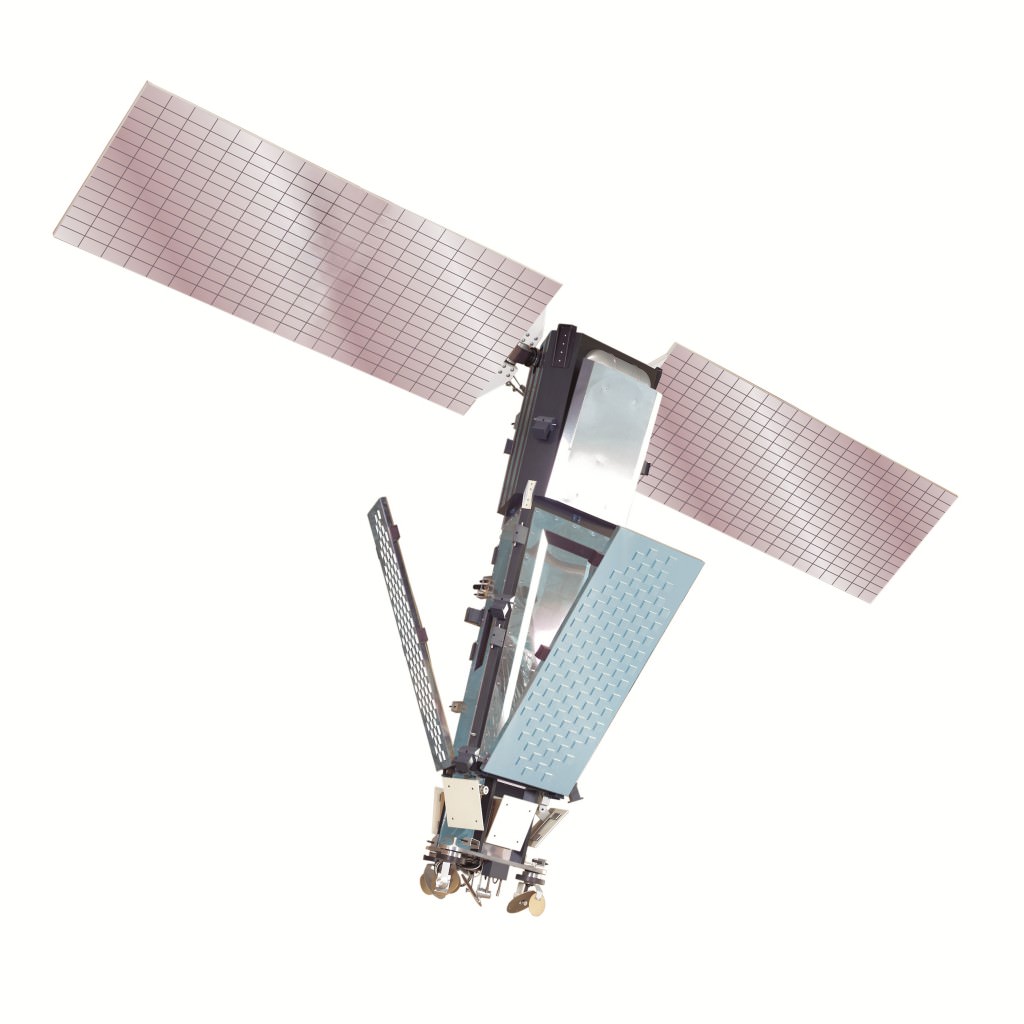
An 'Iridium classic...' note the trio of reflective antenae on the lower bus. Image credit: Iridium Communications inc.
An ‘Iridium classic…’ note the trio of reflective antennae on the lower bus. Image credit: Iridium Communications inc.

David Cubbage, Associate Director of NEXT Spacecraft Development and Satellite Production recently told Universe Today:

“It was very exciting when we first discovered that the Iridium Block 1 satellite vehicles (SVs) reflected the sunlight into a concentrated “flare” that could be viewed in the night sky.  The unique design of the Block 1 SV, with three highly reflective Main Mission Antennas (MMA) deployed at an angle from the SV body, is what caused that to happen.  For the Iridium NEXT constellation, the SVs will be built under a different design with a single MMA that faces the Earth — a design that requires fewer parts that do not need to be as reflective.  As a result, it will not likely produce the spectacular flares of the Block 1 design.”

But don’t despair. Though the two decade ‘Age of the Iridium flare’ may be coming to an end, lots of other satellites, including the Hubble Space Telescope, MetOp-A and B,  and the COSMO-SkyMed series of satellites can ‘slow flare’ on occasion. We recently saw something similar during a pass of the U.S. Air Force’s super-secret ATV-4 space plane currently carrying out its OTV-4 mission, suggesting that a large reflective solar panel may be currently deployed.

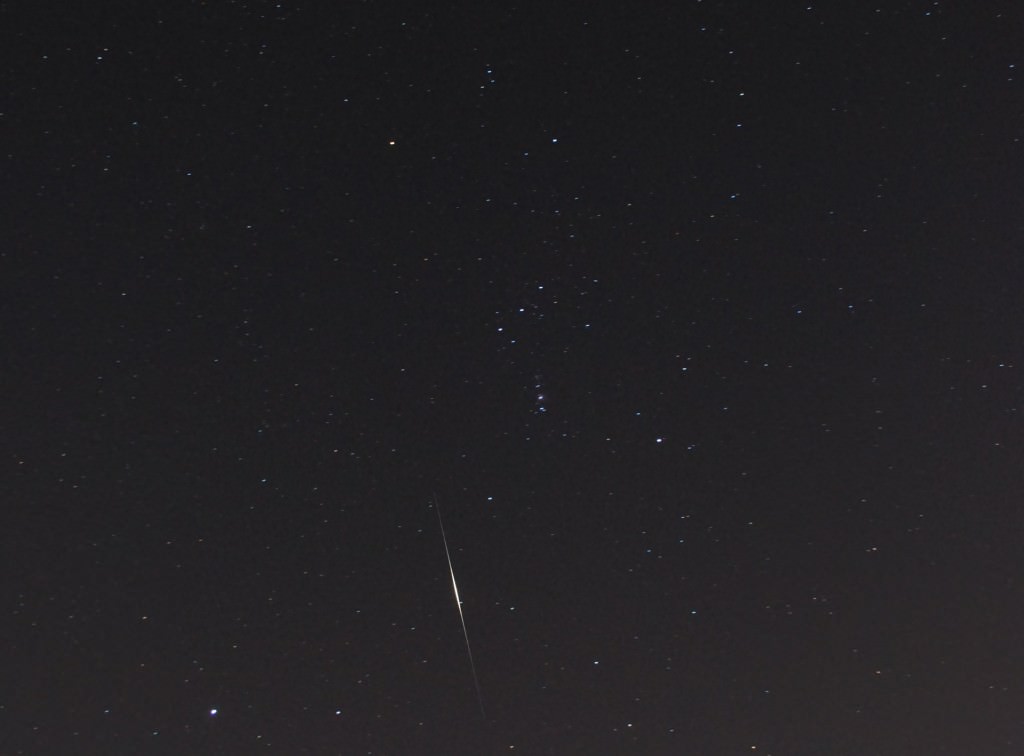
An Iridium flare through the constellations Orion and Lepus. Image credit: David Dickinson
An Iridium flare passing through the constellations Orion and Lepus. Image credit: David Dickinson

And though the path to commercial viability for satellite internet and communications is a tough one, we hope it does indeed take off soon… we personally love the idea of being able to stay connected from anywhere worldwide.

Be sure to catch those Iridium flares while you can… we’ll soon be telling future generations of amateur astronomers that we remember “back when…”

-Check out the chances for the next Iridium flare coming to a sky near you on Heavens-Above.

Comet C/2013 US10 Catalina: A Preview for Act I

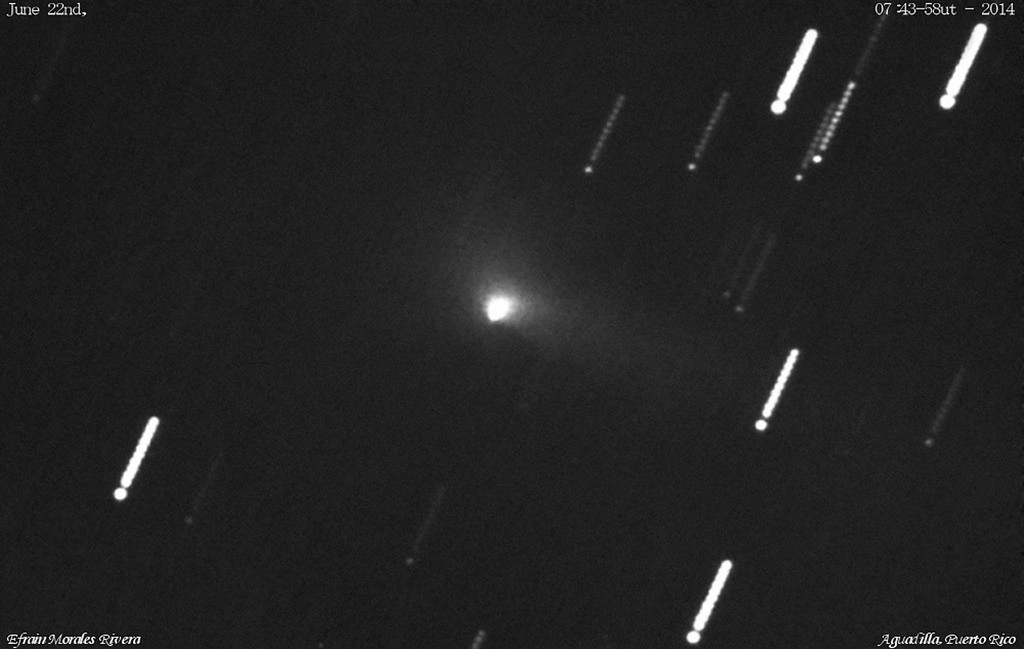
Comet C/2013 US10 Catalina imaged on June 22nd, 2013. Image credit and copyright: Efrain Morales

Live in (or planning on visiting) the southern hemisphere soon? A first time visitor to the inner solar system is ready to put on the first of a two part act starting this month, as Comet C/2013 US10 Catalina breaks +10th magnitude and crosses southern hemisphere skies.

Though we’ve overdue for a this generation’s ‘great comet,’ we’ve had a steady stream of fine binocular comets in 2015, including 2014 Q2 Lovejoy, 2014 Q1 PanSTARRS, and 2015 G2 MASTER. US10 Catalina looks to follow this trend, topping out at just above naked eye visibility in late 2015 going into early 2016.

Discovered by the Catalina Sky Survey on Halloween 2013, the comet received its unusual ‘US10’ designation as it was initially thought to be an asteroid early on in a periodic six year orbit, until a longer observation arc was completed. This is not an unusual situation, as new objects are often lost in the Sun’s glare before their orbit can be refined.

Recent images of US10 Catalina from may 18th, 2015. Image credit and copyright: Joseph Brimacombe
Recent images of US10 Catalina from May 18th, 2015. Image credit and copyright: Joseph Brimacombe

We now know that US10 Catalina is on a million year long journey from the distant Oort Cloud. Most likely, it was disturbed by an unrecorded close stellar passage long ago. We say that such comets are dynamically new, and this passage will eject US10 Catalina from the solar system. The comet also has a highly inclined orbit tilted almost 149 degrees relative to the ecliptic, and was at +19th magnitude and 7.7 AU from the Earth when it was discovered, suggesting an intrinsically bright comet.

Prospects for US10 Catalina currently favor latitude 35 degrees north southward in late June, though that’ll change radically as the comet makes the plunge south this summer. As of this writing, US10 Catalina was at +11 magnitude ‘with a bullet’ and currently sits in the constellation Sculptor at a declination -30 degrees in the southern sky.

Image credit:
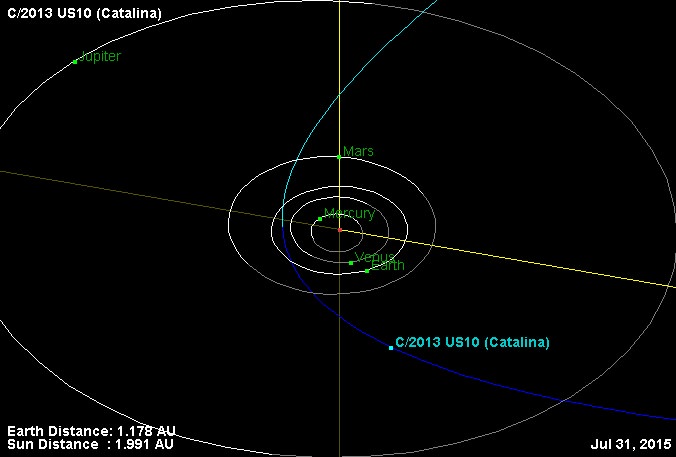
The orbit of Comet US10 Catalina. Image credit: NASA/JPL

Binoculars are our favorite tools for observing comets, as they’ve easy to sweep the skies with on our cometary quest. As with nebulae and deep sky objects, keep in mind that quoted magnitude for a comet is spread out over its apparent surface area, causing them to appear fainter than a star of the same magnitude.

Here’s a blow-by-blow for Act I for Comet C/2013 US10 Catalina over the next few months:

(Unless otherwise noted, we documented stellar passages below that are within 2 degrees of stars brighter than +5th magnitude, and fine NGC deep sky objects brighter than +8th magnitude)

July 1st: May break binocular visibility, at +10th magnitude.

July 6th: Crosses into the constellation of Phoenix.

July 23rd: Crosses into the constellation Grus.

July 25th: Crosses into the constellation Tucana.

July 26th: Passes the +4th magnitude star Gamma Tucanae.

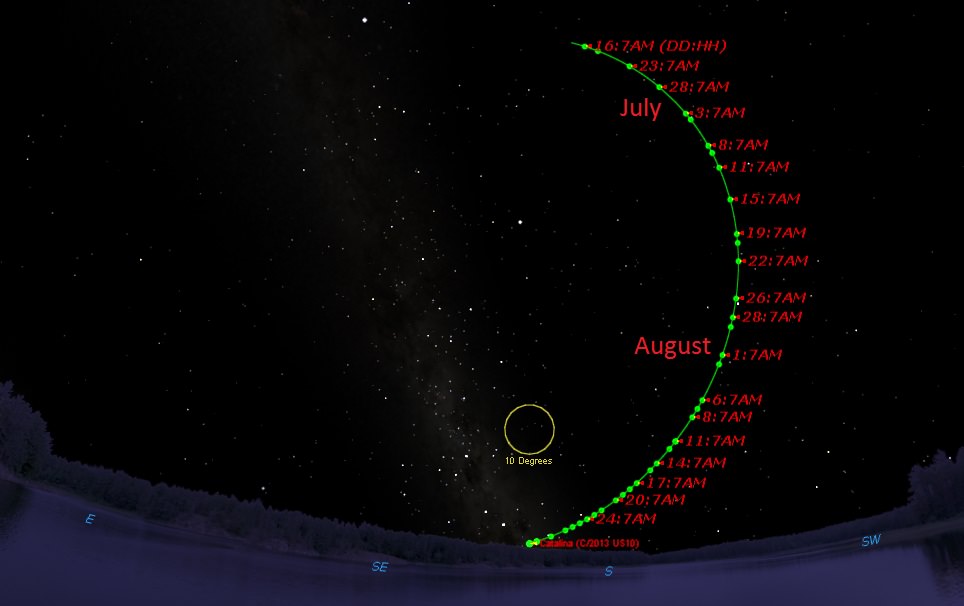
Image credit: Created using Starry Night Education software
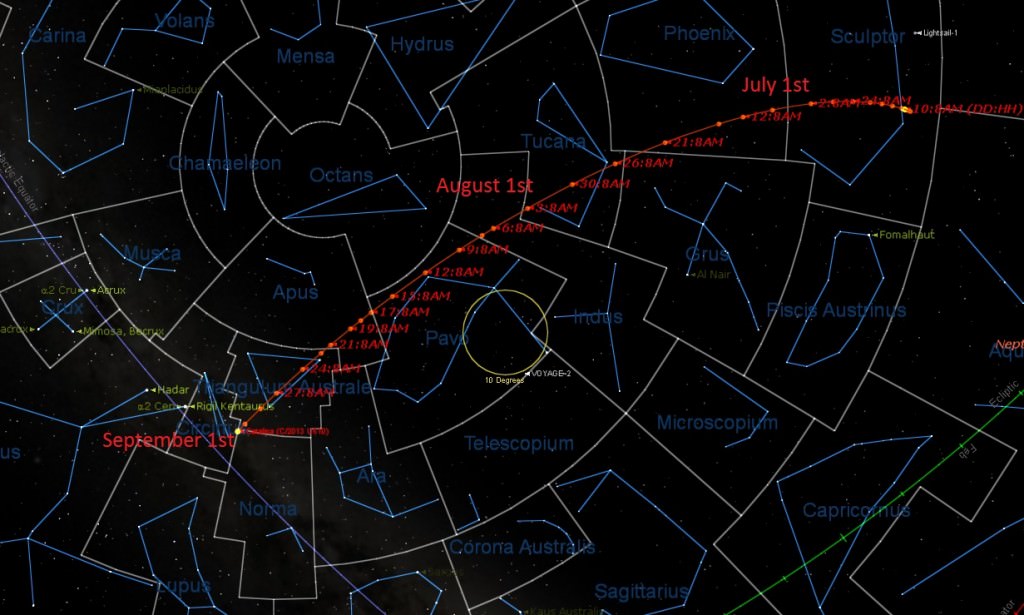
The path of Comet US10 Catalina as seen from 30 degrees south.  Image credit: Created using Starry Night Education software

August 1st: Reaches opposition.

August 2nd: Passes the +4.5th magnitude star Delta Tucanae.

August 4th: Crosses into the constellation Indus.

August 6th: Photo op: Passes 12 degrees from 47 Tucanae and the Small Magellanic Cloud.

August 8th: Crosses into the constellation Pavo.

August 12th: Passes the +4th magnitude star Epsilon Pavonis.

August 14th: Reaches its greatest declination south at almost -74 degrees.

August 15th: Sits at 1.1 AU from the Earth.

August 17th: Crosses into the constellation Apus.

August 19th: Passes 5 degrees from the +7.7 magnitude globular cluster NGC 6362.

August 22nd: Crosses into the constellation Triangulum Australe and passes the +1.9 magnitude star Atria.

August 28th: Passes the +2.8 magnitude star Beta Trianguli Australis.

August 29th: Passes 3 degrees from the +5th magnitude open cluster NGC 6025.

September 1st: Crosses into the constellation Circinus

Image credit: Starry Night Education software
The passage of Comet US10 Catalina through the southern sky from mid-June through September 1st. Image credit: Starry Night Education software

From there, Comet US10 Catalina heads towards perihelion 0.8229 astronomical units from the Sun on November 15th, before vaulting up into the northern hemisphere sky in the early dawn.  Like Comet Q2 Lovejoy last winter, US10 Catalina should top out at around +4th magnitude or so as it glides across the constellation Ursa Major just after New Years.

And like many comets, the discriminating factor between a ‘great’ and ‘binocular comet’ this time around is simply a matter of orbital geometry. Had C/2013 US10 Catalina arrived at perihelion in the May time frame, it would’ve passed less than 0.2 AU (30 million kilometres) from the Earth!

Image credit:
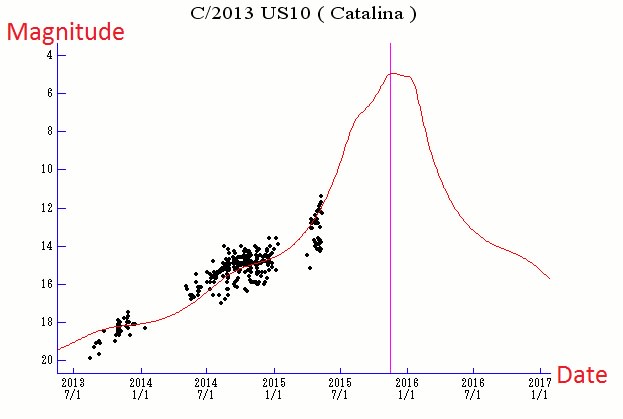
The projected light curve for Comet US10 Catalina. The black dots denote actual observations, and the purple vertical line marks the perihelion passage for the comet. Image credit: Seiichi Yoshida’s Weekly Information about Bright Comets

But that’s cosmic irony for you. Keep in mind, with Comet US10 Catalina being a dynamically new first time visitor to the inner solar system, it may well up brighten ahead of expectations.

And there’s more to come… watch for Act II as we follow the continuing adventures of Comet C/2013 US10 Catalina this coming September!

Mir: Russia’s Space Station

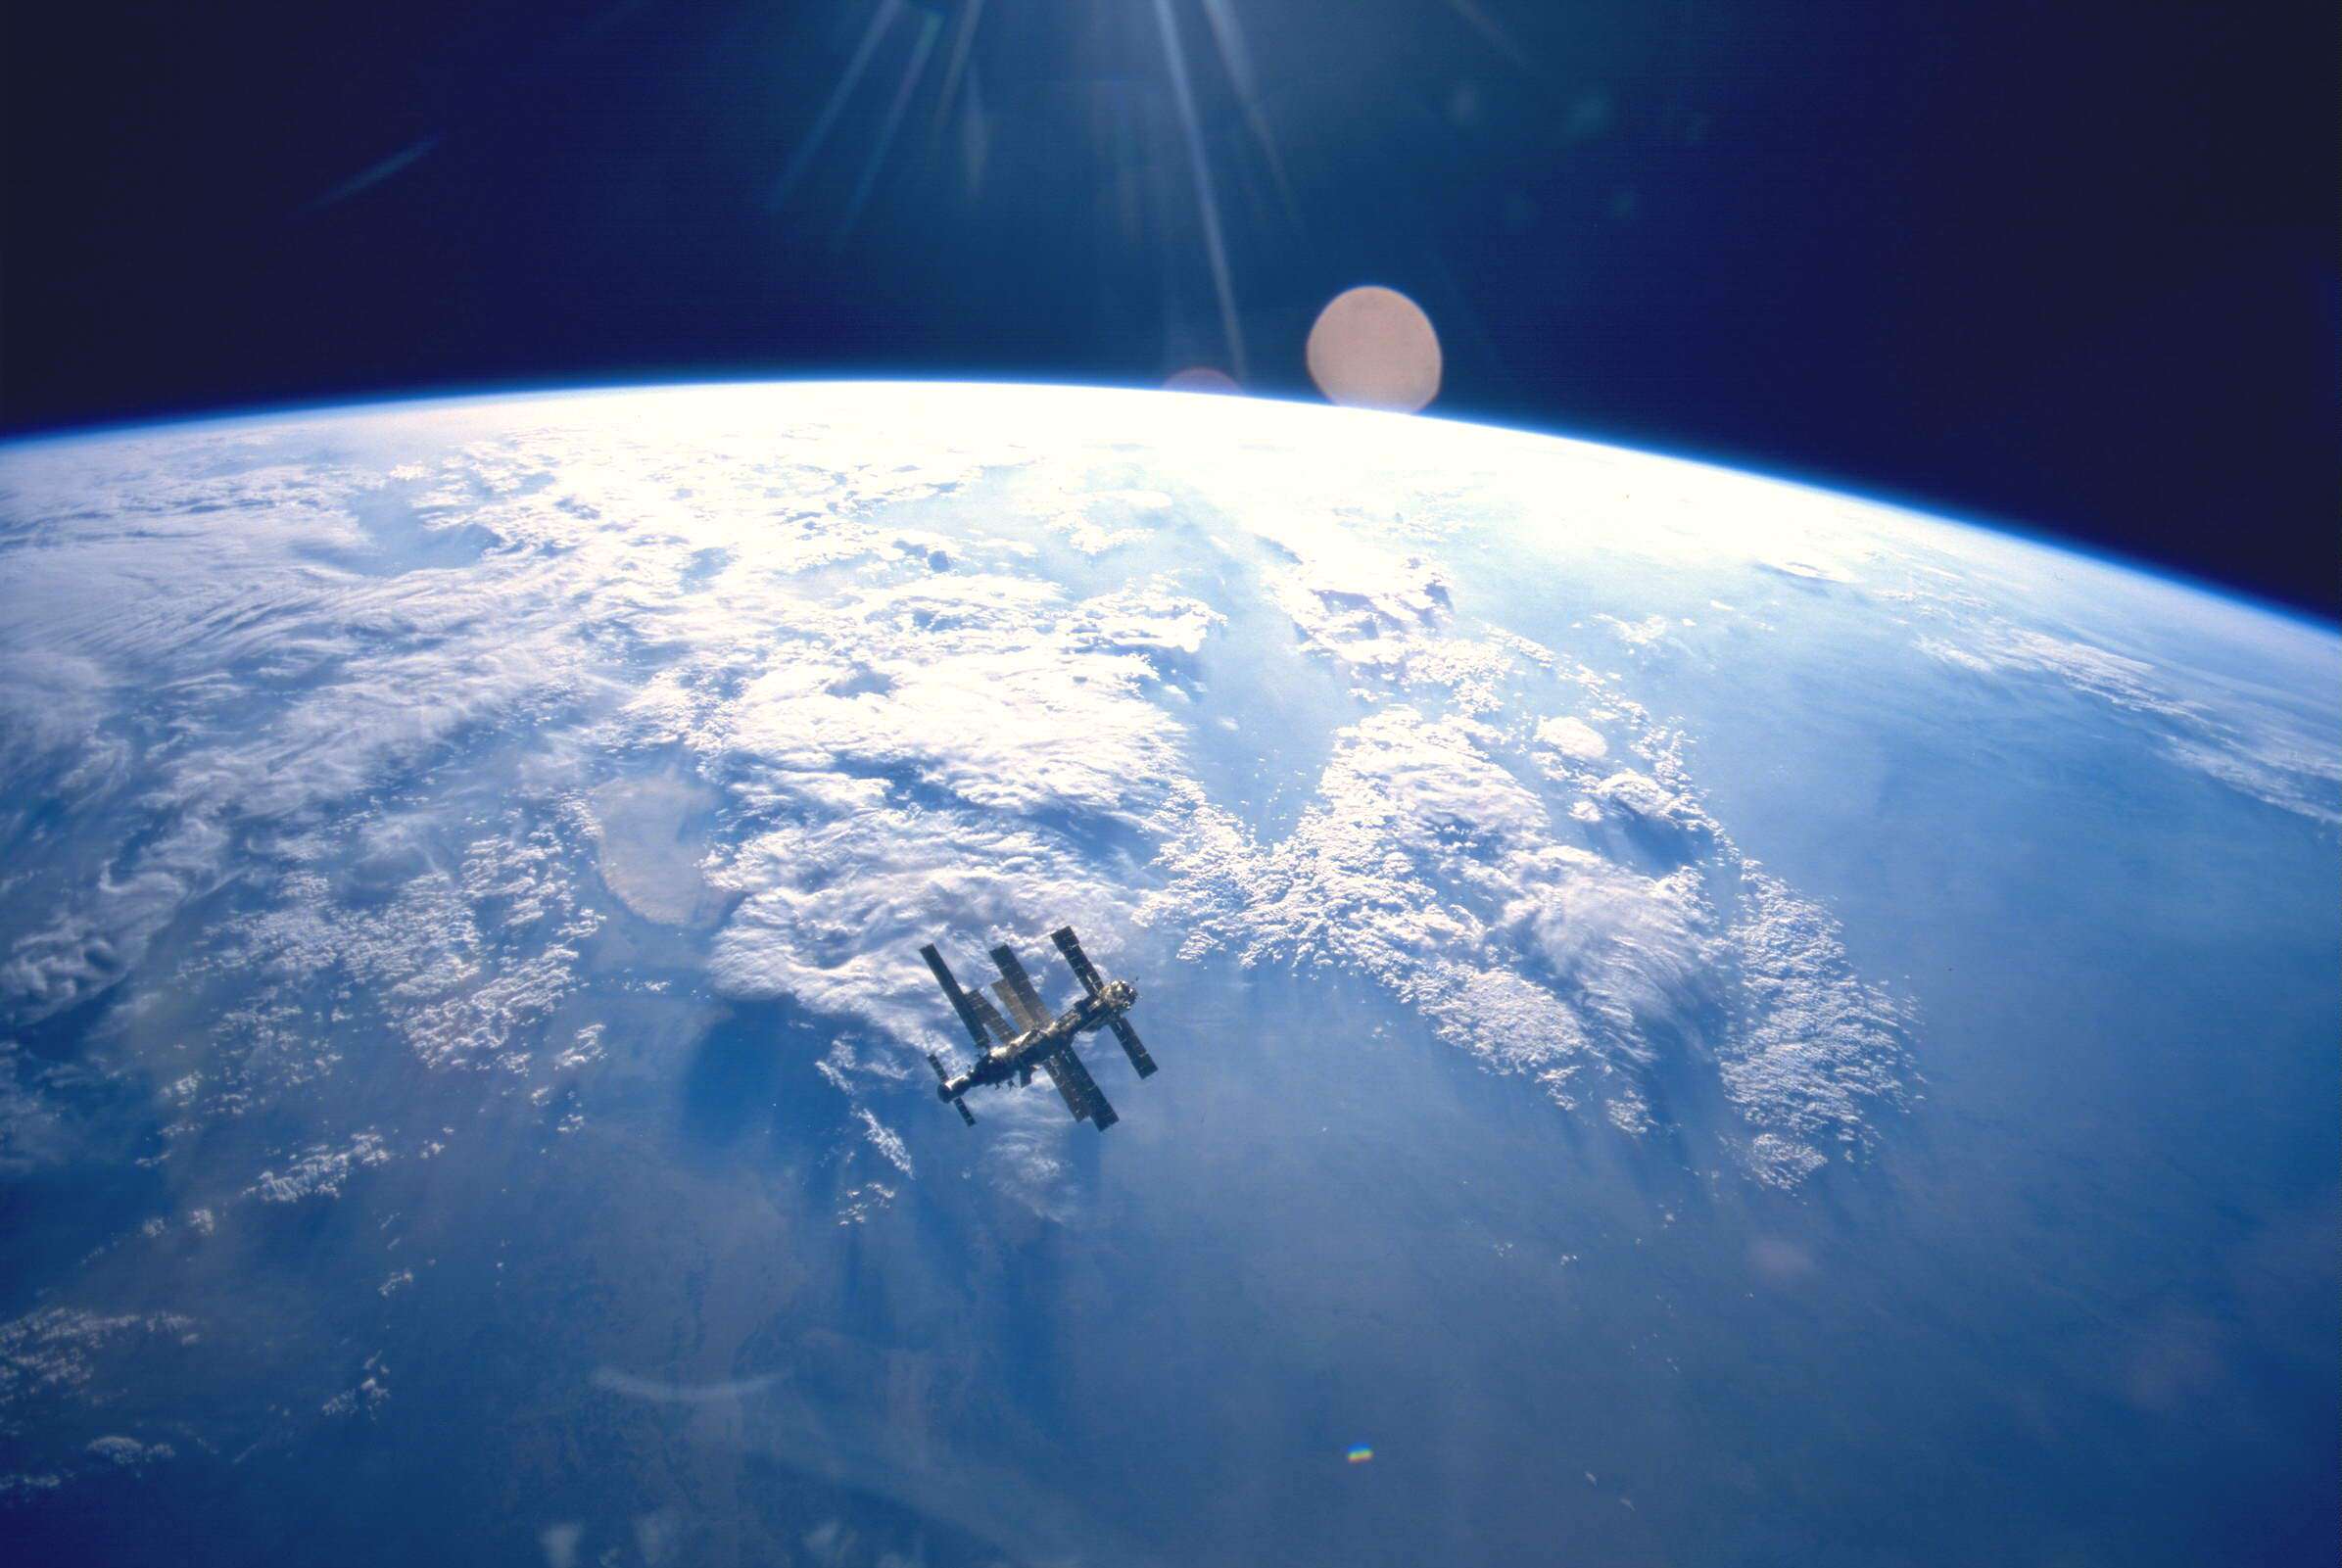
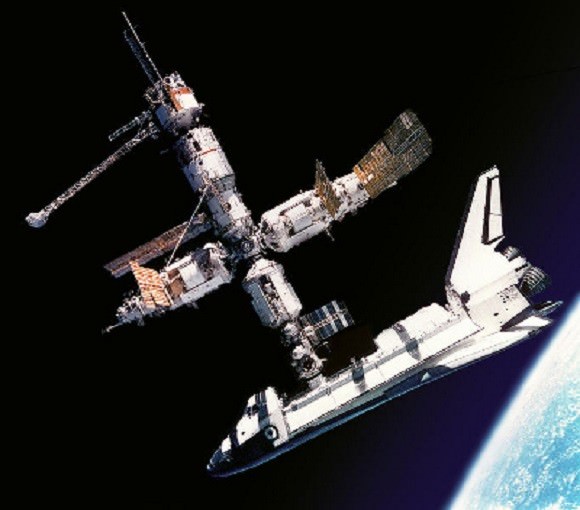
The Mir space station hangs above the Earth in 1995 (photo by Atlantis STS-71, NASA)

The Mir Space Station was Russia’s greatest space station, and the first modular space station to be assembled in orbit. Commissioned in 1986, the name can be translated from Russian as “peace”, “world”, and even “village” – alluding to the spirit of international cooperation that led to its creation. Owned and operated by the Soviet Union, it became the property of the Russian Federal Space Agency (Roscosmos) after 1991.

The space station was intended to advocate world peace and hosted international scientists and NASA astronauts. In this respect, Mir was very much the curtain-raiser for the International Space Station, which succeeded it as the largest satellite in Earth’s orbit after 2001.

Origin:

During the 1960s and 70s, when the United States was largely focused on Apollo and the Space Shuttle program, Russia began to focus on developing expertise in long-duration spaceflight, and felt that a larger space station would allow for more research in that area. Authorized in February 1976 by a government decree, the station was originally intended to be an improved model of the Salyut space stations.

The original plan called for a core module that would be equipped with a total of four docking ports, but eventual grew to include several ports for crewed Soyuz spacecraft and Progress cargo spaceships. By August 1978, the plan had grown to the final configuration of one aft port and five ports in a spherical compartment at the forward end of the station.

The Mir Space Station and Earth limb observed from the Orbiter Endeavour during NASA's STS-89 mission in 1998. Credit: NASA
The Mir Space Station and Earth limb observed from the Orbiter Endeavour during NASA’s STS-89 mission in 1998. Credit: NASA

Two would be located at either end of the station (as with the Salyut stations) with an additional two on either side of a docking sphere at the front of the station to enable further modules to expand the station’s capabilities.  These docking ports would each accommodate 20-tonne space station modules based on the TKS spacecraft – a previous generation of space craft used to bring cosmonauts and supplies to the Salyut space stations.

Work began on the station in 1979, and drawings were released in 1982 and 83. By early 1984, work had ground to a halt as virtually all of Russia’s space resources were being put into the Buran program – a Soviet and later Russian reusable spacecraft project. Funding resumed in early 1984 when the Central Committee became determined to orbit Mir by early 1986, just in time for the 27th Communist Party Congress.

Deployment:

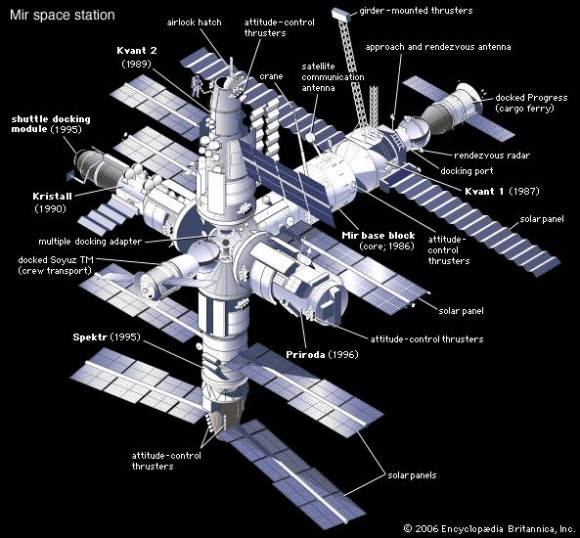
On February 19th, 1986, the assembly process began with the launching of Mir’s core module on a Proton-K rocket into orbit. Between 1987 and 1996, four of the six modules were launched and added to the station – Kvant-2 in 1989, Kristall in 1990, Spektr in 1995 and Priroda in 1996. In these cases, the modules were sent into orbit aboard a Proton-K, chased the station automatically, and then used their robot Lyappa arms to mate with the core.

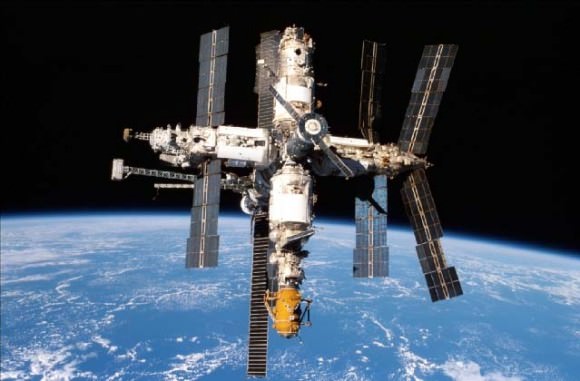
Soviet/Russian space station Mir, after completion in 1996. The date shown for each module is its year of launch. Docked to the station are a Soyuz TM manned spacecraft and an unmanned Progress resupply ferry. Credit: Encyclopedia Britannica
Soviet/Russian space station Mir, after completion in 1996. The date shown for each module is its year of launch. Credit: Encyclopedia Britannica
Kvant-1, having no engines of its own, was delivered by a TKS spacecraft in 1987, while the docking module was brought to the station aboard Space Shuttle Atlantis (STS-74) in 1995. Various other external components, including three truss structures, several experiments and other unpressurized elements, were also mounted to the exterior of the station over the course of its history.

The station’s assembly marked the beginning of the third generation of space station design, being the first to consist of more than one primary spacecraft. First generation stations such as Salyut 1 and Skylab had monolithic designs, consisting of one module with no resupply capability, while second generation stations (Salyut 6 and Salyut 7) comprised a monolithic station with two ports to allow resupply cargo spacecraft (like Progress).

The capability of Mir to be expanded with add-on modules meant that each could be designed with a specific purpose in mind, thus eliminating the need to install all the station’s equipment in one module. After construction was finished, Mir had a collection of facilities. At 13.1 meters (43 feet) long, the “core” module of the station was the main area where the cosmonauts and astronauts did their work. It also housed the main computer and vital space station parts, such as communications.

In addition to solar arrays and a docking port, the station had several facilities for orbital science. These included, but were not limited to, the two Kvant modules (where astronomy and other scientific research was conducted), the Kristall module (which had a facility for microgravity manufacturing) and Spektr (focused on Earth work).

A view of the Russian space station Mir on 3 July 1993 as seen from Soyuz TM-17. Credit: spacefacts.de

Missions:

During its 15-year spaceflight, Mir was visited by a total of 28 long-duration, or “principal”, crews. Expeditions varied in length, but generally lasted around six months. Principal expedition crews consisted of two to three crew members, who often launched as part of one expedition but returned with another.

As part of the Soviet Union’s manned spaceflight program effort to maintain a long-term research outpost in space, operated by the new Russian Federal Space Agency after 1991, the vast majority of the station’s crew were Russian. However, through international collaborations, the station was made accessible to astronauts from North America, several European nations and Japan.

Collaborative programs included the Intercosmos, Euromir and Shuttle-Mir programs. Intercosmos, which ran from 1978-1988, involved astronauts from other Warsaw Pact Nations, other socialist nations – like Afghanistan, Cuba, Mongolia, and Vietnam – and pro-Soviet non-aligned nations such as India, Syria, and even France.

Euromir, which began in the 1990s, was a collaborative effort between the Russian Federal Space Agency and the European Space Agency (ESA) to bring European astronauts to the space station. With help provided by the NASA Space Shuttle program, the goal was to recruit and train European astronauts for the then-planned International Space Station.

Meanwhile, the Shuttle–Mir Program was a collaborative space program between Russia and the United States, and involved American Space Shuttles visiting the space station, Russian cosmonauts flying on the shuttle, and an American astronaut flying aboard a Soyuz spacecraft to engage in long-duration expeditions aboard Mir.
A view of the US Space Shuttle Atlantis and the Russian Space Station Mir during STS-71 as seen by the crew of Mir EO-19 in Soyuz TM-21. Credit: NASA

By the time of the station’s deorbit, it had been visited by 104 different people from twelve different nations, making it the most visited spacecraft in history (a record later surpassed by the International Space Station).

Decommissioning:

When it was launched in 1986, Mir was only supposed to have a life span of about five years, but it proved to have a greater longevity than anyone expected. Unfortunately, a series of technical and structural problems eventually caught up with the station; and in November 2000, the Russian government announced that it would decommission the space station.

This began on Jan. 24th, 2001, when a Russian Progress cargo ship rendezvoused with the station carrying twice its normal amount of fuel. The extra fuel was intended to fire the Progress’ thrusters once it had docked with Mir and push the station into a controlled descent through the Earth’s atmosphere.

The Russian government purchased insurance just in case the space station hit any populated area when it crashed to Earth. Luckily, the station ended up crashing into the South Pacific Ocean, landing about 2,897 kilometers from New Zealand. In 2001, former RKA General Director Yuri Koptev estimated that the cost of the Mir program to be $4.2 billion (including development, assembly and orbital operation).

Legacy:

The Mir Space Station endured for 15 years in orbit, three times its planned lifetime. It hosted scores of crew members and international visitors, raised the first crop of wheat to be grown from seed to seed in outer space, and served as a symbol of Russia’s past glories and it’s potential as a future leader in space exploration.

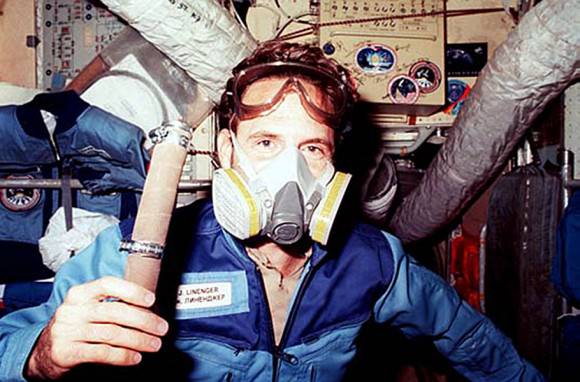
Jerry Linenger dons a mask during his mission on Mir in 1997. Credit: NASA

In addition, the station was a source of controversy over the years, due to the many accidents and hazards it endured. The most famous of these took place on February 24, 1997 during mission STS-81. On this occasion, which saw the Space Shuttle Atlantis delivering crew, supplies, and conducting a series of tests, the worst fire aboard an orbiting spacecraft broke out.

This caused failures in various on-board systems, a near collision with a Progress resupply cargo ship during a long-distance manual docking system test, and a total loss of station electrical power. The power failure also caused a loss of attitude control, which led to an uncontrolled “tumble” through space. Luckily, the crew managed to suppress the fire and regain control before long.

Another major incident took place on June 25th, when a Progress resupply ship collided with solar arrays on the Spektr module, creating a hole which caused the station to lose pressure. This was the first orbital depressurization in the history of spaceflight to take place. Luckily, no astronauts were lost while serving aboard the station.

Mir is also famous for hosting long-duration missions during its early years in space. Topping the list was Russian cosmonaut Valeri Polyakov, who spent nearly 438 days aboard Mir and landed on March 22, 1995. The station itself orbited the Earth more than 86,000 times during its lifespan, and was also the largest orbiting object in the Solar System.

But most importantly of all, Mir served as the stage for the first large-scale, technical partnership between Russia and the United States after a half-century of mutual antagonism. Without it, there would be no ISS today, and numerous joint-research efforts between NASA, the ESA, Russia, and other federal space agencies, would not have been possible.

We have written many interesting articles about space stations here at Universe Today. Here’s What is the International Space Station?, Fire! How the Mir Incident Changed Space Station History, The Mir Space Station: An Unlikely Place for a Beautiful Art Exhibit, and Mir’s Fiery Re-entry, March 23, 2001.

For more information, check out the Mir Space Station and Shuttle-Mir.

And Astronomy Cast has a wonderful episode on Mir, titled Episode 297: Space Stations, Part 2: Mir

Source:

Ceres Has Lots of Bright Spots

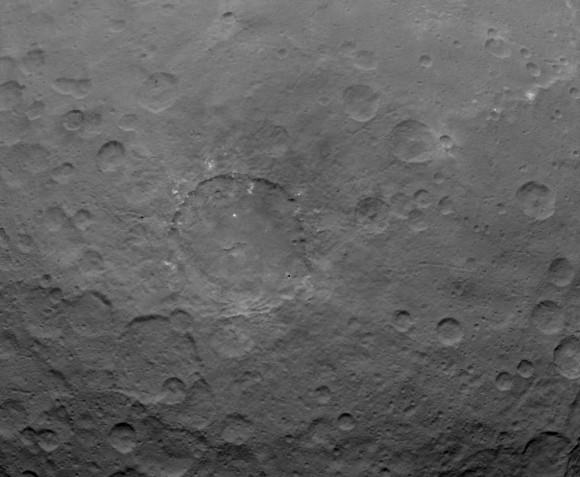
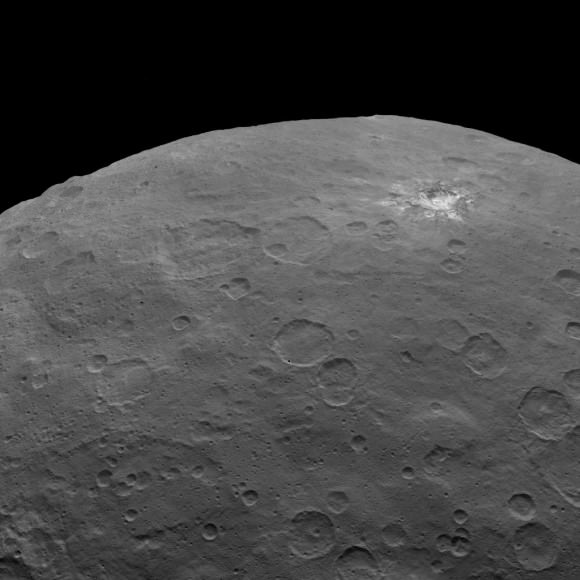
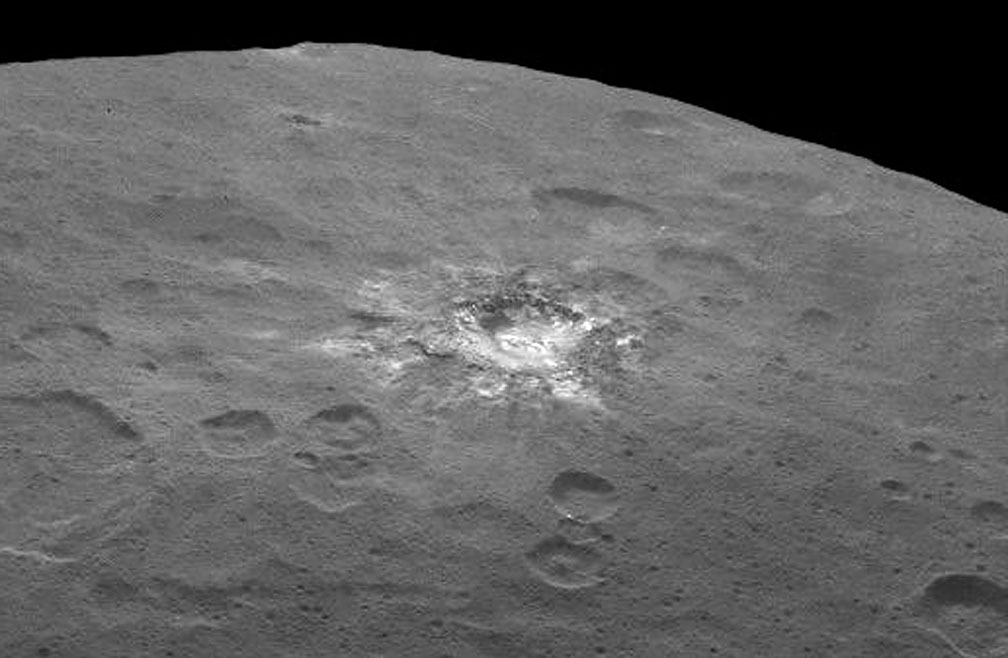
A rayed crater on Ceres with a great deal of fresh material (ice?) exposed by impact. Credit: NASA

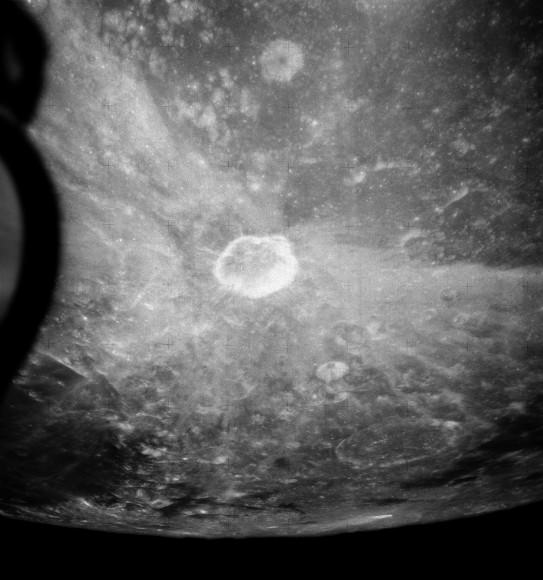
Those bright mystery spots aren’t the only ones on Ceres. Recent photos posted on JPL’s Photojournal site  feature a spectacular rayed crater resembling the familiar lunar craters Kepler and Copernicus.

Unique view of the lunar crater Proclus showing an extension system of bright rays taken from Apollo 15. Credit: NASA
Bright dribs and drabs of material are seen in this photo taken by Dawn on May 22, 2015 from 3,200 miles (5,100 km). Credit: NASA
Bright dots and patches of material are seen in this photo taken by Dawn on May 22, 2015 from 3,200 miles (5,100 km) away. Credit: NASA/JPL-Caltech/UCLA/MPS/DLR/IDA
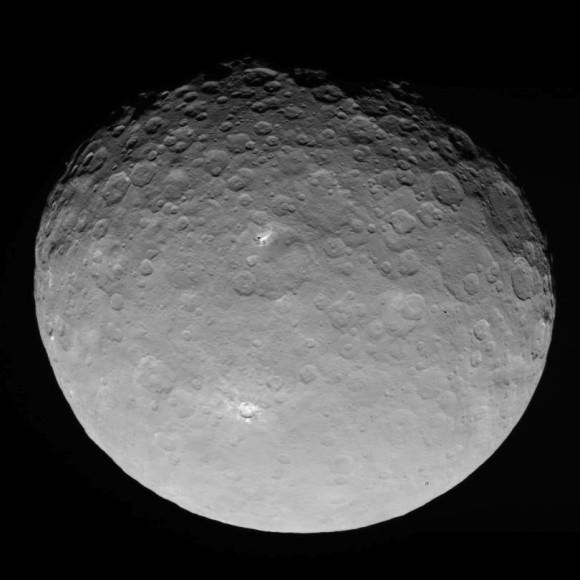
Taken back on May 4 from 8,400 miles, this photo shows the rayed crater (bottom) and another bright spot. Credit:
Taken back on May 4 from 8,400 miles (13,600 km), this photo shows the rayed crater (bottom) and another bright spot above center. Credit: NASA/JPL-Caltech/UCLA/MPS/DLR/IDA

Lunar rays are bright because they contrast with their older surroundings which have been darkened by exposure to solar and cosmic radiation. Impacts expose fresh material from below the surface that settles into a spider web of rays around the newly excavated crater. Huge boulders lofted above the Moon’s surface during the impact slam back into the crust to create secondary craters also crowned with bright dust and rock.

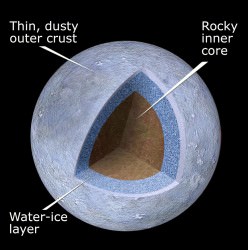
Based on Ceres' density, it contains a large fraction of low density materials including clays, water ice, salts and organic compounds. This schematic gives a general idea of the dwarf planet's makeup. Credit: NASA/ESA/STScI
Based on Ceres’ density, it contains a large fraction of low density materials including clays, water ice, salts and organic compounds. This schematic gives a general idea of the dwarf planet’s makeup. Credit: NASA/ESA/STScI

Most models of Ceres depict a rocky crust,  mantle of ice and a rocky inner core.  This makes us wonder if the bright material unearthed might be ice. If so, it would gradually vaporize on the virtually air-free dwarf planet.

Dawn will spend through early 2016 at Ceres during its primary mission and then remain in orbit there perpetually. We should be able to cipher the composition of the white material during that time with the spacecraft’s Gamma Ray and Neutron Detector and Visible and Infrared Mapping Spectrometer, but a lengthy stay might allow us to see changes in the extent of any ice exposures as they gradually vaporize away.

Uncropped, untoned view of the rayed crater seen in the earlier image. Credit:
Uncropped, untoned view of the rayed crater seen in the earlier image. Credit: NASA/JPL-Caltech/UCLA/MPS/DLR/IDA

One thing we know for certain about Ceres are its dimensions. Dawn observations have revised the size to be about 599 miles (963 km) across at the equator with a polar diameter of 554 miles (891 km). Like Earth and other planets, Ceres is a slightly flattened sphere wider at the equator than from pole to pole. The temperature there ranges from about -100°F (-73°C) during the day and dips to -225°F (-143°C) at night. That makes its daytime high about 28° warmer than coldest temperature ever recorded on Earth.