A montage of planets and other objects in the solar system. Credit: NASA/JPL
While the universe is a big place to study, we shouldn’t forget our own backyard. With eight planets and a wealth of smaller worlds to look at, there’s more than enough to learn for a few lifetimes!
So what are some of the most surprising things about the planets? We’ve highlighted a few things below.
1. Mercury is hot, but not too hot for ice
The closest planet to the Sun does indeed have ice on its surface. That sounds surprising at first glance, but the ice is found in permanently shadowed craters — those that never receive any sunlight. It is thought that perhaps comets delivered this ice to Mercury in the first place. In fact, NASA’s MESSENGER spacecraft not only found ice at the north pole, but it also found organics, which are the building blocks for life. Mercury is way too hot and airless for life as we know it, but it shows how these elements are distributed across the Solar System.
2. Venus doesn’t have any moons, and we aren’t sure why.
Both Mercury and Venus have no moons, which can be considered a surprise given there are dozens of other ones around the Solar System. Saturn has over 60, for example. And some moons are little more than captured asteroids, which may have been what happened with Mars’ two moons, for example. So what makes these planets different? No one is really sure why Venus doesn’t, but there is at least one stream of research that suggests it could have had one in the past.
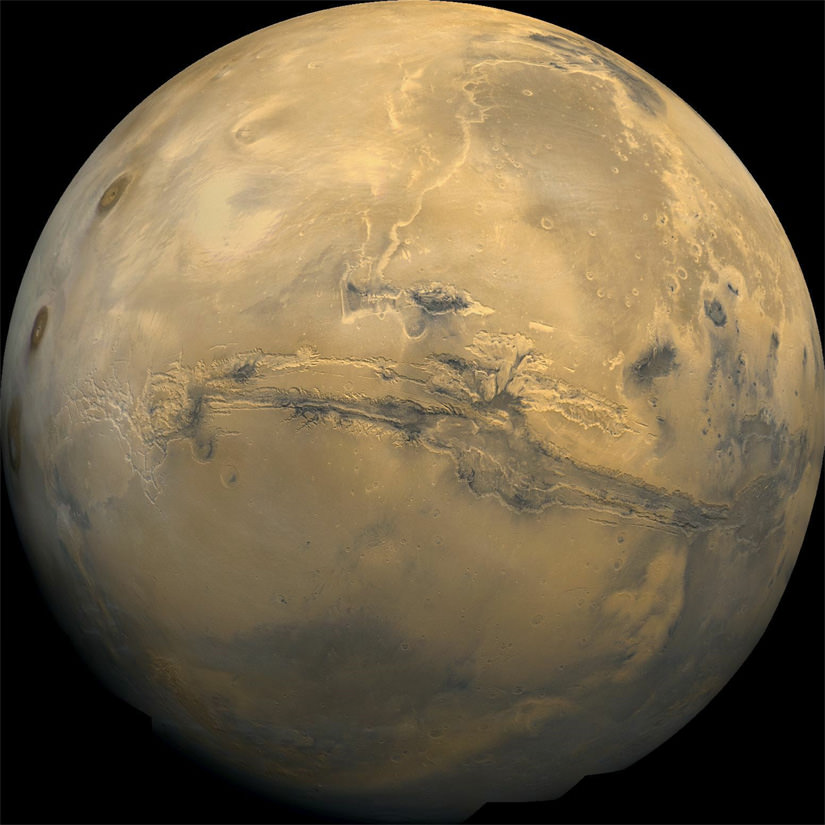
Mars, as it appears today, Credit: NASA
3. Mars had a thicker atmosphere in the past.
What a bunch of contrasts in the inner Solar System: practically atmosphere-less Mercury, a runaway hothouse greenhouse effect happening in Venus’ thick atmosphere, temperate conditions on much of Earth and then a thin atmosphere on Mars. But look at the planet and you can see gullies carved in the past from probable water. Water requires more atmosphere, so Mars had more in the past. Where did it go? Some scientists believe it’s because the Sun’s energy pushed the lighter molecules out of Mars’ atmosphere over millions of years, decreasing the thickness over time.
4. Jupiter is a great comet catcher.
The most massive planet in the Solar System probably had a huge influence on its history. At 318 times the mass of Earth, you can imagine that any passing asteroid or comet going near Jupiter has a big chance of being caught or diverted. Maybe Jupiter was partly to blame for the great bombardment of small bodies that peppered our young Solar System early in its history, causing scars you can still see on the Moon today. And in 1994, astronomers worldwide were treated to a rare sight: a comet, Shoemaker-Levy 9, breaking up under Jupiter’s gravity and slamming into the atmosphere.
Fragmentation of comets is common. Many sungrazers are broken up by thermal and tidal stresses during their perihelions. At top, an image of the comet Shoemaker-Levy 9 (May 1994) after a close approach with Jupiter which tore the comet into numerous fragments. An image taken by Andrew Catsaitis of components B and C of Comet 73P/Schwassmann–Wachmann 3 as seen together on 31 May 2006 (Credit: NASA/HST, Wikipedia, A.Catsaitis)
5. No one knows how old Saturn’s rings are
There’s a field of ice and rock debris circling Saturn that from afar, appear as rings. Early telescope observations of the planet in the 1600s caused some confusion: does that planet have ears, or moons, or what? With better resolution, however, it soon became clear that there was a chain of small bodies encircling the gas giant. It’s possible that a single moon tore apart under Saturn’s strong gravity and produced the rings. Or, maybe they’ve been around (pun intended) for the last few billion years, unable to coalesce into a larger body but resistant enough to gravity not to break up.
6. Uranus is more stormy than we thought.
When Voyager 2 flew by the planet in the 1980s, scientists saw a mostly featureless blue ball and some assumed there wasn’t much activity going on on Uranus. We’ve had a better look at the data since then that does show some interesting movement in the southern hemisphere. Additionally, the planet drew closer to the Sun in 2007, and in more recent years telescope probing has shown some storms going on. What is causing all this activity is difficult to say unless we were to send another probe that way. And unfortunately, there are no missions yet that are slated for sure to zoom out to that part of the Solar System.
Infrared images of Uranus showing storms at 1.6 and 2.2 microns obtained Aug. 6, 2014 by the 10-meter Keck telescope. Credit: Imke de Pater (UC Berkeley) & Keck Observatory images.
7. Neptune has supersonic winds.
While on Earth we are concerned about hurricanes, the strength of these storms is nowhere near what you would find on Neptune. At its highest altitudes, according to NASA, winds blow at more than 1,100 miles per hour (1,770 kilometers per hour). To put that in context, that’s faster than the speed of sound on Earth, at sea level. Why Neptune is so blustery is a mystery, especially considering the Sun’s heat is so little at its distance.
8. You can see Earth’s magnetic field at work during light shows.
We have a magnetic field surrounding our planet that protects us from the blasts of radiation and particles the Sun sends our way. Good thing, too, because such flare-ups could prove deadly to unprotected people; that’s why NASA keeps an eye on solar activity for astronauts on the International Space Station, for example. At any rate, when you see auroras shining in the sky, that’s what happens when the particles from the Sun flow along the magnetic field lines and interact with Earth’s upper atmosphere.
Universe Today has many articles on interesting facts about the planets. Start with 10 facts about Mercury and 10 facts about Venus. You may also want to check out the 10 facts about Mars. Astronomy Cast also has a number of podcasts about the planets, including one on Earth.
A historical reconstruction of what Robert Hooke looked like. Credit: Wikipedia/Rita Greer/FAL
The spring is a marvel of human engineering and creativity. For one, it comes in so many varieties – the compression spring, the extension spring, the torsion spring, the coil spring, etc. – all of which serve different and specific functions. These functions in turn allow for the creation of many man-made objects, most of which emerged as part of the Scientific Revolution during the late 17th and 18th centuries.
As an elastic object used to store mechanical energy, the applications for them are extensive, making possible such things as an automotive suspension systems, pendulum clocks, hand sheers, wind-up toys, watches, rat traps, digital micromirror devices, and of course, the Slinky.
Like so many other devices invented over the centuries, a basic understanding of the mechanics is required before it can so widely used. In terms of springs, this means understanding the laws of elasticity, torsion and force that come into play – which together are known as Hooke’s Law.
Hooke’s Law is a principle of physics that states that the that the force needed to extend or compress a spring by some distance is proportional to that distance. The law is named after 17th century British physicist Robert Hooke, who sought to demonstrate the relationship between the forces applied to a spring and its elasticity.
Illustration of Hooke’s Law, showing the relationship between force and distance when applied to a spring. Credit: GSU/hyperphysics
He first stated the law in 1660 as a Latin anagram, and then published the solution in 1678 as ut tensio, sic vis – which translated, means “as the extension, so the force” or “the extension is proportional to the force”).
This can be expressed mathematically as F= -kX, where F is the force applied to the spring (either in the form of strain or stress); X is the displacement of the spring, with a negative value demonstrating that the displacement of the spring once it is stretched; and k is the spring constant and details just how stiff it is.
Hooke’s law is the first classical example of an explanation of elasticity – which is the property of an object or material which causes it to be restored to its original shape after distortion. This ability to return to a normal shape after experiencing distortion can be referred to as a “restoring force”. Understood in terms of Hooke’s Law, this restoring force is generally proportional to the amount of “stretch” experienced.
In addition to governing the behavior of springs, Hooke’s Law also applies in many other situations where an elastic body is deformed. These can include anything from inflating a balloon and pulling on a rubber band to measuring the amount of wind force is needed to make a tall building bend and sway.
This law has had many important practical applications, with one being the creation of a balance wheel, which made possible the creation of the mechanical clock, the portable timepiece, the spring scale and the manometer (aka. the pressure gauge). Also, because it is a close approximation of all solid bodies (as long as the forces of deformation are small enough), numerous branches of science and engineering as also indebted to Hooke for coming up with this law. These include the disciplines of seismology, molecular mechanics and acoustics.
However, like most classical mechanics, Hooke’s Law only works within a limited frame of reference. Because no material can be compressed beyond a certain minimum size (or stretched beyond a maximum size) without some permanent deformation or change of state, it only applies so long as a limited amount of force or deformation is involved. In fact, many materials will noticeably deviate from Hooke’s law well before those elastic limits are reached.
Still, in its general form, Hooke’s Law is compatible with Newton’s laws of static equilibrium. Together, they make it possible to deduce the relationship between strain and stress for complex objects in terms of the intrinsic materials of the properties it is made of. For example, one can deduce that a homogeneous rod with uniform cross section will behave like a simple spring when stretched, with a stiffness (k) directly proportional to its cross-section area and inversely proportional to its length.
The balance wheel in a cheap 1950s alarm clock (the Apollo, by Lux Mfg. Co.) showing the balance wheel (1) and regulator (2). Credit: Wikipedia/Public Domain
Another interesting thing about Hooke’s law is that it is a a perfect example of the First Law of Thermodynamics. Any spring when compressed or extended almost perfectly conserves the energy applied to it. The only energy lost is due to natural friction.
In addition, Hooke’s law contains within it a wave-like periodic function. A spring released from a deformed position will return to its original position with proportional force repeatedly in a periodic function. The wavelength and frequency of the motion can also be observed and calculated.
The modern theory of elasticity is a generalized variation on Hooke’s law, which states that the strain/deformation of an elastic object or material is proportional to the stress applied to it. However, since general stresses and strains may have multiple independent components, the “proportionality factor” may no longer be just a single real number.
A good example of this would be when dealing with wind, where the stress applied varies in intensity and direction. In cases like these, it is best to employ a linear map (aka. a tensor) that can be represented by a matrix of real numbers instead of a single value.
If you enjoyed this article there are several others that you will enjoy on Universe Today. Here is one about Sir Isaac Newton’s contributions to the many fields of science. Here is an interesting article about gravity.
There are also some great resources online, such as this lecture on Hooke’s Law that you can watch on academicearth.org. There is also a great explanation of elasticity on howstuffworks.com.
Mars is a constant point of discussion for space explorers around the world. We’ve sent dozens of spacecraft there to study it. Some want to land astronauts on it. The planet is just far away to make that dream difficult, but just close enough to spark our imagination. So what are some of the most important things to learn about the Red Planet?
Hi, I’m Mike Romine, the current president of the Richland Astronomical Society, at Warren Rupp Observatory, in Mansfield, Ohio.
This email is to inform you, and I hope you’ll pass it along to your readers, that Tammy Plotner passed away Feb. 11, 2015. Her longtime battle with MS finally took it’s toll.
Thanks,
Mike
Tammy was the first regular contributor to Universe Today. She started with me in 2004, reporting on what amateur astronomers might see in the night sky using an archaic WebTV to write and send in her stories. When she started, Tammy was… rough. She was enthusiastic, but very wordsy and needed a tremendous amount of editing. But her enthusiasm for the night sky was infectious, and over time, her writing tightened up; wordiness became poetry that described the night sky in amazing detail and made you drag your scope out into the darkness for just a peek.
In 2006, Tammy took things to the next level for us and wrote an actual book. We called it What’s Up 2006: 365 Days of Skywatching. We offered it as a free PDF book, and it was downloaded hundreds of thousands of times, and purchased in print form. We did another edition in 2007, and then Springer continued the franchise with Tammy directly.
Tammy continued to write for me off and on until just a few months ago. She would disappear for a few months at a time, and I eventually discovered that was because she was suffering from MS. It was making it more and more difficult to get on with the basics of life, let alone set aside the time to write about astronomy.
Our senior editor Nancy Atkinson said she learned a lot from Tammy: “I was honored to work with Tammy and her articles were a joy to read. She had a unique but professional perspective on the latest astronomy news and she relished the chance to share new findings with her readers. We will miss her expertise and her endless enthusiasm, and she will be greatly missed in the astronomy community.”
I never met Tammy, that’s the curse of living our lives online. We build relationships with people through email messages and chat, but we can go a decade working side by side and never meet in person. That makes me sad. I should have made the effort to hang out with her.
Farewell Tammy, thanks for everything. I’m sorry for your struggle, but I’m grateful for how much you taught me about the sky, and I’ll keep on sharing it with anyone who’ll listen – just like you did.
There’s a famous line from Shakespeare’s Hamlet that says “There are more things in heaven and Earth, Horatio, than are dreamt of in your philosophy,” and the same now holds true for brave new worlds for humans to explore.
This result was published earlier this week courtesy of the NASA/JPL Near-Earth Program Office. The study found that the number of possible asteroid targets for human exploration has now doubled from the 666 known in the first study, completed in late 2010.
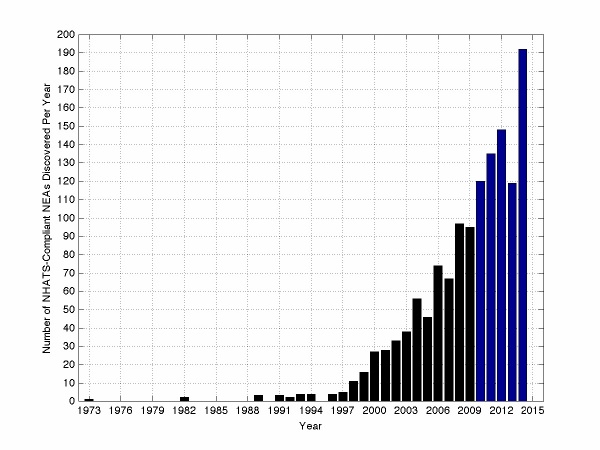
NHATS NEO asteroid discoveries by year. Credit: NASA/GFSC/Brent Barbee
This information comes from NHATS, which stands for the Near Earth Object Human Spaceflight Accessible Targets Study. Yes, it’s an acronym containing acronyms. NHATS is an automated system based out of Greenbelt, Maryland which monitors and periodically updates its list of potential target candidates for accessibility. The NHATS system data is readily accessible to the public online, and as of February 11th 2015, 1346 NHATS compliant asteroids are known.
This is the Holy Grail for the future of manned spaceflight, and will represent a good stepping stone (bad pun intended) for future crewed missions to Mars. Several hundred NHATS asteroids require less time and energy to reach than the Red Planet, and a few dozen even require less energy to reach than it does to enter lunar orbit.
Relative delta-V and return velocity is crucial. Apollo astronauts were subject to a blistering 11 kilometre per second reentry velocity on their return from the Moon, and future asteroid missions would be subject to the same style of trajectory on return to Earth from a solar orbit.
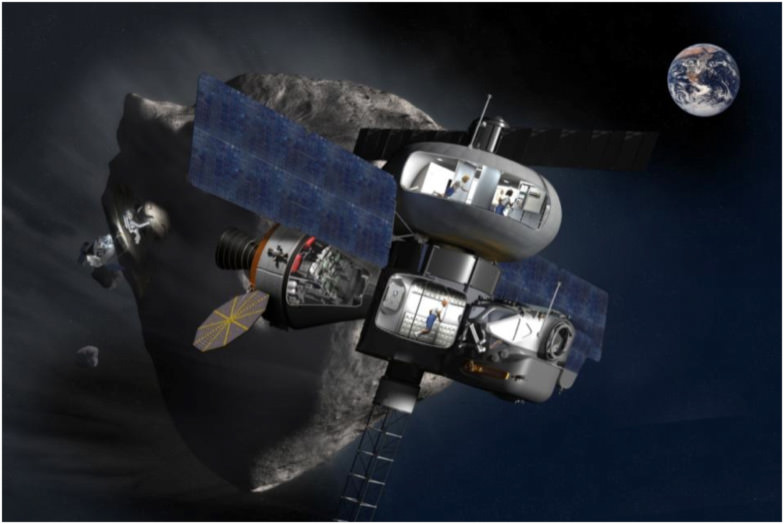
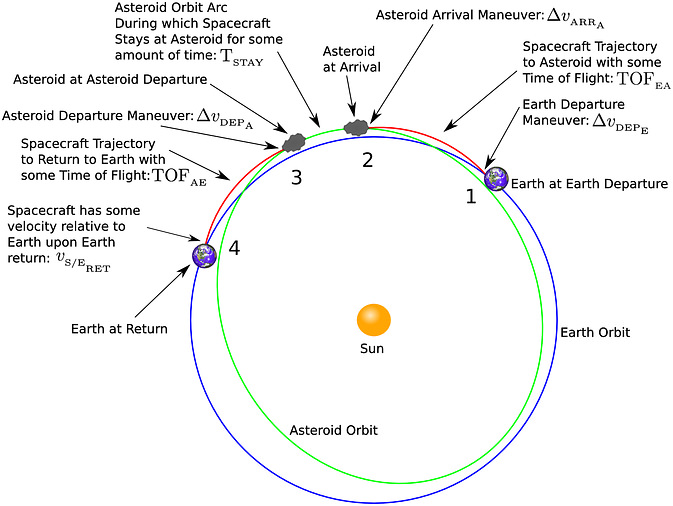
Mission to an NEO: a typical orbital profile. Credit: Brent Barbee/NASA/GSFC
The test of the Orion heat shield on reentry during last year’s EFT-1 flight was a step in this direction, and the next test will be an uncrewed launch atop an SLS rocket in September 2018. If all goes according to schedule — and NASA can successfully weather the ever-shifting political winds of multiple future changes of administration — expect to see astronauts exploring an NHATS asteroid placed in lunar orbit sometime around late 2023.
I know. “When I was a kid back in the 70’s…” we expected to be vacationing on Callisto by 2015, as well.
Brent Barbee at NASA’s Goddard Space Flight Center designed the automated NHATS system. It pulls data from a source that many comet and asteroid hunters are familiar with: JPL’s Small Bodies Database. The NHATS system then makes trajectory calculations and patches in conical solutions for possible spacecraft trajectories and actually gives potential launch window dates for future missions. Seriously, its fun to play with… you can even tailor and filter these by target dates versus maximum velocity constraints and the length of stays.
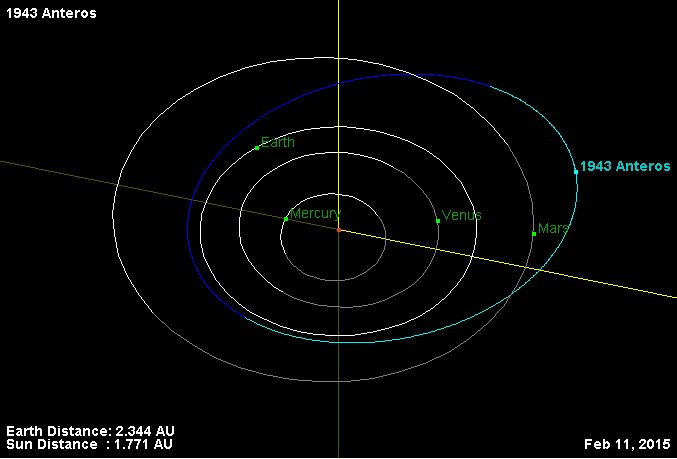
The orbit of asteroid 1943 Anteros. Credit: NASA/JPL.
The first discovered NHATS-compliant NEO was 2.3 kilometre 1943 Anteros way back in 1973, and famous alumni on the NHATS list also include 10 metre asteroid 2011 MD, which passed 12,000 kilometres from the Earth on June 27th, 2011. 2011 MD is on NASA’s short list of asteroids ideal for human exploration. Another famous asteroid on the NHATS list is 99942 Apophis which — triskaidekaphobics take note — will safely miss the Earth by 31,300 kilometres on Friday the 13th, April 2029. More are added every day, and the growing curve of discoveries also closely mirrors the rise of automated all-sky surveys such as LINEAR, PanSTARRS and the Catalina Sky Survey, though dedicated amateurs do get in on the act occasionally as well.
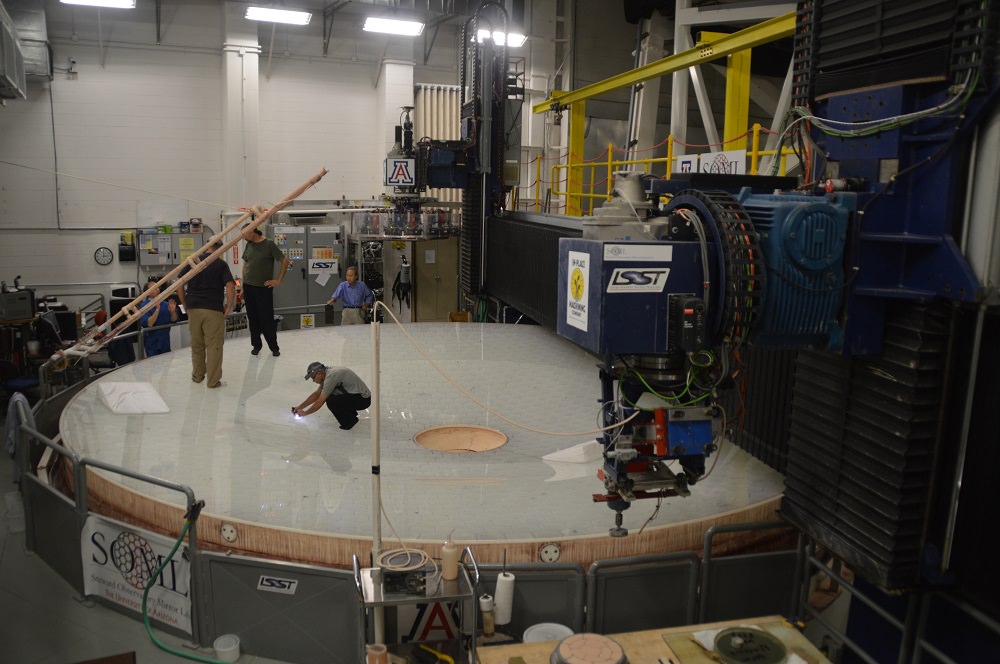
To date, over 12,000 NEA asteroids are now known, and you can expect future surveys such as the Large Synoptic Survey Telescope set to see first light in 2021 to add to their ranks. The Sentinel space telescope set to launch in 2017 will also boost the known number of NEOs as it covers our sunward blind spot from an orbit interior to the Earth’s. Remember Chelyabinsk? That could actually be a great rallying cry for Sentinel’s cause, as the asteroid came at the Earth from a sunward direction and avoided the sky sweeping robotic eyes of astronomers.
Sometimes, NEOs turn out to be returning space junk from the early Space Age (a low relative velocity and low orbital inclination is often a dead giveaway). Earth has also been known to capture an NEO as an occasional temporary second Moon, as occurred in 2006 in the case of asteroid 2006 RH120.
The LSST mirror in the Tuscon Mirror Lab. Photo by author.
But beyond just creating a database, the NHATS system also presents key opportunities for astronomers to perform follow-up observations of NEO asteroids, which is vital for precisely characterizing their orbits. Two future missions are also planned to return samples from NHATS asteroids: Hayabusa 2, which launched on December 3rd 2014 headed for asteroid 1999 JU3 in July 2018, and the OSIRIS-REx mission, set to launch in late 2016 headed for asteroid 101955 Bennu in 2018.
NHATS is providing a crucial target list for that day when first human footfall on an asteroid occurs… or should we say docking?
Betelgeuse was the first star directly imaged -- besides our own Sun, of course. Image obtained by the Hubble Space Telescope. Credit: Andrea Dupree (Harvard-Smithsonian CfA), Ronald Gilliland (STScI), NASA and ESA
While there are untold billions of celestial objects visible in the nighttime sky, some of them are better known than others. Most of these are stars that are visible to the naked eye and very bright compared to other stellar objects. For this reason, most of them have a long history of being observed and studied by human beings, and most likely occupy an important place in ancient folklore.
So without further ado, here is a sampling of some of the better-known stars in that are visible in the nighttime sky:
Polaris: Also known as the North Star (as well as the Pole Star, Lodestar, and sometimes Guiding Star), Polaris is the 45th brightest star in the night sky. It is very close to the north celestial pole, which is why it has been used as a navigational tool in the northern hemisphere for centuries. Scientifically speaking, this star is known as Alpha Ursae Minoris because it is the alpha star in the constellation Ursa Minor (the Little Bear).
The Polaris star system, as seen within the Ursa Minor constellation and up close. Credit: NASA, ESA, N. Evans (Harvard-Smithsonian CfA), and H. Bond (STScI)
It’s more than 430 light-years away from Earth, but its luminosity (being a white supergiant) makes it highly visible to us here on Earth. What’s more, rather than being a single supergiant, Polaris is actually a trinary star system, comprised of a main star (alpha UMi Aa) and two smaller companions (alpha UMi B, alpha UMi Ab). These, along with its two distant components (alpha UMi C, alpha UMi D), make it a multistar system.
Interestingly enough, Polaris wasn’t always the north star. That’s because Earth’s axis wobbles over thousands of years and points in different directions. But until such time as Earth’s axis moves farther away from the “Polestar”, it remains our guide.
Because it is what is known as a Cepheid variable star – i.e. a star that pulsates radially, varying in both temperature and diameter to produce brightness changes – it’s distance to our Sun has been the subject of revision. Many scientific papers suggest that it may be up to 30% closer to our Solar System than previously expected – putting it in the vicinity of 238 light years away.
Time exposure centered on Polaris, the North Star. Notice that the closer stars are to Polaris, the smaller the circles they describe. Stars at the edge of the frame make much larger circles. Credit: Bob King
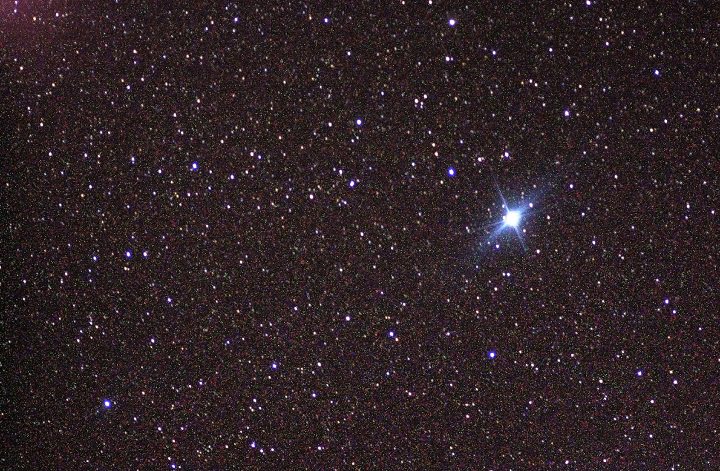
Sirius: Also known as the Dog Star, because it’s the brightest star in Canis Major (the “Big Dog”), Sirius is also the brightest star in the night sky. The name “Sirius” is derived from the Ancient Greek “Seirios“, which translates to “glowing” or “scorcher”. Whereas it appears to be a single bright star to the naked eye, Sirius is actually a binary star system, consisting of a white main-sequence star named Sirius A, and a faint white dwarf companion named Sirius B.
The reason why it is so bright in the sky is due to a combination of its luminosity and distance – at 6.8 light years, it is one of Earth’s nearest neighbors. And in truth, it is actually getting closer. For the next 60,000 years or so, astronomers expect that it will continue to approach our Solar System; at which point, it will begin to recede again.
In ancient Egypt, it was seen as a signal that the flooding of the Nile was close at hand. For the Greeks, the rising of Sirius in the night sky was a sign of the”dog days of summer”. To the Polynesians in the southern hemisphere, it marked the approach of winter and was an important star for navigation around the Pacific Ocean.
Alpha Centauri System: Also known as Rigel Kent or Toliman, Alpha Centauri is the brightest star in the southern constellation of Centaurus and the third brightest star in the night sky. It is also the closest star system to Earth, at just a shade over four light-years. But much like Sirius and Polaris, it is actually a multistar system, consisting of Alpha Centauri A, B, and Proxima Centauri (aka. Centauri C).
Artist’s impression of the planet around Alpha Centauri B. Credit: ESO
Based on their spectral classifications, Alpha Centauri A is a main sequence white dwarf with roughly 110% of the mass and 151.9% the luminosity of our Sun. Alpha Centauri B is an orange subgiant with 90.7% of the Sun’s mass and 44.5% of its luminosity. Proxima Centauri, the smallest of the three, is a red dwarf roughly 0.12 times the mass of our Sun, and which is the closest of the three to our Solar System.
English explorer Robert Hues was the first European to make a recorded mention of Alpha Centauri, which he did in his 1592 work Tractatus de Globis. In 1689, Jesuit priest and astronomer Jean Richaud confirmed the existence of a second star in the system. Proxima Centauri was discovered in 1915 by Scottish astronomer Robert Innes, Director of the Union Observatory in Johannesburg, South Africa.
Betelgeuse: Pronounced “Beetle-juice” (yes, the same as the 1988 Tim Burton movie), this bright red supergiant is roughly 65o light-year from Earth. Also known as Alpha Orionis, it is nevertheless easy to spot in the Orion constellation since it is one of the largest and most luminous stars in the night sky.
Betelgeuse, as seen by the Hubble Space Telescope, and in relation to the Orion constellation. Credit: NASA
The star’s name is derived from the Arabic name Ibt al-Jauza’, which literally means “the hand of Orion”. In 1985, Margarita Karovska and colleagues from the Harvard–Smithsonian Center for Astrophysics, announced the discovery of two close companions orbiting Betelgeuse. While this remains unconfirmed, the existence of possible companions remains an intriguing possibility.
What excites astronomers about Betelgeuse is it will one day go supernova, which is sure to be a spectacular event that people on Earth will be able to see. However, the exact date of when that might happen remains unknown.
Rigel: Also known as Beta Orionis, and located between 700 and 900 light years away, Rigel is the brightest star in the constellation Orion and the seventh brightest star in the night sky. Here too, what appears to be a blue supergiant is actually a multistar system. The primary star (Rigel A) is a blue-white supergiant that is 21 times more massive than our sun, and shines with approximately 120,000 times the luminosity.
Rigel B is itself a binary system, consisting of two main sequence blue-white subdwarf stars. Rigel B is the more massive of the pair, weighing in at 2.5 Solar masses versus Rigel C’s 1.9. Rigel has been recognized as being a binary since at least 1831 when German astronomer F.G.W. Struve first measured it. A fourth star in the system has been proposed, but it is generally considered that this is a misinterpretation of the main star’s variability.
Rigel A is a young star, being only 10 million years old. And given its size, it is expected to go supernova when it reaches the end of its life.
Vega: Vega is another bright blue star that anchors the otherwise faint Lyra constellation (the Harp). Along with Deneb (from Cygnus) and Altair (from Aquila), it is a part of the Summer Triangle in the Northern hemisphere. It is also the brightest star in the constellation Lyra, the fifth brightest star in the night sky and the second brightest star in the northern celestial hemisphere (after Arcturus).
Characterized as a white dwarf star, Vega is roughly 2.1 times as massive as our Sun. Together with Arcturus and Sirius, it is one of the most luminous stars in the Sun’s neighborhood. It is a relatively close star at only 25 light-years from Earth.
Vega was the first star other than the Sun to be photographed and the first to have its spectrum recorded. It was also one of the first stars whose distance was estimated through parallax measurements, and has served as the baseline for calibrating the photometric brightness scale. Vega’s extensive history of study has led it to be termed “arguably the next most important star in the sky after the Sun.”
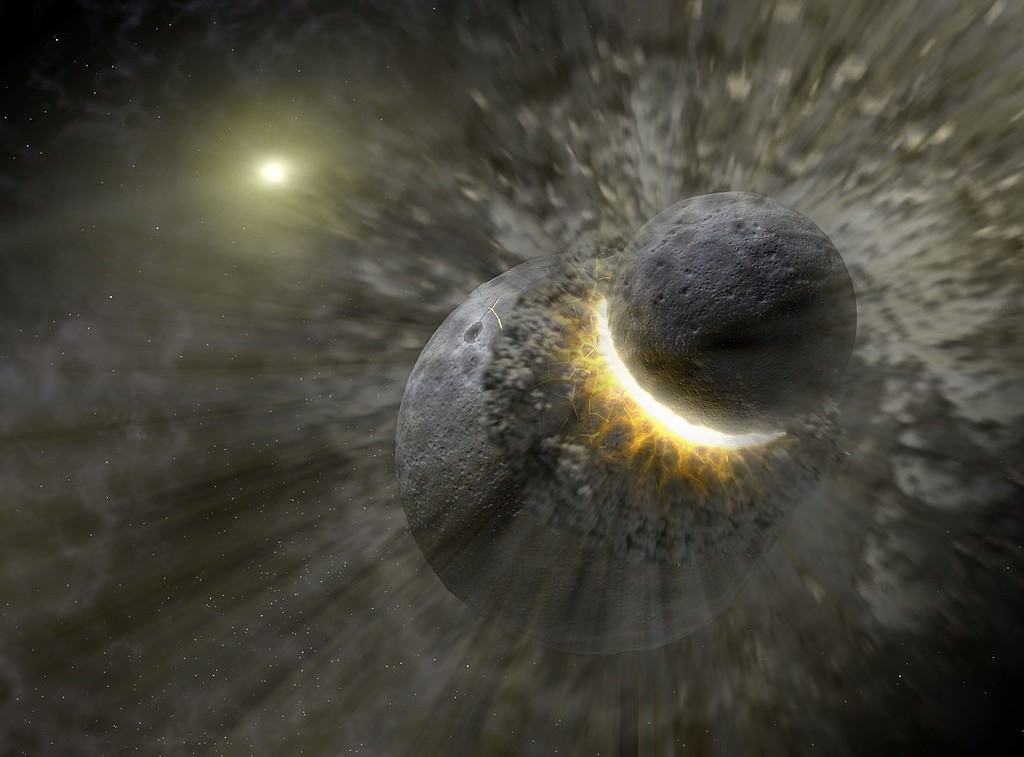
Artist’s concept of a recent massive collision of dwarf planet-sized objects that may have contributed to the dust ring around the star Vega. Credit: NASA/JPL/Caltech/T. Pyle (SSC)
Based on observations that showed excess emission of infrared radiation, Vega is believed to have a circumstellar disk of dust. This dust is likely to be the result of collisions between objects in an orbiting debris disk. For this reason, stars that display an infrared excess because of circumstellar dust are termed “Vega-like stars”.
Thousands of years ago, (ca. 12,000 BCE) Vega was used as the North Star is today, and will be so again around the year 13,727 CE.
Pleiades: Also known as the “Seven Sisters”, Messier 45 or M45, Pleiades is actually an open star cluster located in the constellation of Taurus. At an average distance of 444 light years from our Sun, it is one of the nearest star clusters to Earth, and the most visible to the naked eye. Though the seven largest stars are the most apparent, the cluster actually consists of over 1,000 confirmed members (along with several unconfirmed binaries).
The core radius of the cluster is about 8 light years across, while it measures some 43 light years at the outer edges. It is dominated by young, hot blue stars, though brown dwarfs – which are just a fraction of the Sun’s mass – are believed to account for 25% of its member stars.
Pleiades, also known as M45, is a prominent open star cluster in the sky. Image Credit: Jamie Ball
The age of the cluster has been estimated at between 75 and 150 million years, and it is slowly moving in the direction of the “feet” of what is currently the constellation of Orion. The cluster has had several meanings for many different cultures here on Earth, which include representations in Biblical, ancient Greek, Asian, and traditional Native American folklore.
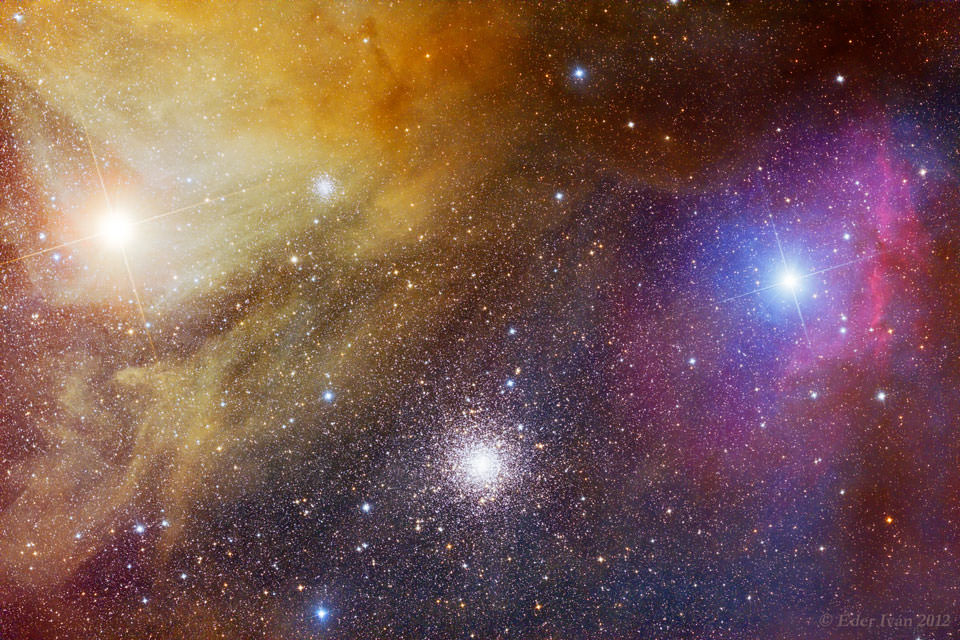
Antares: Also known as Alpha Scorpii, Antares is a red supergiant and one of the largest and most luminous observable stars in the nighttime sky. It’s name – which is Greek for “rival to Mars” (aka. Ares) – refers to its reddish appearance, which resembles Mars in some respects. It’s location is also close to the ecliptic, the imaginary band in the sky where the planets, Moon and Sun move.
This supergiant is estimated to be 17 times more massive, 850 times larger in terms of diameter, and 10,000 times more luminous than our Sun. Hence why it can be seen with the naked eye, despite being approximately 550 light-years from Earth. The most recent estimates place its age at 12 million years.
A red supergiant, Antares is over 850 times the diameter of our own Sun, 15 times more massive, and 10,000 times brighter. Credit: NASA/Ivan Eder
Antares is the seventeenth brightest star that can be seen with the naked eye and the brightest star in the constellation Scorpius. Along with Aldebaran, Regulus, and Fomalhaut, Antares comprises the group known as the ‘Royal stars of Persia’ – four stars that the ancient Persians (circa. 3000 BCE) believed guarded the four districts of the heavens.
Canopus: Also known as Alpha Carinae, this white giant is the brightest star in the southern constellation of Carina and the second brightest star in the nighttime sky. Located over 300 light-years away from Earth, this star is named after the mythological Canopus, the navigator for king Menelaus of Sparta in The Iliad.
Thought it was not visible to the ancient Greeks and Romans, the star was known to the ancient Egyptians, as well as the Navajo, Chinese and ancient Indo-Aryan people. In Vedic literature, Canopus is associated with Agastya, a revered sage who is believed to have lived during the 6th or 7th century BCE. To the Chinese, Canopus was known as the “Star of the Old Man”, and was charted by astronomer Yi Xing in 724 CE.
Image of Canopus, as taken by crew members aboard the ISS. Credit: NASA
It is also referred to by its Arabic name Suhayl (Soheil in persian), which was given to it by Islamic scholars in the 7th Century CE. To the Bedouin people of the Negev and Sinai, it was also known as Suhayl, and used along with Polaris as the two principal stars for navigation at night.
It was not until 1592 that it was brought to the attention of European observers, once again by Robert Hues who recorded his observations of it alongside Achernar and Alpha Centauri in his Tractatus de Globis (1592).
As he noted of these three stars, “Now, therefore, there are but three Stars of the first magnitude that I could perceive in all those parts which are never seene here in England. The first of these is that bright Star in the sterne of Argo which they call Canobus. The second is in the end of Eridanus. The third is in the right foote of the Centaure.”
Tauris argues that a lopsided supernova explosion may be the source of certain hypervelocity stars (image credit: IsiacDaGraca).
Hypervelocity stars have been observed traversing the Galaxy at extreme velocities (700 km/s), but the mechanisms that give rise to such phenomena are still debated. Astronomer Thomas M. Tauris argues that lopsided supernova explosions can eject lower-mass Solar stars from the Galaxy at speeds up to 1280 km/s. “[This mechanism] can account for the majority (if not all) of the detected G/K-dwarf hypervelocity candidates,” he said.
Several mechanisms have been proposed as the source for hypervelocity stars, and the hypotheses can vary as a function of stellar type. A simplified summary of the hypothesis Tauris favors begins with a higher-mass star in a tight binary system, which finally undergoes a core-collapse supernova explosion. The close proximity of the stars in the system partly ensures that the orbital velocities are exceedingly large. The binary system is disrupted by the supernova explosion, which is lopsided (asymmetric) and imparts a significant kick to the emerging neutron star. The remnants of supernovae with massive progenitors are neutron stars or potentially a more exotic object (i.e., black hole).
Conversely, Tauris noted that the aforementioned binary origin cannot easily explain the observed velocities of all higher-mass hypervelocity stars, namely the B-stars, which are often linked to an ejection mechanism from a binary interaction with the supermassive black hole at the Milky Way’s center. Others have proposed that interactions between multiple stars near the centers of star clusters can give rise to certain hypervelocity candidates.
There are several potential compact objects (neutron stars) which feature extreme velocities, such as B2011+38, B2224+65, IGR J11014-6103, and B1508+55, with the latter possibly exhibiting a velocity of 1100 km/s. However, Tauris ends by noting that, “a firm identification of a hypervelocity star being ejected from a binary via a supernova is still missing, although a candidate exists (HD 271791) that’s being debated.”
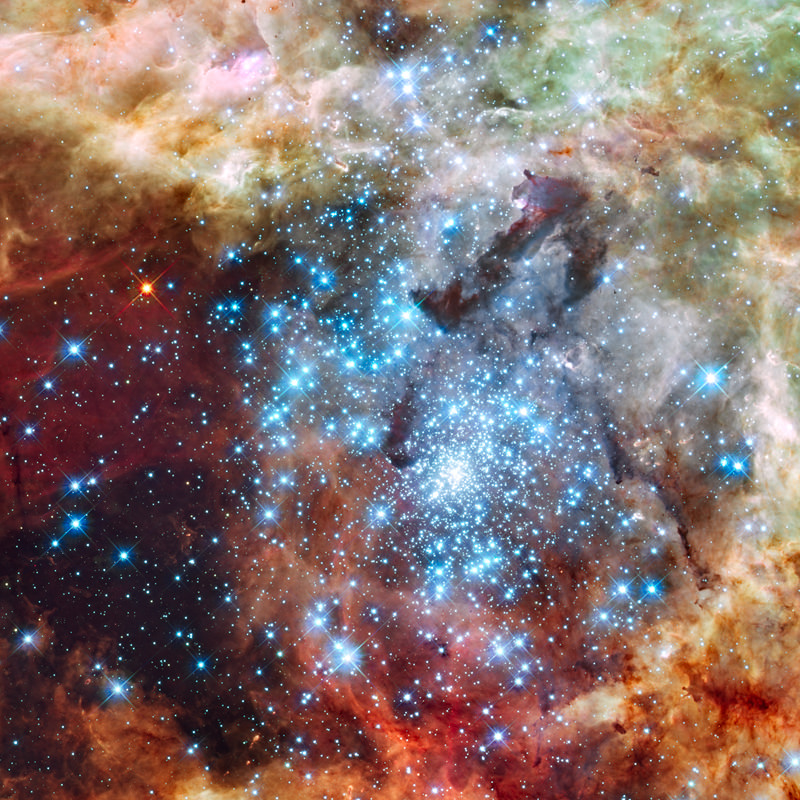
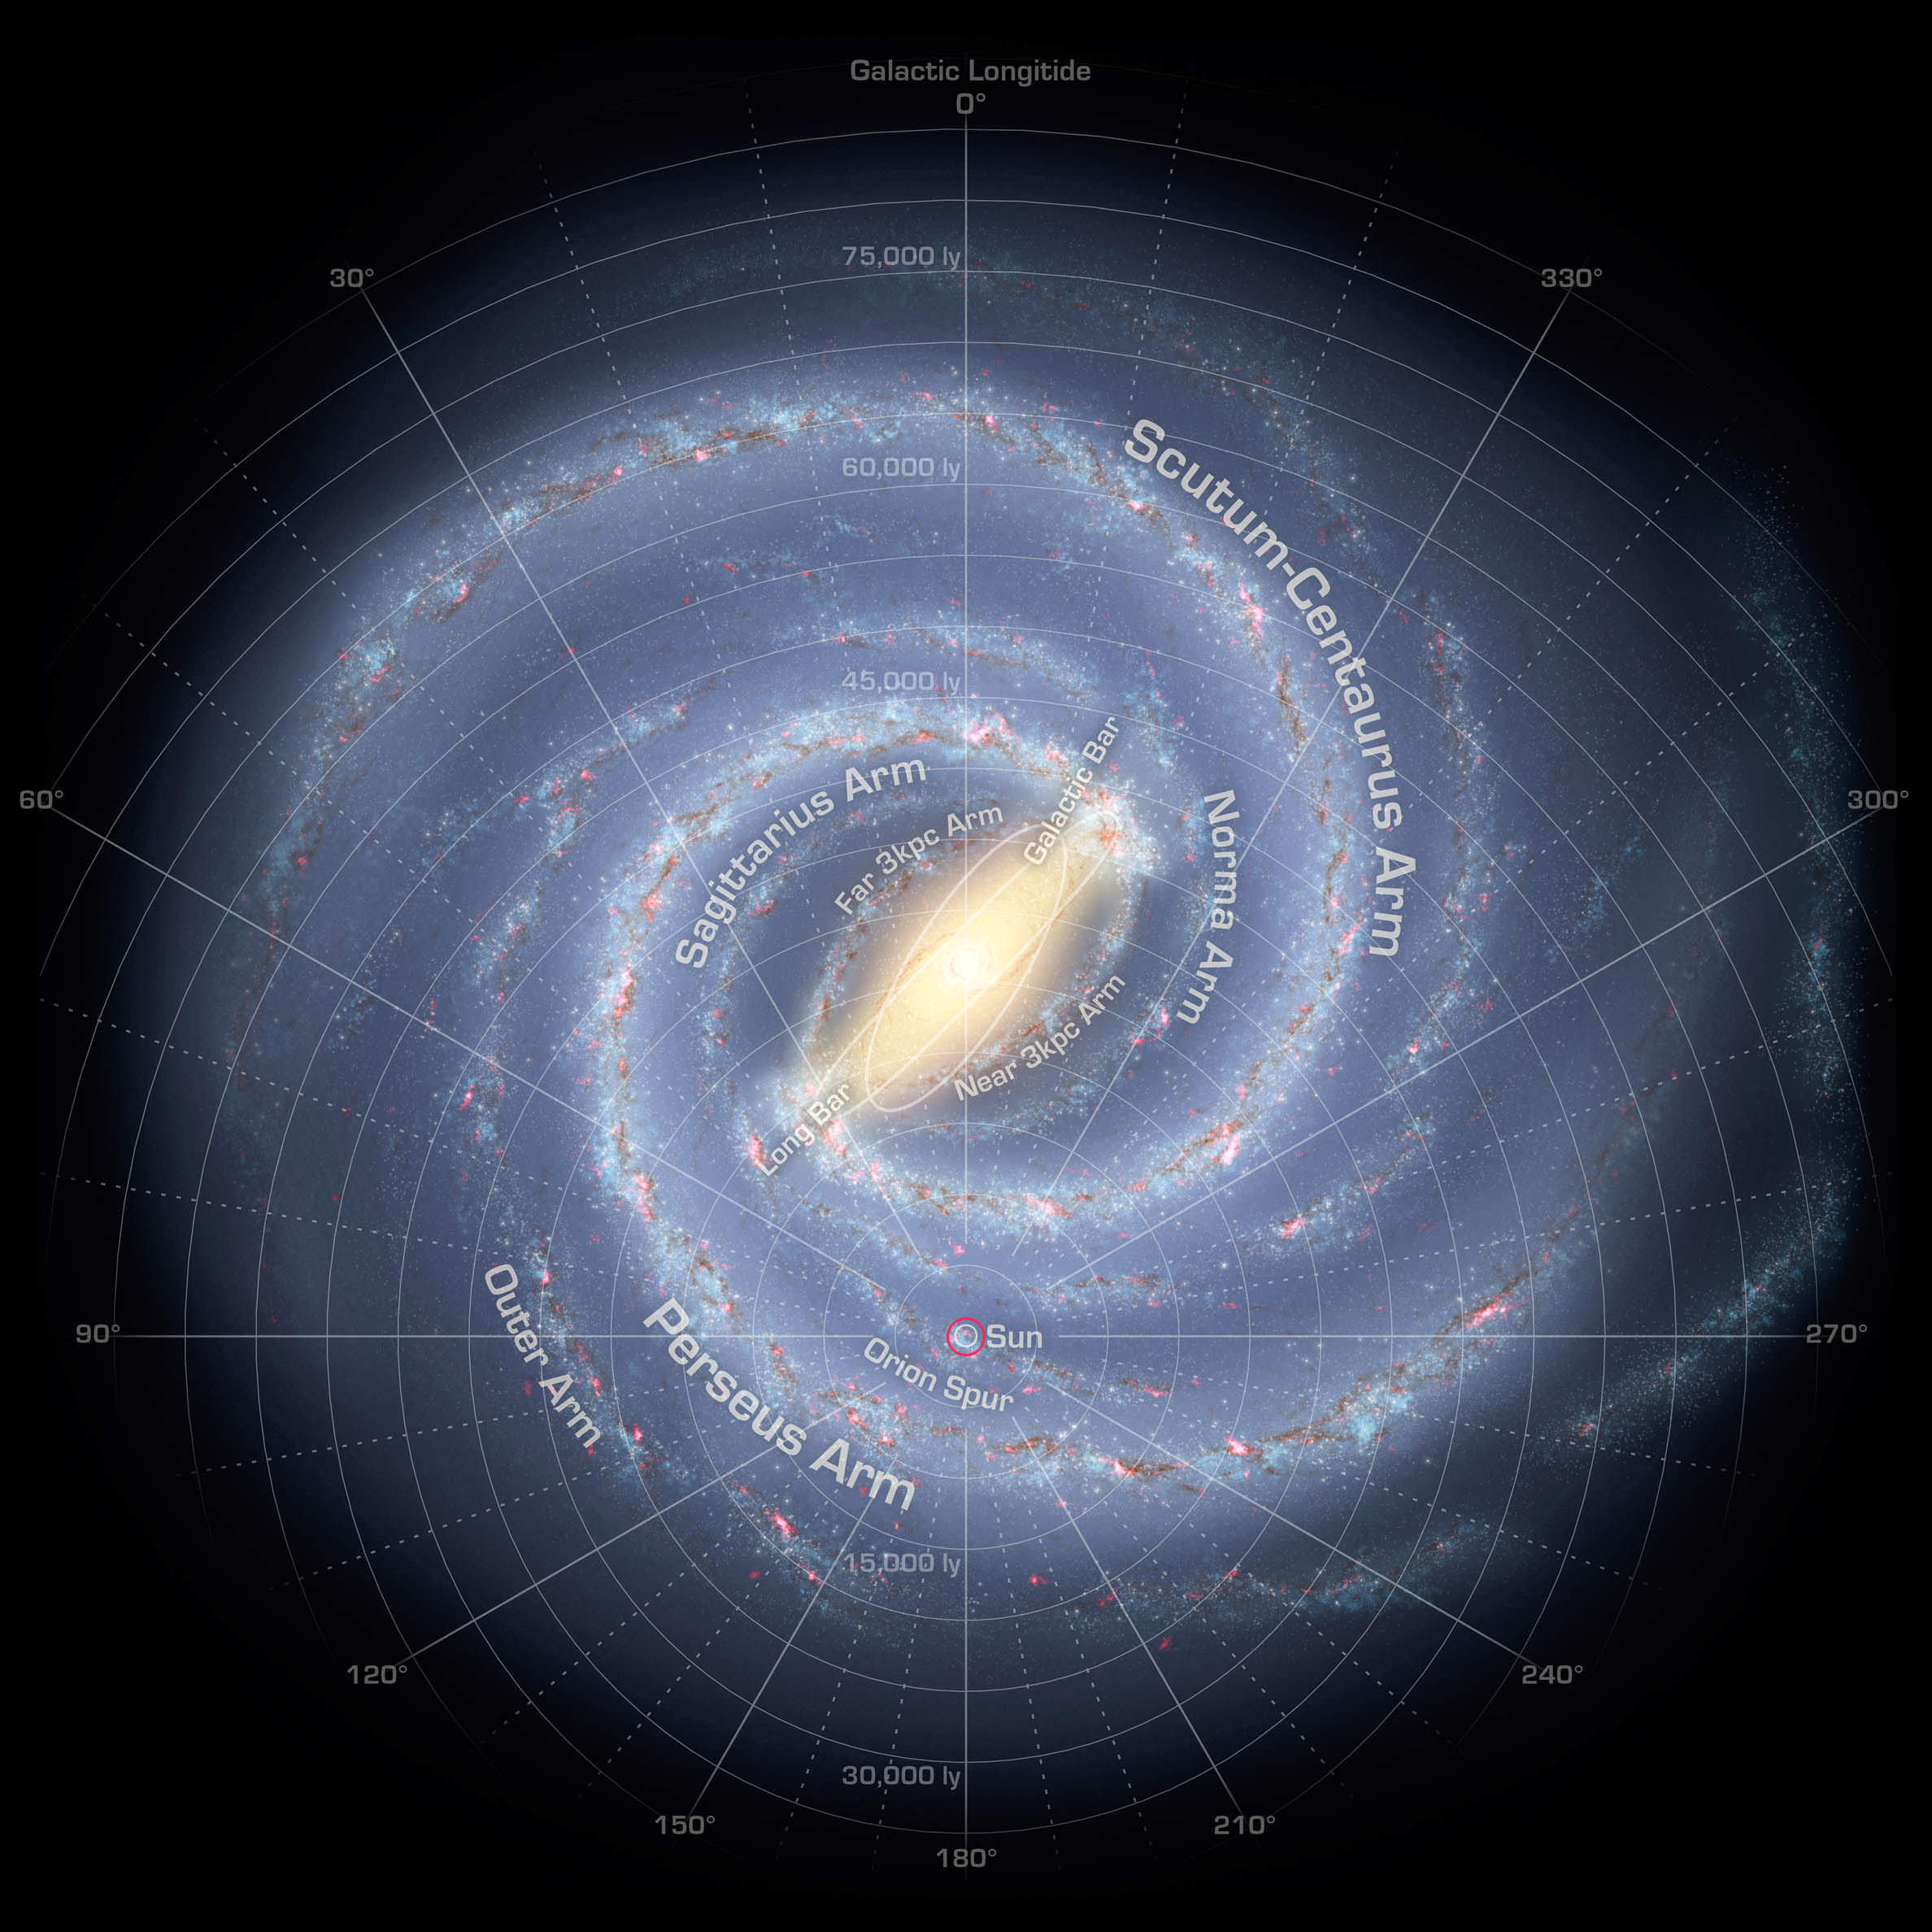
The Milky Way is a spiral galaxy with several prominent arms containing stellar nurseries swathed in pink clouds of hydrogen gas. The sun is shown near the bottom in the Orion Spur. Credit: NASA
We live in a galaxy that is called the Milky Way. It’s called a barred spiral galaxy, which means that it has a spiral shape with a bar of stars across its middle. The galaxy is rather huge — at least 100,000 light-years in diameter, making it the second-biggest in our Local Group of galaxies.
More mind-blowing is that this mass of stars, gas, planets and other objects are all spinning. Just like a pinwheel. It’s spinning at 270 kilometers per second (168 miles per second) and takes about 200 million years to complete one rotation, according to the National Radio Astronomy Observatory. But why? More details below.
It’s worth taking a quick detour to talk about how long it takes the Solar System to move around the center of the galaxy. According to National Geographic, that’s about 225 million years. Dinosaurs were starting to arise the last time we were in the position we are today.
The rising Milky Way at Sentosa Island in Singapore. Credit and copyright: Justin Ng.
Scientists have mapped the spin using the Very Large Baseline Array, a set of radio telescopes. They examined spots where stars were forming and paid particular attention to those areas where gas molecules enhance radio emission, according to the National Radio Astronomy Observatory. Dubbed “cosmic masers”, these areas shine brightly in radio waves.
As Earth moves in its orbit, the shift of these molecules can be mapped against more distant objects. Measuring this shift shows how the entire galaxy rotates — and can even provide information about the mass of the Milky Way. So that’s all very neat, but why is it rotating in the first place?
If we think back to the early Universe, there are two big assumptions astronomers make, according to How Stuff Works: there was a lot of hydrogen and helium, with some parts denser than other areas. In the denser areas, gas clumped together in protogalactic clouds; the thickest areas collapsed into stars.
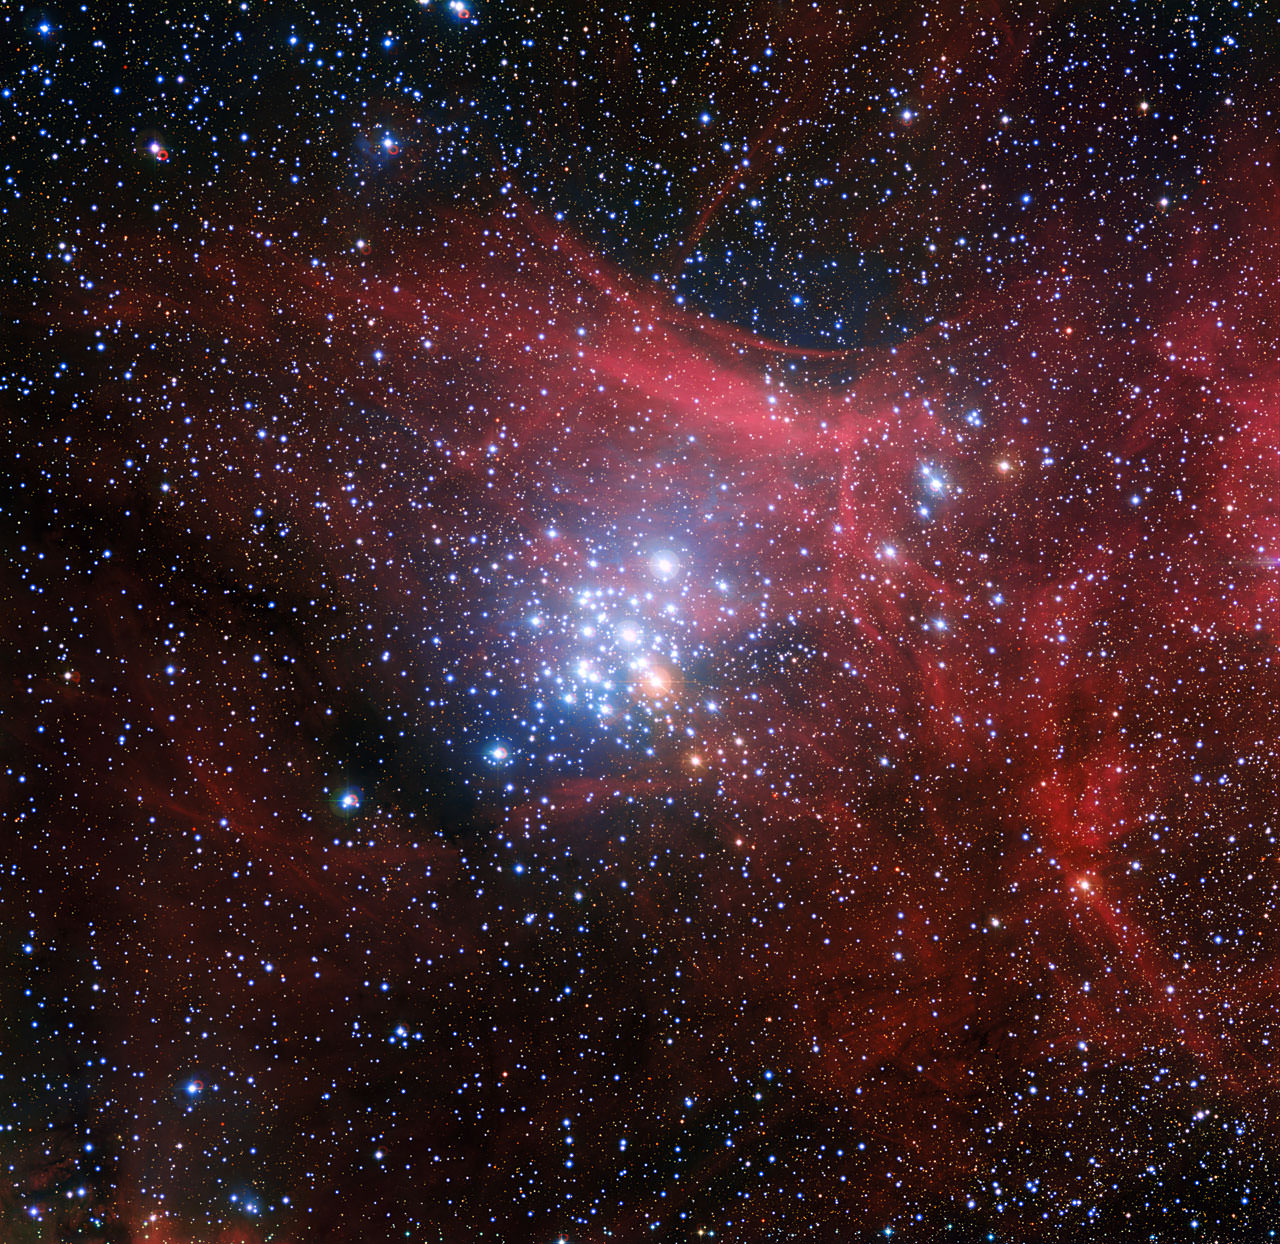
In this image from the Wide Field Imager on the MPG/ESO 2.2-metre telescope at ESO’s La Silla Observatory in Chile young stars huddle together against a backdrop of clouds of glowing gas and lanes of dust. The star cluster, known as NGC 3293, would have been just a cloud of gas and dust itself about ten million years ago, but as stars began to form it became the bright group we see here. Clusters like this are celestial laboratories that allow astronomers to learn more about how stars evolve. Image Credit: ESO/G. Beccari
“These stars burned out quickly and became globular clusters, but gravity continued to collapse the clouds,” How Stuff Works wrote. “As the clouds collapsed, they formed rotating disks. The rotating disks attracted more gas and dust with gravity and formed galactic disks. Inside the galactic disk, new stars formed. What remained on the outskirts of the original cloud were globular clusters and the halo composed of gas, dust and dark matter.”
A simpler way to think about this is if you’re creating a pizza by tossing a ball of dough into the air. The spin of the dough creates a flat disc — just like what you observe in more complicated form in the Milky Way, not to mention other galaxies.
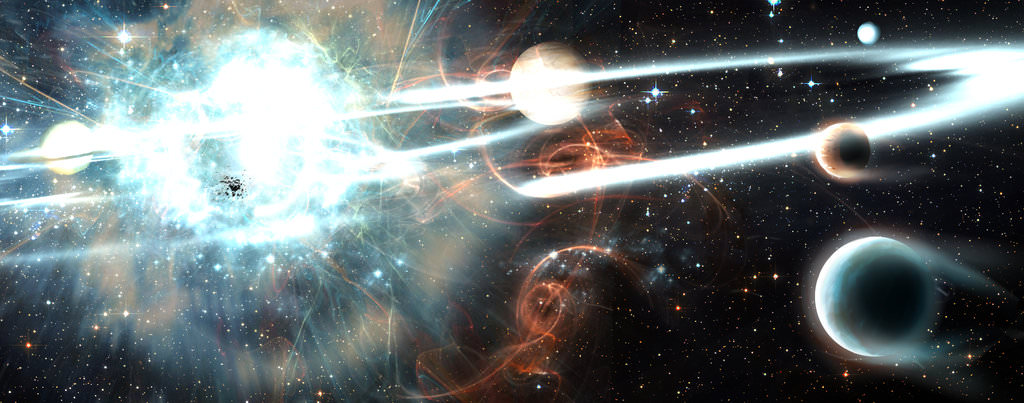
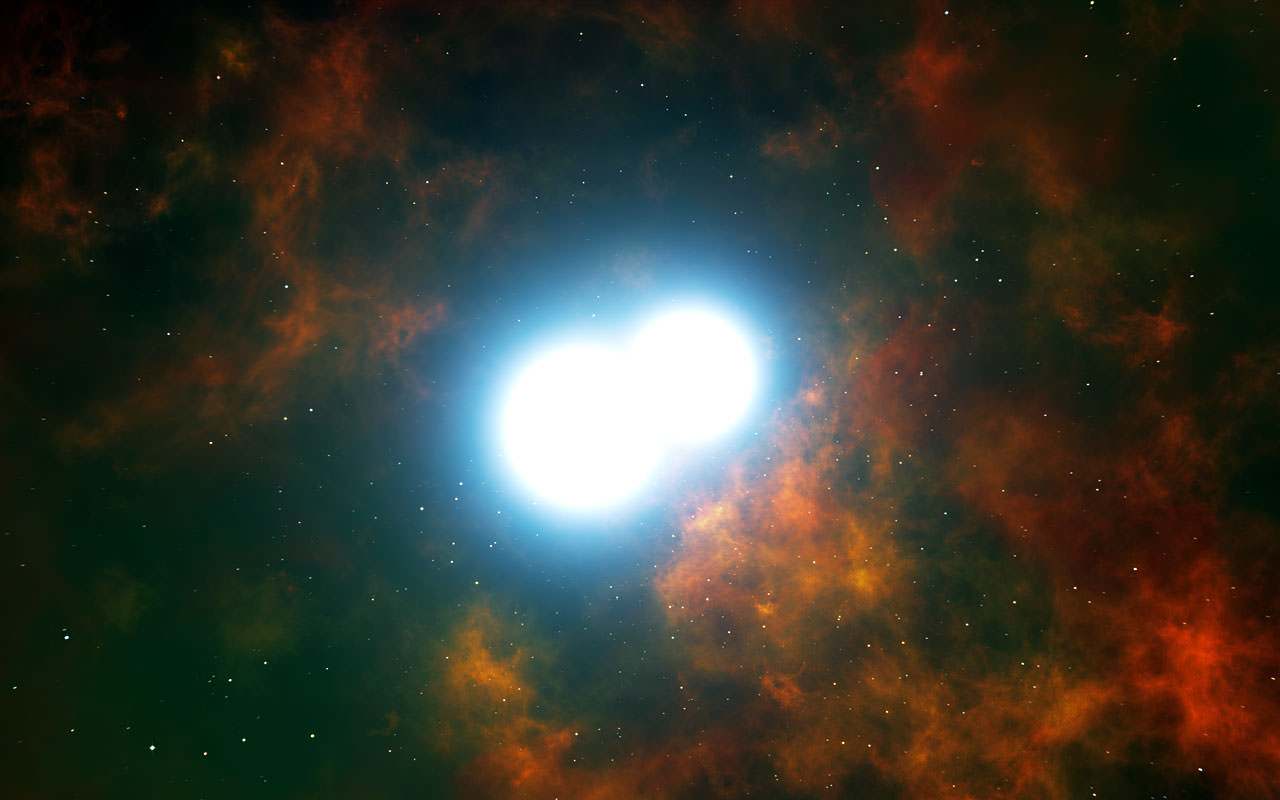
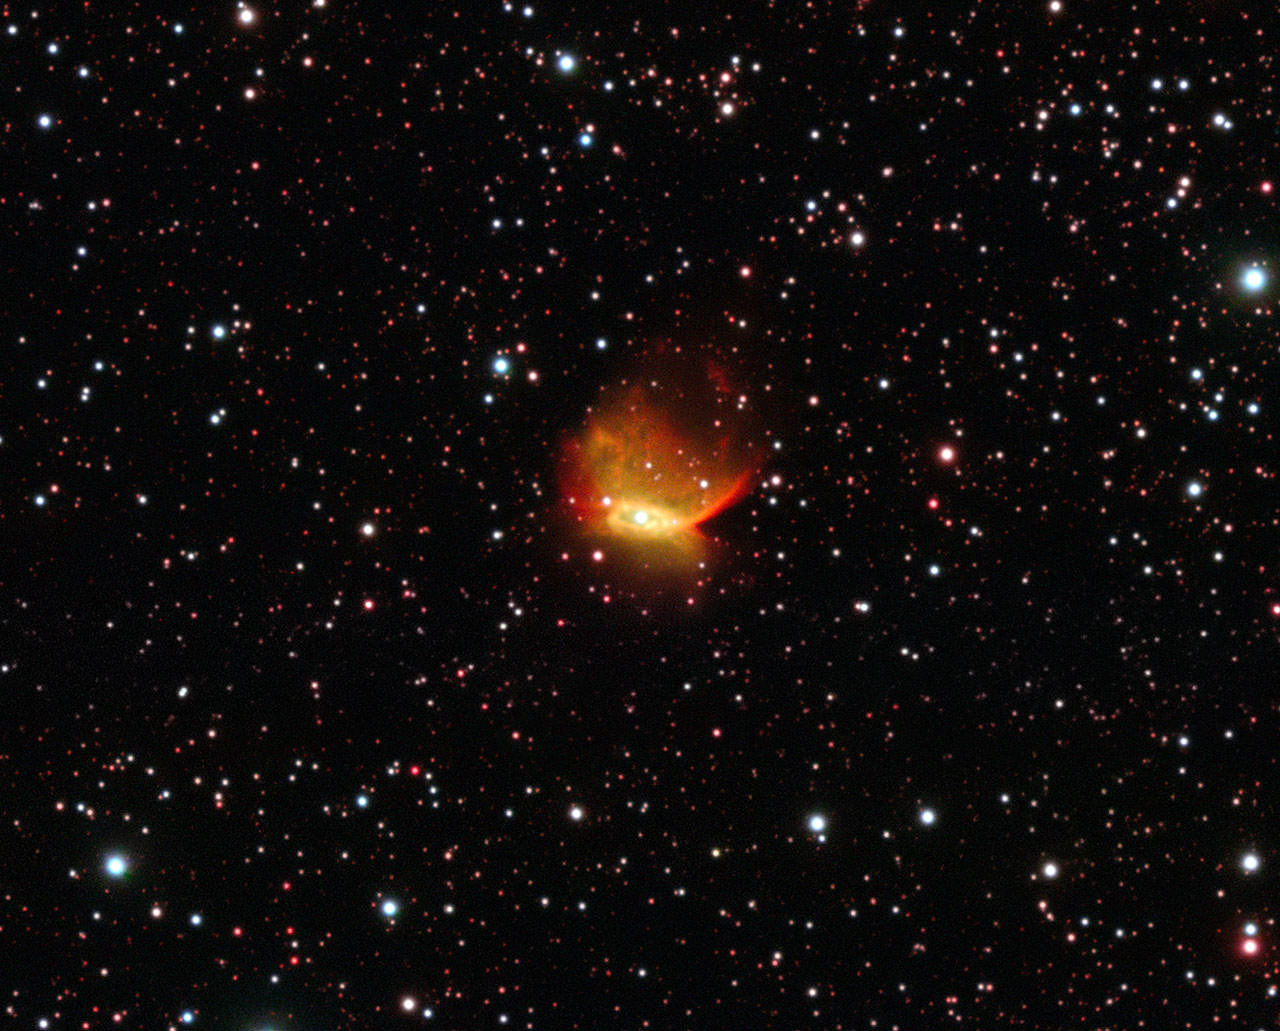
This artist’s impression shows the central part of the planetary nebula Henize 2-428. The core of this unique object consists of two white dwarf stars, each with a mass a little less than that of the Sun. They are expected to slowly draw closer to each other and merge in around 700 million years. This event will create a dazzling supernova of Type Ia and destroy both stars. Credit: ESO/L. Calçada
Two white dwarfs circle around one other, locked in a fatal tango. With an intimate orbit and a hefty combined mass, the pair is ultimately destined to collide, merge, and erupt in a titanic explosion: a Type Ia supernova.
Or so goes the theory behind the infamous “standard candles” of cosmology.
Now, in a paper published in today’s issue of Nature, a team of astronomers have announced observational support for such an arrangement – two massive white dwarf stars that appear to be on track for a very explosive demise.
The astronomers were originally studying variations in planetary nebulae, the glowing clouds of gas that red giant stars throw off as they fizzle into white dwarfs. One of their targets was the planetary nebula Henize 2-428, an oddly lopsided specimen that, the team believed, owed its shape to the existence of two central stars, rather than one. After observing the nebula with the ESO’s Very Large Telescope, the astronomers concluded that they were correct – Henize 2-428 did, in fact, have a binary star system at its heart.
This image of the unusual planetary nebula was obtained using ESO’s Very Large Telescope at the Paranal Observatory in Chile. In the heart of this colourful nebula lies a unique object consisting of two white dwarf stars, each with a mass a little less than that of the Sun. These stars are expected to slowly draw closer to each other and merge in around 700 million years. This event will create a dazzling supernova of Type Ia and destroy both stars. Credit: ESO
“Further observations made with telescopes in the Canary Islands allowed us to determine the orbit of the two stars and deduce both the masses of the two stars and their separation,” said Romano Corradi, a member of the team.
And that is where things get juicy.
In fact, the two stars are whipping around each other once every 4.2 hours, implying a narrow separation that is shrinking with each orbit. Moreover, the system has a combined heft of 1.76 solar masses – larger, by any count, than the restrictive Chandrasekhar limit, the maximum ~1.4 solar masses that a white dwarf can withstand before it detonates. Based on the team’s calculations, Henize 2-428 is likely to be the site of a type Ia supernova within the next 700 million years.
“Until now, the formation of supernovae Type Ia by the merging of two white dwarfs was purely theoretical,” explained David Jones, another of the paper’s coauthors. “The pair of stars in Henize 2-428 is the real thing!”
Check out this simulation, courtesy of the ESO, for a closer look at the fate of the dynamic duo:
Astronomers should be able to use the stars of Henize 2-428 to test and refine their models of type Ia supernovae – essential tools that, as lead author Miguel Santander-García emphasized, “are widely used to measure astronomical distances and were key to the discovery that the expansion of the Universe is accelerating due to dark energy.” This system may also enhance scientists’ understanding of the precursors of other irregular planetary nebulae and supernova remnants.
The team’s work was published in the February 9 issue of Nature. A copy of the paper is available here.
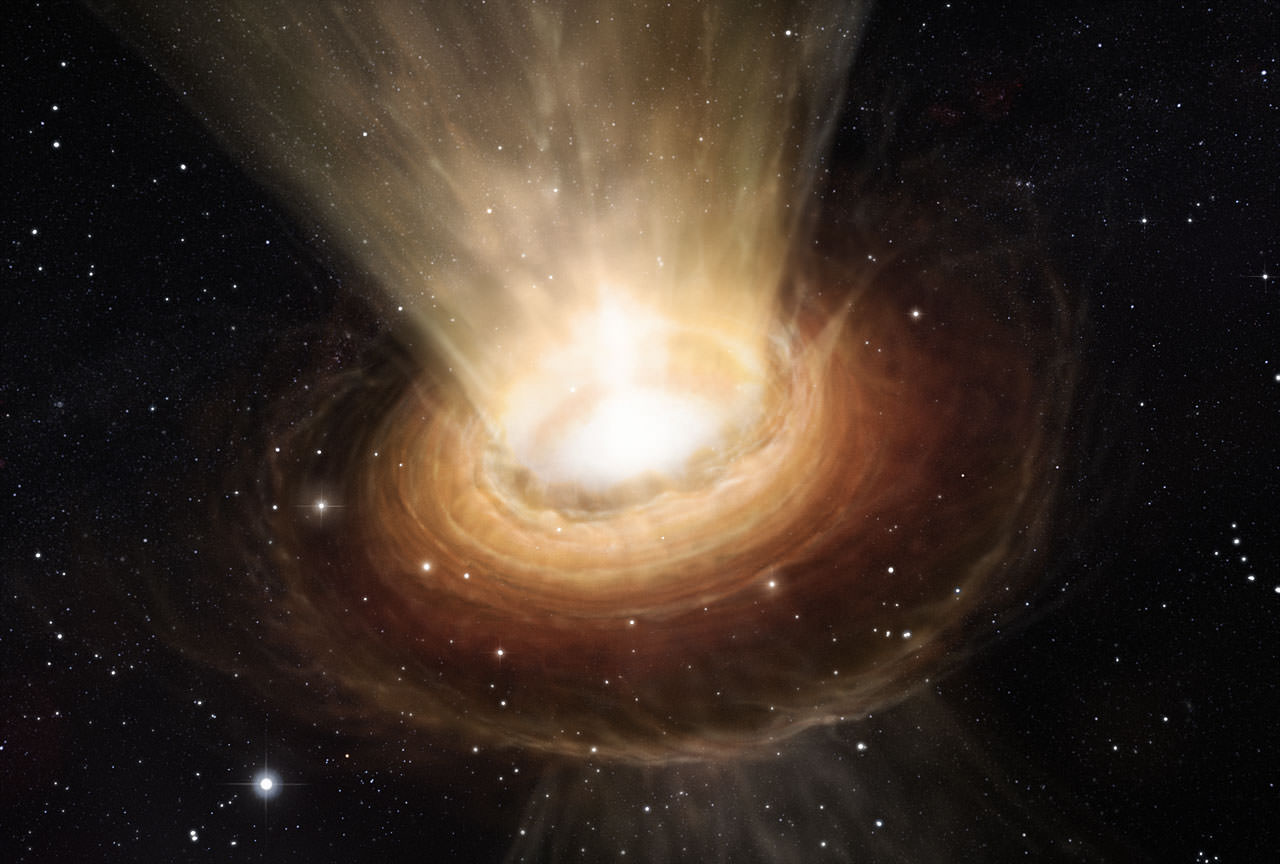
This artist’s impression shows the surroundings of the supermassive black hole at the heart of the active galaxy NGC 3783 in the southern constellation of Centaurus (The Centaur). Credit: ESO/M. Kornmesser
We’ve come a long way in 13.8 billion years; but despite our impressively extensive understanding of the Universe, there are still a few strings left untied. For one, there is the oft-cited disconnect between general relativity, the physics of the very large, and quantum mechanics, the physics of the very small. Then there is problematic fate of a particle’s intrinsic information after it falls into a black hole. Now, a new interpretation of fundamental physics attempts to solve both of these conundrums by making a daring claim: at certain scales, space and time simply do not exist.
Let’s start with something that is not in question. Thanks to Einstein’s theory of special relativity, we can all agree that the speed of light is constant for all observers. We can also agree that, if you’re not a photon, approaching light speed comes with some pretty funky rules – namely, anyone watching you will see your length compress and your watch slow down.
But the slowing of time also occurs near gravitationally potent objects, which are described by general relativity. So if you happen to be sight-seeing in the center of the Milky Way and you make the regrettable decision to get too close to our supermassive black hole’s event horizon (more sinisterly known as its point-of-no-return), anyone observing you will also see your watch slow down. In fact, he or she will witness your motion toward the event horizon slow dramatically over an infinite amount of time; that is, from your now-traumatized friend’s perspective, you never actually cross the event horizon. You, however, will feel no difference in the progression of time as you fall past this invisible barrier, soon to be spaghettified by the black hole’s immense gravity.
So, who is “correct”? Relativity dictates that each observer’s point of view is equally valid; but in this situation, you can’t both be right. Do you face your demise in the heart of a black hole, or don’t you? (Note: This isn’t strictly a paradox, but intuitively, it feels a little sticky.)
And there is an additional, bigger problem. A black hole’s event horizon is thought to give rise to Hawking radiation, a kind of escaping energy that will eventually lead to both the evaporation of the black hole and the destruction of all of the matter and energy that was once held inside of it. This concept has black hole physicists scratching their heads. Because according to the laws of physics, all of the intrinsic information about a particle or system (namely, the quantum wavefunction) must be conserved. It cannot just disappear.
Dr. Stephen Hawking of Cambridge University alongside illustrations of a black hole and an event horizon with Hawking Radiation. He continues to engage his grey matter to uncover the secrets of the Universe while others attempt to confirm his existing theories. (Photo: BBC, Illus.: T.Reyes)
Why all of these bizarre paradoxes? Because black holes exist in the nebulous space where a singularity meets general relativity – fertile, yet untapped ground for the elusive theory of everything.
Enter two interesting, yet controversial concepts: doubly special relativity and gravity’s rainbow.
Just as the speed of light is a universally agreed-upon constant in special relativity, so is the Planck energy in doubly special relativity (DSR). In DSR, this value (1.22 x 10¹⁹ GeV) is the maximum energy (and thus, the maximum mass) that a particle can have in our Universe.
Two important consequences of DSR’s maximum energy value are minimum units of time and space. That is, regardless of whether you are moving or stationary, in empty space or near a black hole, you will agree that classical space breaks down at distances shorter than the Planck length (1.6 x 10⁻³⁵ m) and classical time breaks down at moments briefer than the Planck time (5.4 x 10-44 sec).
In other words, spacetime is discrete. It exists in indivisible (albeit vanishingly small) units. Quantum below, classical above. Add general relativity into the picture, and you get the theory of gravity’s rainbow.
Physicists Ahmed Farag Ali, Mir Faizal, and Barun Majumder believe that these theories can be used to explain away the aforementioned black hole conundrums – both your controversial spaghettification and the information paradox. How? According to DSR and gravity’s rainbow, in regions smaller than 1.6 x 10⁻³⁵ m and at times shorter than 5.4 x 10-44 sec… the Universe as we know it simply does not exist.
“Say what??” -Albert Einstein
“In gravity’s rainbow, space does not exist below a certain minimum length, and time does not exist below a certain minimum time interval,” explained Ali, who, along with Faizal and Majumder, authored a paper on this topic that was published last month. “So, all objects existing in space and occurring at a time do not exist below that length and time interval [which are associated with the Planck scale].”
Luckily for us, every particle we know of, and thus every particle we are made of, is much larger than the Planck length and endures for much longer than the Planck time. So – phew! – you and I and everything we see and know can go on existing. (Just don’t probe too deeply.)
The event horizon of a black hole, however, is a different story. After all, the event horizon isn’t made of particles. It is pure spacetime. And according to Ali and his colleagues, if you could observe it on extremely short time or distance scales, it would cease to have meaning. It wouldn’t be a point-of-no-return at all. In their view, the paradox only arises when you treat spacetime as continuous – without minimum units of length and time.
“As the information paradox depends on the existence of the event horizon, and an event horizon like all objects does not exist below a certain length and time interval, then there is no absolute information paradox in gravity’s rainbow. The absence of an effective horizon means that there is nothing absolutely stopping information from going out of the black hole,” concluded Ali.
No absolute event horizon, no information paradox.
And what of your spaghettification within the black hole? Again, it depends on the scale at which you choose to analyze your situation. In gravity’s rainbow, spacetime is discrete; therefore, the mathematics reveal that both you (the doomed in-faller) and your observer will witness your demise within a finite length of time. But in the current formulation of general relativity, where spacetime is described as continuous, the paradox arises. The in-faller, well, falls in; meanwhile, the observer never sees the in-faller pass the event horizon.
“The most important lesson from this paper is that space and time exist only beyond a certain scale,” said Ali. “There is no space and time below that scale. Hence, it is meaningless to define particles, matter, or any object, including black holes, that exist in space and time below that scale. Thus, as long as we keep ourselves confined to the scales at which both space and time exist, we get sensible physical answers. However, when we try to ask questions at length and time intervals that are below the scales at which space and time exist, we end up getting paradoxes and problems.”
To recap: if spacetime continues on arbitrarily small scales, the paradoxes remain. If, however, gravity’s rainbow is correct and the Planck length and the Planck time are the smallest unit of space and time that fundamentally exist, we’re in the clear… at least, mathematically speaking. Unfortunately, the Planck scales are far too tiny for our measly modern particle colliders to probe. So, at least for now, this work provides yet another purely theoretical result.
The paper was published in the January 23 issue of Europhysics Letters. A pre-print of the paper is available here.