Rare Triple Transit! There’ll be 3 Moon Shadows on Jupiter on January 24th, 2015

Credit:

Play the skywatching game long enough, and anything can happen.

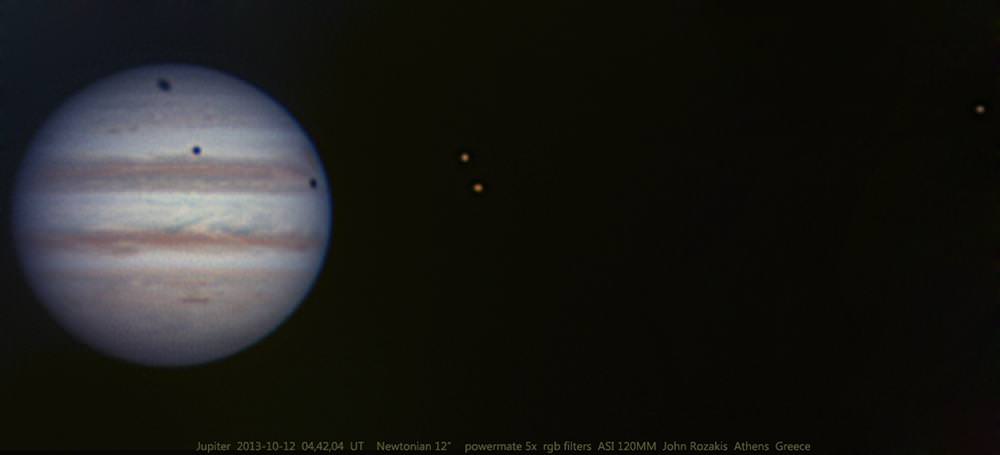
Well, nearly anything. One of the more unique clockwork events in our solar system occurs this weekend, when shadows cast by three of Jupiter’s moons can be seen transiting its lofty cloud tops… simultaneously.

How rare is such an event? Well, Jean Meeus calculates 31 triple events involving moons or their shadows occurring over the 60 year span from 1981 to 2040.

But not all are as favorably placed as this weekend’s event. First, Jupiter heads towards opposition just next month. And of the aforementioned 31 events, only 9 are triple shadow transits. Miss this weekend’s event, and you’ll have to wait until March 20th, 2032 for the next triple shadow transit to occur.
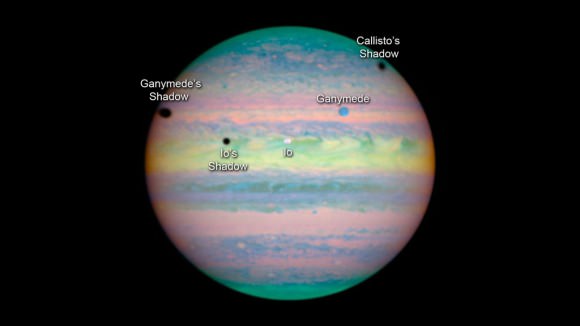
Hubble spies a triple shadow transit  on March 28th, 2004 . Credit: NASA/JPL/Arizona.
Hubble spies a triple shadow transit on March 28th, 2004 . Credit: NASA/JPL/Arizona.

Of course, double shadow transits are much more common throughout the year, and we included some of the best for North America and Europe in 2015 in our 2015 roundup.

The key times when all three shadows can be seen crossing Jupiter’s 45” wide disk are on the morning of Saturday, January 24th starting at 6:26 Universal Time (UT) as Europa’s shadow ingresses into view, until 6:54 UT when Io’s shadow egresses out of sight. This converts to 1:26 AM EST to 1:54 AM EST. The span of ‘triplicate shadows’ only covers a period of slightly less than 30 minutes, but the action always unfolds fast in the Jovian system with the planet’s 10 hour rotation period.
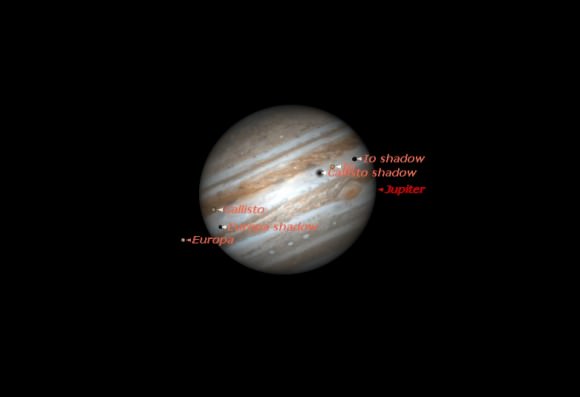
The view at 6:41 UT/1:41 AM EST. Credit: Created using Starry Night Education software.
The view on January 24th at 6:41 UT/1:41 AM EST. Credit: Created using Starry Night Education software.

Unfortunately, the Great Red Spot is predicted to be just out of view when the triple transit occurs, as it crosses Jupiter’s central meridian over three hours later at 10:28 UT.

The moons involved in this weekend’s event are Io, Callisto and Europa. Now, I know what you’re thinking. Seeing three shadows at once is pretty neat, but can you ever see four?

The short answer is no, and the reason has to do with orbital resonance.

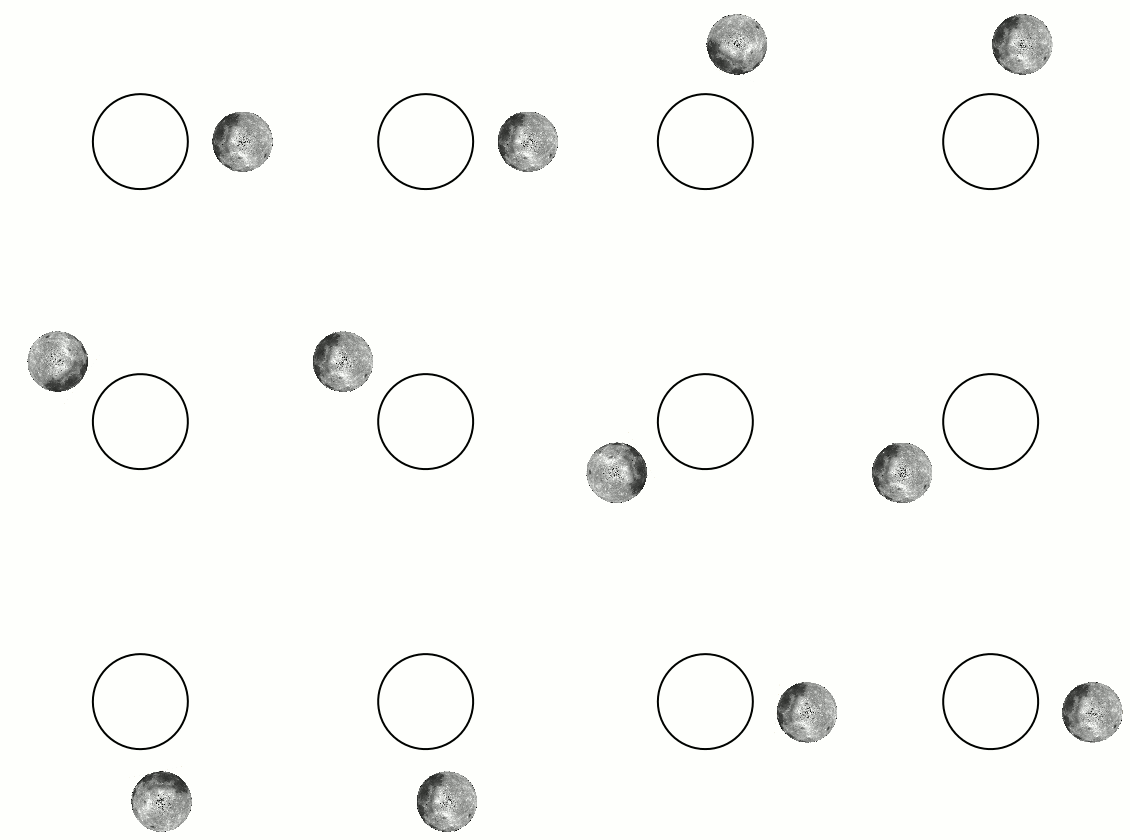
The orbital resonance of the three innermost Galilean moons. (Credit: Wikimedia Commons).

The three innermost Galilean moons of Jupiter (Io, Europa and Ganymede) are locked in a 4:2:1 resonance. Unfortunately, this resonance assures that you’ll always see two of the innermost three crossing the disk of Jupiter, but never all three at once. Either Europa or Ganymede is nearly always the “odd moon out.”

To complete a ‘triple play,’ outermost Callisto must enter the picture. Trouble is, Callisto is the only Galilean moon that can ‘miss’ Jupiter’s disk from our line of sight. We’re lucky to be in an ongoing season of Callisto transits in 2015, a period that ends in July 2016.

Perhaps, on some far off day, a space tourism agency will offer tours to that imaginary vantage point on the surface of one of Jupiter’s moons such as Callisto to watch a triple transit occur from close up. Sign me up!

Jupiter currently rises in late January around 5:30 PM local, and sets after sunrise. It is also well placed for northern hemisphere observers in Leo at a declination 16 degrees north . This weekend’s event favors Europe towards local sunrise and ‘Jupiter-set,’ and finds the gas giant world well-placed high in the sky for all of North America in the early morning hours of the 24th.
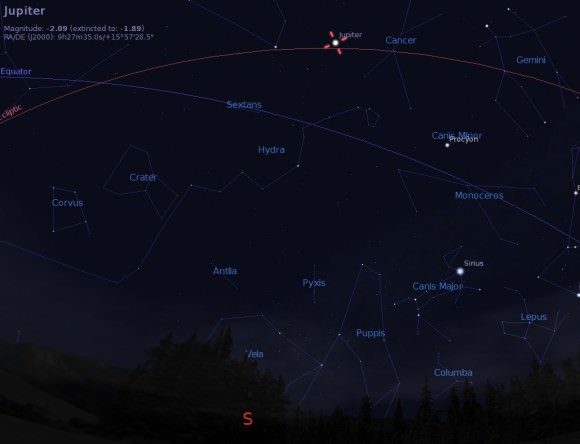
2AM local Credit: Stellarium.
Jupiter rides high to the south at 1:45 AM EST for the US East Coast. Credit: Stellarium.

Look closely. Do the shadows of the individual moons appear different to you at the eyepiece? It’s interesting to note during a multiple transit that not all Jovian moon shadows are ‘created equal’. Distant Callisto casts a shadow that’s broad, with a ragged gray and diffuse rim, while the shadow of innermost Io appears as an inky black punch-hole dot. If you didn’t know better, you’d think those alien monoliths were busy consuming Jupiter in a scene straight out of the movie 2010.  Try sketching multiple shadow transits and you’ll soon find that you can actually identify which moon is casting a shadow just from its appearance alone.
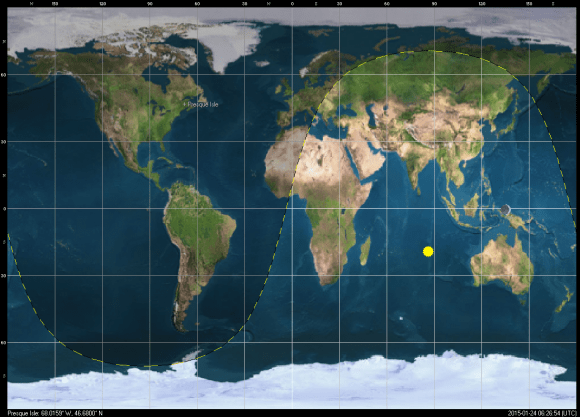
The orientation of Earth's nighttime shadow at mid-triple transit. Credit: Created using Orbitron.
The orientation of Earth’s nighttime shadow at mid-triple transit. Credit: Created using Orbitron.

Other mysteries of the Galilean moons persist as well. Why did late 19th century observers describe them as egg-shaped? Can visual observers tease out such elusive phenomena as eruptions on Io by measuring its anomalous brightening? I still think it’s amazing that webcam imagers can now actually pry out surface detail from the Galilean moons!
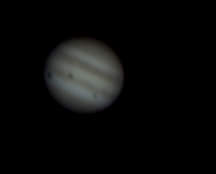
Photo by author.
The 2004 triple shadow transit. Photo by author.

Observing and imaging a shadow transit is easy using a homemade planetary webcam. We’d love to see someone produce a high quality animation of the upcoming triple shadow transit. I know that such high tech processing abilities — to include field de-rotation and convolution mapping of the Jovian sphere — are indeed out there… its breathtaking to imagine just how quickly the fledgling field of ad hoc planetary webcam imaging has changed in just 10 years.

The moons and Jupiter itself also cast shadows off to one side of the planet or the other depending on our current vantage point. We call the point when Jupiter sits 90 degrees east or west of the Sun quadrature, and the point when it rises and sets opposite to the Sun is known as opposition.  Opposition for Jupiter is coming right up for 2015 on February 6th. During opposition, Jupiter and its moons cast their respective shadows nearly straight back.

Did you know: the speed of light was first deduced by Danish astronomer Ole Rømer in 1671 using the discrepancy he noted while predicting phenomena of the Galilean moons at quadrature versus opposition. There were also early ideas to use the positions of the Galilean moons to tell time at sea, but it turned out to be hard enough to see the moons and their shadows with a small telescope based on land, let alone from the pitching deck of a ship in the middle of the ocean.

And speaking of mutual events, we’re still in the midst of a season where it’s possible to see the moons of Jupiter eclipse and occult one another. Check out the USNO’s table for a complete list of events, coming to a sky near you.

And let’s not forget that NASA’s Juno spacecraft is headed towards Jupiter as well., Juno is set to enter a wide swooping orbit around the largest planet in the solar system in July 2016.

Now is a great time to get out and explore Jove… don’t miss this weekend’s triple shadow transit!

Read Dave Dickinson’s sci-fi tale of astronomical eclipse tourism through time and space titled Exeligmos.

Where to Look for Comet Lovejoy Until it Fades from Sight

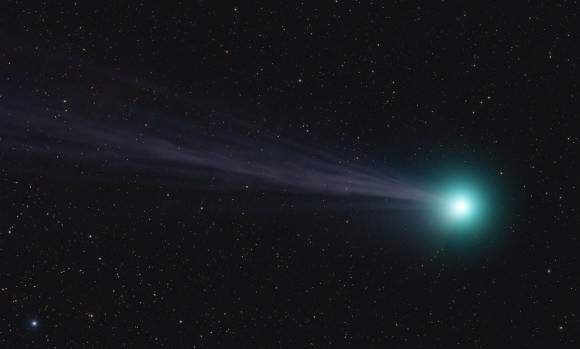
Viewing Comet Lovejoy from dark skies in Portugal. Credit: Miguel Claro

I hate to admit it, but our dear comet is fading. Only a little though. As Comet Q2 Lovejoy wends its way from Earth toward perihelion and beyond, it will slowly dim and diminish. With an orbital period of approximately 8,000 years it has a long journey ahead. Down here on Earth, we continue to look up every clear night hoping for yet another look at what’s been a wonderful comet. 

Comet Lovejoy and the Pleiades on January 19, 2015. Credit: Joseph Brimacombe

Despite its inevitable departure I encourage you to continue following Comet Lovejoy. It’s not often a comet vaults to naked eye brightness, and this one should remain visible without optical aid through mid-February.

Like a human celebrity, Lovejoy’s been the focus of attention from beginners and professionals alike using everything from cheap cellphone cameras to high-end telescopes to capture its magic. Who can get enough of that wildly fluctuating ion tail and greeny-blue coma?

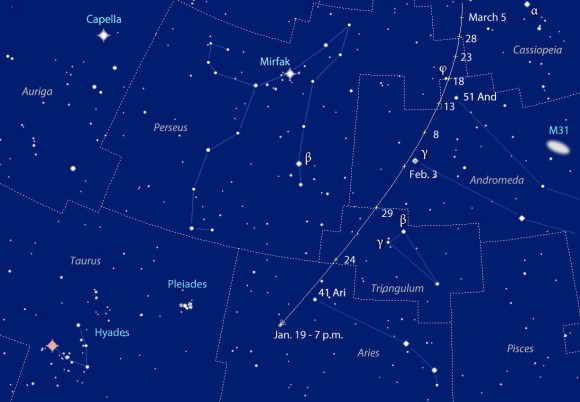
Comet Q2 Lovejoy continues tracking north-northwest now through March. This chart shows the comet's position at 7 p.m. (CST) every 5 nights through March 5. Stars shown to magnitude +6. Created with Chris Marriott's SkyMap software
Comet Q2 Lovejoy continues tracking north-northwest now through March. This chart shows the comet’s position at 7 p.m. (CST) every 5 nights through March 5. Stars shown to magnitude +6. Click to enlarge. Created with Chris Marriott’s SkyMap software

The comet continues moving northward all winter long, sliding through  the diminutive constellations Aries and Triangulum, across Andromeda and into Cassiopeia, fading as she goes. You can use the map above and binoculars to help you follow it. I like to create lines and triangles using bright stars and deep sky objects to direct me to the comet.

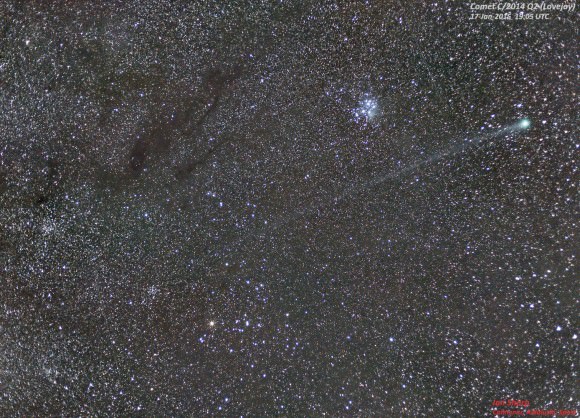
Deep image of Comet Lovejoy taken with a Canon 6D with 50mm f/1.4 lens at f/2. 10  exposure of 30 secs at ISO3200 stacked. The tail, though faint, extends for possibly 18 degrees in this amazing image. Credit: Ian Sharp
Deep image of Comet Lovejoy taken with a Canon 6D with 50mm f/1.4 lens at f/2. Ten exposures of 30 secs at ISO3200 were stacked to create the final photo. The tail extends for possibly 18 degrees in this amazing image. The Pleiades are at top right; Hyades at bottom center. Credit: Ian Sharp

Tonight for instance, Lovejoy one fist held at arm’s length due west of the Pleiades. On the 29th, it’s on a line from Beta Persei (Algol) to Beta Trianguli. On February 3rd, it pulls right up alongside the colorful double star Gamma Andromedae, also called Almach, and on the 8th forms one of the apexes of an equilateral triangle with the two Betas. You get the idea.

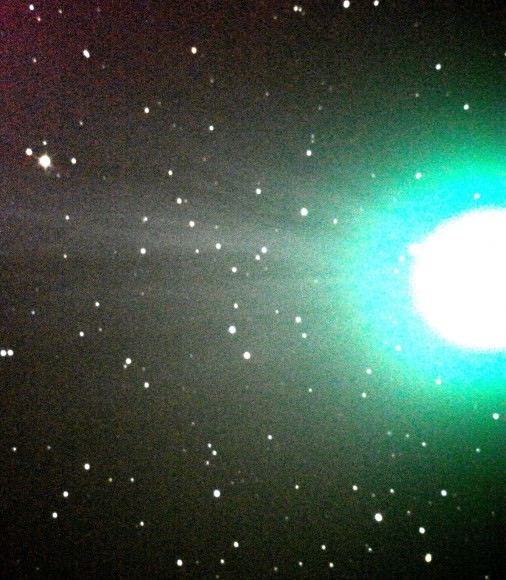
The tail rays that show so clearly in photographs as in this image made on January 16th require dark skies and 8-inch or larger telescope to see visually. They're very low contrast. Credit: Greg Redfern
The tail rays that show so clearly in photographs as in this image made on January 16th require dark skies and an 8-inch or larger telescope to see visually. They’re very low contrast. Credit: Greg Redfern

The waxing moon will interfere with viewing beginning next weekend and render the comet nil with the naked eye, you’ll still be able to track it in binoculars during that time. Dark skies return around Feb. 7.

Comet Lovejoy captured from the Dark Sky Alqueva Reserve, Portugal on Jan. 11th by Miguel Claro

Delicate streamers show in Comet Lovejoy's ion tail in this photo from January 13th. Credit: Bernhard Hubl
Delicate streamers show in Comet Lovejoy’s ion tail in this photo from January 13th. Credit: Bernhard Hubl

What is the Zodiac?

A chart of the constellations and signs that make up the zodiac. Credit: NASA

The zodiac represents the constellations that the Sun passes through in its apparent path across Earth’s sky. Because the Sun (and the planets) are all on about the same plane in the Solar System, they pass through the same constellations and at times, can even eclipse each other.

While traditionally the zodiac is considered to have 12 constellations, technically the Sun passes through 13, according to this NASA page. In order, the constellations are Sagittarius, Capricornus, Aquarius, Pisces, Aries, Taurus, Gemini, Cancer, Leo, Virgo, Libra, Scorpius and Ophiuchus.

The reason there are now 13 constellations that the Sun passes through is that the axis of the Earth has changed over the millennia. Earth’s axis precesses or moves in a cycle that takes about 26,000 years. Over time, this means the direction of north has changed with respect to the sky. Vega was the North Star several thousand years ago, and will become it again in about 13,000 years, according to NASA. Today, the North Star is Polaris.

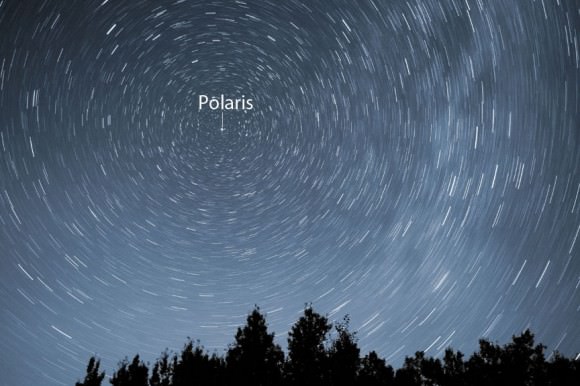
Time exposure centered on Polaris, the North Star. Notice that the closer stars are to Polaris, the smaller the circles they describe. Stars at the edge of the frame make much larger circles. Credit: Bob King

Because different cultures see different shapes in the stars of the sky, the number of constellations varied in ancient definitions of the zodiac. It has been used in cultures ranging from Greece to Babylon to China to India. It should also be noted that the constellations are of different size, so the Sun does not spend the same amount of time in each.

The number of constellations was fixed at 12 when mathematics was added to astronomy, according to Encyclopedia Britannica. While we don’t know when the symbols were first used, the first known instance is in Greek manuscripts used during the late Middle Ages, the encyclopedia added. Briefly, according to the encyclopedia, these are what each of the constellations are:

Aries (the ram), which has no bright stars and traditionally governs the period from March 21 to April 19. In Greek mythology, it represents the ran with the golden fleece. Phrixus sacrificed a ram to Zeus (the chief god) after safely fleeing Thessaly to Colchis on its back. Jason (the chief of the Argonauts) later recovered the fleece.

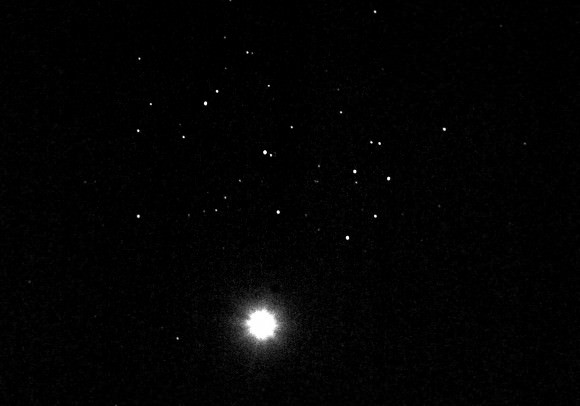
Venus within the Pleiades on April 4, 2012, as seen from New Jersey in the US. Credit and copyright John Anton.

Taurus (the bull), whose brightest star Aldebaran is the 14th-brightest in the sky. Also in Taurus are two bright star clusters (the Pleiades and the Hyades) and the Crab Nebula. It traditionally governs April 20 to May 20. In Greek mythology, Taurus represents the bull form that Zeus (the chief god) took upon to abduct Europa.

Gemini (the twins), whose brightest stars are Castor and Pollux. It’s the current location of the northern summer solstice, when the Sun reaches its highest point in the sky. It traditionally represents May 21 to June 21. In Greek mythology, the twins were gods who “succored shipwrecked sailors and received sacrifices for favorable winds,” the encyclopedia stated.

Cancer (the crab), which also has no bright stars but contains a prominent star cluster known as the Beehive (Praesepe). It traditionally governs June 22 to July 22. In Greek mythology, it refers to a crab that was crushed after pinching Heracles while he was fighting a hydra. Hera (an enemy of Heracles) rewarded the crab by immortalizing it in the sky.

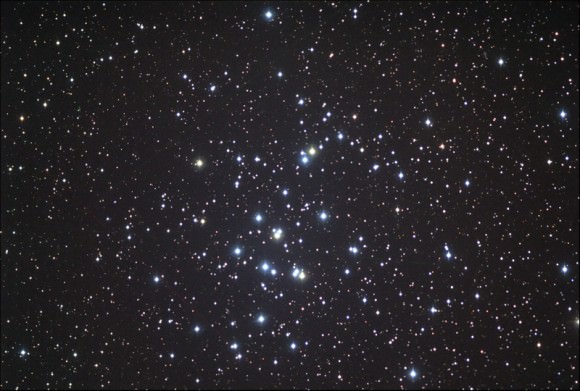
Beehive Cluster. Image credit: Tom Bash and John Fox/Adam Block/NOAO/AURA/NSF

Leo (the lion), whose brightest star is Regulus — sometimes called the “little king.” It traditionally governs July 23 to August 22 and in Greek mythology, represents a lion that Heracles killed.

Virgo (the virgin), whose brightest star is Spica — the 15th-brightest seen in Earth’s sky. It’s also known for the Virgo cluster of galaxies and the pulsar PSR 1257+12, where astronomers found the first confirmed extrasolar planets in 1992. It traditionally represents August 23 to September 22 and in Greek mythology, is associated with the harvest maiden (Persephone).

Libra, which has no bright stars. It traditionally governs Sept. 22 to Oct. 23 and is associated with balance or justice, such as with the Roman goddess Astraea.

Scorpius, whose brightest star Antares is known as the “rival of Mars” due to its red color and similar appearance to the Red Planet. It also contains Scorpius X-1, the brightest X-ray source in the sky. It traditionally governs Oct. 24 to Nov. 21 and in Greek mythology, refers to one of two legends. The first is said to be a scorpion that killed Orion, and the second refers to one that spooked horses being controlled by Phaeton as the young man was trying to drive the Sun.

Globular Cluster
A Hubble Space Telescope image of the typical globular cluster Messier 80, an object made up of hundreds of thousands of stars and located in the direction of the constellation of Scorpius. The Milky Way galaxy has an estimated 160 globular clusters of which one quarter are thought to be ‘alien’. Image: NASA / The Hubble Heritage Team / STScI / AURA. Click for hi-resolution version.

Sagittarius (the archer), which contains a prominent radio source known as Sagitarrius A. It is considered to govern Nov. 22 to Dec. 21, and is considered a mounted archer in several cultures (starting with the Babylonians in the 11th century).

Capricornus (the goat), which has no bright stars. It traditionally governs Dec. 22 to Jan. 19. In Greek mythology, it is associated with the god Pan. He leaped into the water to get away from a monster called Typhon, just as Pan was changing shape. This made him a goat with a fish tail.

Aquarius (the water bearer), which has no bright stars. It is considered to rule over Jan. 20 to Feb. 18 and is traditionally associated with a man pouring water out of a jug. The symbolism likely arises from the Middle East, whose astronomers noted that the constellation rises with the rainy season.

Pisces (the fish), which has no bright stars. It traditionally rules over Feb. 19 to March 20 and in Greek mythology, refers to Aphrodite and Eros. They went into a river to avoid a monster called Typhon. Some versions of the myth say they changed into fish, while others say they rode fish to get away.
Universe Today has articles on zodiac signs and their dates. Astronomy Cast also has an episode on constellations.
Comet Finlay Surprise Outburst, Visible in Binoculars … again!

Comet Finlay in outburst on the evening (CST) of January 16th. Credit: Michael Mattiazzo

Lost sleep at night, fingers tapping on the keyboard by day. Darn comets are keeping me busy! But of course that’s a good problem. Comet 15P/Finlay, which had been languishing in the western sky at dusk at magnitude +10, has suddenly come to life … for a second time.

Two nights ago, Australian comet observer Michael Mattiazzo took a routine picture of Finlay and discovered it at magnitude +8. Today it’s a magnitude brighter and now joins Comet Lovejoy as the second binocular comet of 2015. Comet-wise, we’ve gone from zero to 60 and the new year’s fewer than 3 weeks old!

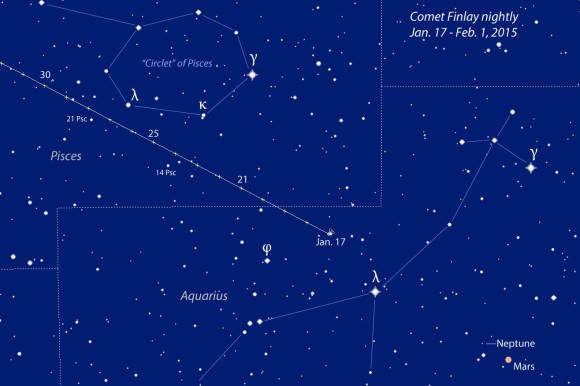
Comet 15P/Finlay tonight through Feb. 1. Positions shown for 7 p.m (CST) and stars depicted to magnitude +8. Tonight the comet will be right next to a 6th mag. star in Aquarius.
Comet 15P/Finlay tonight through Feb. 1. Positions shown for 7 p.m (CST) and stars depicted to magnitude +8. Tonight the comet will be right next to a 6th mag. star in Aquarius low in the southwestern sky at nightfall. Mars and Neptune’s position are for Jan. 17th. Click to enlarge. Source: Chris Marriott’s SkyMap software

Comet Finlay’s threw its first tantrum last December when it reached binocular visibility (faintly) shortly before Christmas.  Discovered by William Henry Finlay from South Africa on September 26, 1886, the comet circles the Sun every 6.5 years. This time around it reached perihelion on December 27th and spent many nights near the planet Mars low in the western sky. Until the new outburst, the comet had returned to its predicted brightness (~10 magnitude) and departed company with the Red Planet.

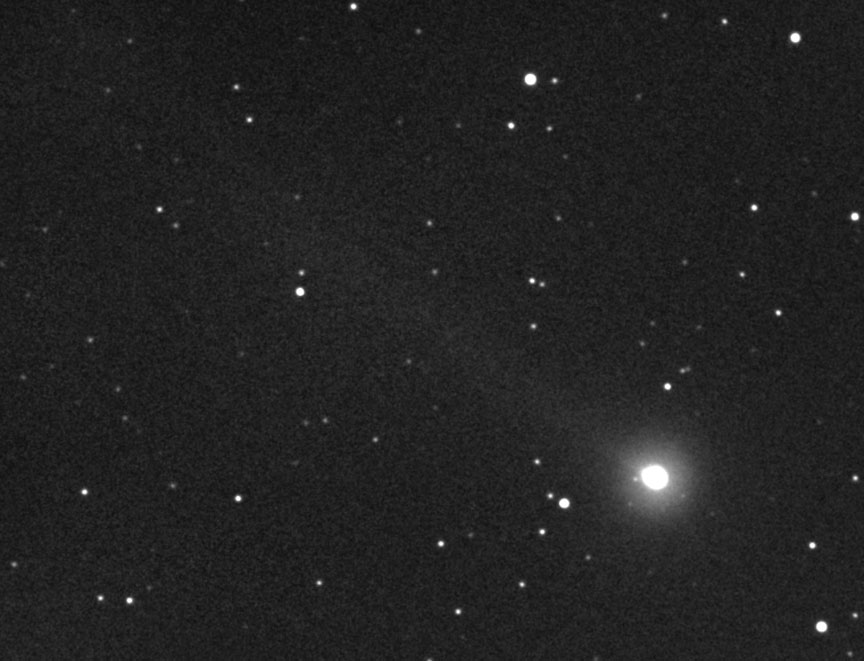
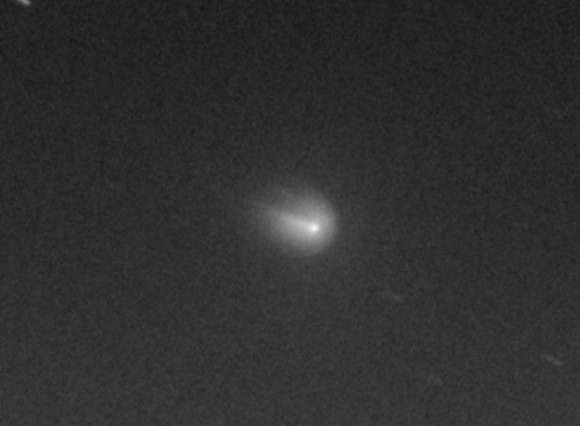
Even though photographed under poor conditions on Jan. 17th, Alfons Diepvens' image of Comet Finlay's coma and nuclear region reveals interesting details. Credit: Alfons Diepvens
Even though photographed under poor conditions on Jan. 17th, Belgian amateur astronomer Alfons Diepvens’ image of Comet Finlay’s coma and nuclear region reveals interesting details. Credit: Alfons Diepvens

It’s still low in the west, though not quite so much as in December, in the constellation Aquarius. With an orbit inclined only 6.8° to the ecliptic or plane of the Solar System, you’ll find it chugging eastward across the zodiac at the rate of 1° per night. The best time to view the comet is at the end of evening twilight at nightfall when it’s highest —  20° to 25° above the southwestern horizon.

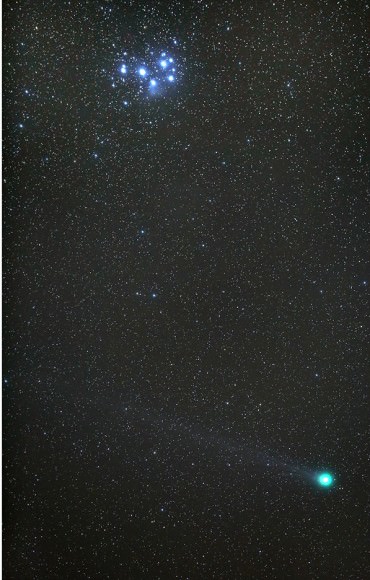
Comet Lovejoy southwest of the beautiful Pleaides star cluster on January 15th. Credit: Bob King
Comet Lovejoy seen in tandem with the beautiful Pleaides star cluster on January 15th. Click for a finder chart. Credit: Bob King

Right now it’s not far from Lambda Aquarii and will soon glide just south of the well-known asterism called the “Circlet” in Pisces. Currently between 7th and 8th magnitude and showing a bright, condensed center, Comet Finlay is easily visible in 10×50 binoculars. Catch it while you can. These outbursts often fade fairly quickly. While we don’t know its exact cause, what likely happened is that a new fissure opened up on the comet’s surface, exposing fresh ice to sunlight. Rapid vaporization of the new material may be behind the eruption.

While Comet Q2 Lovejoy’s been getting all the attention, Finlay’s back in the game and making mid-January nights all that more enjoyable for sky gazing. Lovejoy is presently passing near the Pleiades star cluster in Taurus. This coming week will be the last dark one before the Moon starts to spoil the view. I hope you’re able to spot both at the next opportunity.

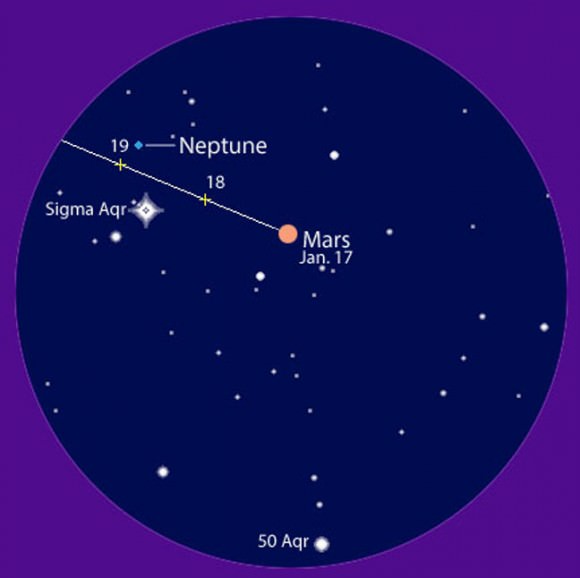
5-degree binocular view of Mars as it approaches Neptune in the next few nights. They'll be in close conjunction on the 19th. Mars shines at about 1st magnitude, Neptune at 8. Stars shown to mag. 9. Source: Chris Marriott's SkyMap software
5-degree binocular view of Mars as it approaches Neptune in the next few nights. They’ll be in close conjunction on the 19th. Mars shines at about 1st magnitude, Neptune at 8. Stars shown to mag. 9. Source: Chris Marriott’s SkyMap software

While we’re on the topic, take another look at the finder chart and you’ll see that Mars lies very near Neptune. The two are presently about 2° apart but on Monday Jan. 19th at dusk they’ll be separated by just 12 arc minutes or 1/5 of a degree and easily fit into the same medium-power view of a telescope. Pretty cool – and well worth seeing along with those comets!

Some of the Best Pictures of the Planets in our Solar System

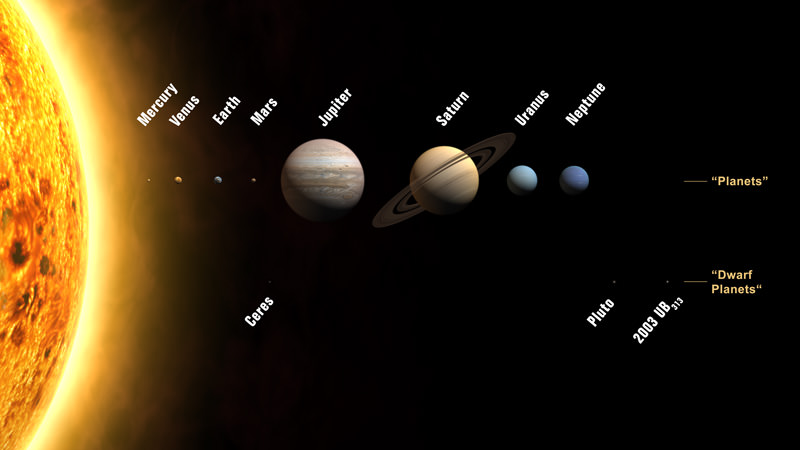
The Eight Planets of our Solar System. Credit: IAU

Our Solar System is a pretty picturesque place. Between the Sun, the Moon, and the Inner and Outer Solar System, there is no shortage of wondrous things to behold. But arguably, it is the eight planets that make up our Solar System that are the most interesting and photogenic. With their spherical discs, surface patterns and curious geological formations, Earth’s neighbors have been a subject of immense fascination for astronomers and scientists for millennia.

And in the age of modern astronomy, which goes beyond terrestrial telescopes to space telescopes, orbiters and satellites, there is no shortage of pictures of the planets. But here are a few of the better ones, taken with high-resolutions cameras on board spacecraft that managed to capture their intricate, picturesque, and rugged beauty.

Mercury, as imaged by the MESSENGER spacecraft, revealing parts of the never seen by human eyes. Image Credit: NASA/Johns Hopkins University Applied Physics Laboratory/Carnegie Institution of Washington
Mercury, as imaged by the MESSENGER spacecraft, revealing parts never before seen by human eyes. Image Credit: NASA/Johns Hopkins University/Carnegie Institution of Washington

Named after the winged messenger of the gods, Mercury is the closest planet to our Sun. It’s also the smallest (now that Pluto is no longer considered a planet. At 4,879 km, it is actually smaller than the Jovian moon of Ganymede and Saturn’s largest moon, Titan.

Because of its slow rotation and tenuous atmosphere, the planet experiences extreme variations in temperature – ranging from -184 °C on the dark side and 465 °C on the side facing the Sun. Because of this, its surface is barren and sun-scorched, as seen in the image above provided by the MESSENGER spacecraft.

A radar view of Venus taken by the Magellan spacecraft, with some gaps filled in by the Pioneer Venus orbiter. Credit: NASA/JPL

Venus is the second planet from our Sun, and Earth’s closest neighboring planet. It also has the dubious honor of being the hottest planet in the Solar System. While farther away from the Sun than Mercury, it has a thick atmosphere made up primarily of carbon dioxide, sulfur dioxide and nitrogen gas. This causes the Sun’s heat to become trapped, pushing average temperatures up to as high as 460°C. Due to the presence of sulfuric and carbonic compounds in the atmosphere, the planet’s atmosphere also produces rainstorms of sulfuric acid.

Because of its thick atmosphere, scientists were unable to examine of the surface of the planet until 1970s and the development of radar imaging. Since that time, numerous ground-based and orbital imaging surveys have produced information on the surface, particularly by the Magellan spacecraft (1990-94). The pictures sent back by Magellan revealed a harsh landscape dominated by lava flows and volcanoes, further adding to Venus’ inhospitable reputation.

Earth viewed from the Moon by the Apollo 11 spacecraft. Credit: NASA

Earth is the third planet from the Sun, the densest planet in our Solar System, and the fifth largest planet. Not only is 70% of the Earth’s surface covered with water, but the planet is also in the perfect spot – in the center of the hypothetical habitable zone – to support life. It’s atmosphere is primarily composed of nitrogen and oxygen and its average surface temperatures is 7.2°C. Hence why we call it home.

Being that it is our home, observing the planet as a whole was impossible prior to the space age. However, images taken by numerous satellites and spacecraft – such as the Apollo 11 mission, shown above – have been some of the most breathtaking and iconic in history.

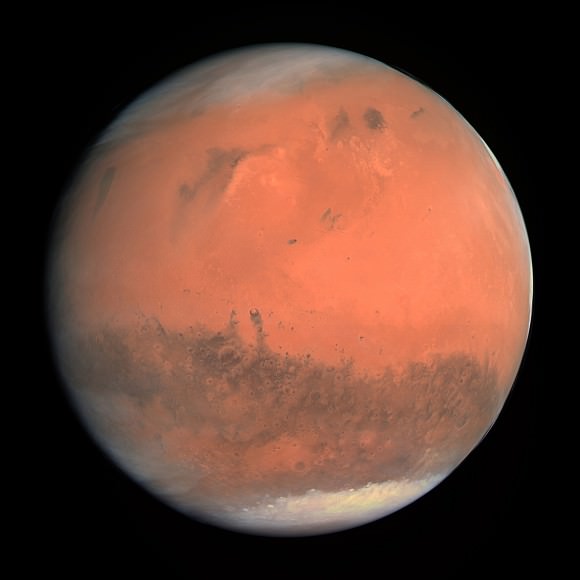
The first true-colour image of Mars from ESA’s Rosetta generated using the OSIRIS orange (red), green and blue colour filters. The image was acquired on 24 February 2007 at 19:28 CET from a distance of about 240 000 km. Credit: MPS for OSIRIS Team MPS/UPD/LAM/ IAA/ RSSD/ INTA/ UPM/ DASP/ IDA
The first true-colour image of Mars taken by the ESA’s Rosetta spacecraft on 24 February 2007. Credit: MPS for OSIRIS Team MPS/UPD/LAM/ IAA/ RSSD/ INTA/ UPM/ DASP/ IDA

Mars is the fourth planet from our Sun and Earth’s second closest neighbor. Roughly half the size of Earth, Mars is much colder than Earth, but experiences quite a bit of variability, with temperatures ranging from 20 °C at the equator during midday, to as low as -153 °C at the poles. This is due in part to Mars’ distance from the Sun, but also to its thin atmosphere which is not able to retain heat.

Mars is famous for its red color and the speculation it has sparked about life on other planets. This red color is caused by iron oxide – rust – which is plentiful on the planet’s surface. It’s surface features, which include long “canals”, have fueled speculation that the planet was home to a civilization.

Observations made by satellites flybys in the 1960’s (by the Mariner 3 and 4 spacecraft) dispelled this notion, but scientists still believe that warm, flowing water once existed on the surface, as well as organic molecules. Since that time, a small army of spacecraft and rovers have taken the Martian surface, and have produced some of the most detailed and beautiful photos of the planet to date.

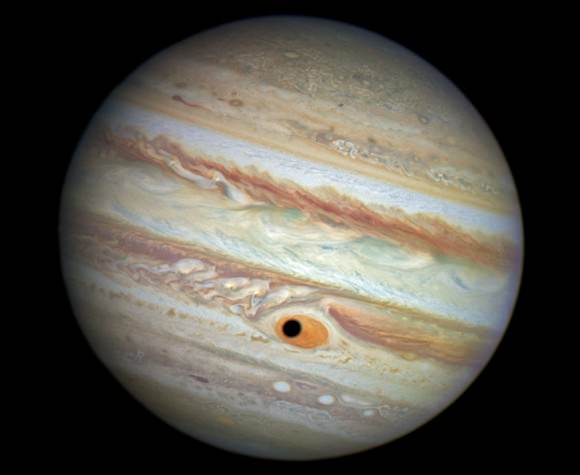
Jupiter's Great Red Spot and Ganymede's Shadow. Image Credit: NASA/ESA/A. Simon (Goddard Space Flight Center)
Jupiter’s Great Red Spot and Ganymede’s Shadow. Image Credit: NASA/ESA/A. Simon (Goddard Space Flight Center)

Jupiter, the closest gas giant to our Sun, is also the largest planet in the Solar System. Measuring over 70,000 km in radius, it is 317 times more massive than Earth and 2.5 times more massive than all the other planets in our Solar System combined. It also has the most moons of any planet in the Solar System, with 67 confirmed satellites as of 2012.

Despite its size, Jupiter is not very dense. The planet is comprised almost entirely of gas, with what astronomers believe is a core of metallic hydrogen. Yet, the sheer amount of pressure, radiation, gravitational pull and storm activity of this planet make it the undisputed titan of our Solar System.

Jupiter has been imaged by ground-based telescopes, space telescopes, and orbiter spacecraft. The best ground-based picture was taken in 2008 by the ESO’s Very Large Telescope (VTL) using its Multi-Conjugate Adaptive Optics Demonstrator (MAD) instrument. However, the greatest images captured of the Jovian giant were taken during flybys, in this case by the Galileo and Cassini missions.

Saturn and its rings, as seen from above the planet by the Cassini spacecraft. Credit: NASA/JPL/Space Science Institute. Assembled by Gordan Ugarkovic.
Saturn and its rings, as seen from above the planet by the Cassini spacecraft. Credit: NASA/JPL/Space Science Institute/Gordan Ugarkovic

Saturn, the second gas giant closest to our Sun, is best known for its ring system – which is composed of rocks, dust, and other materials. All gas giants have their own system of rings, but Saturn’s system is the most visible and photogenic. The planet is also the second largest in our Solar System, and is second only to Jupiter in terms of moons (62 confirmed).

Much like Jupiter, numerous pictures have been taken of the planet by a combination of ground-based telescopes, space telescopes and orbital spacecraft. These include the Pioneer, Voyager, and most recently, Cassini spacecraft.

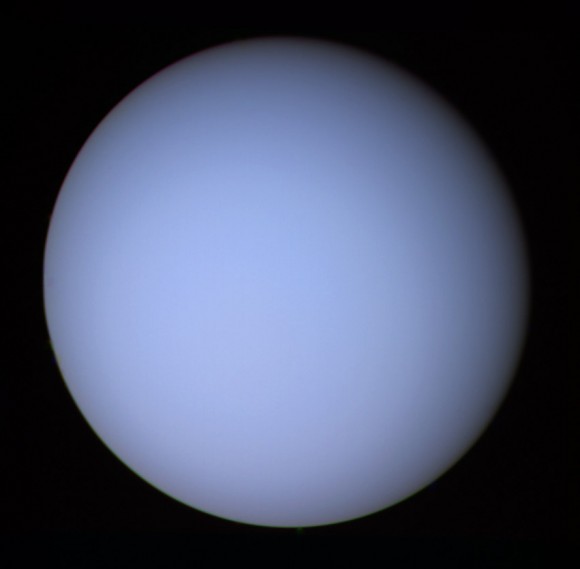
Uranus, seen by Voyager 2. Image credit: NASA/JPL
Uranus, seen by Voyager 2 spacecraft. Image credit: NASA/JPL

Another gas giant, Uranus is the seventh planet from our Sun and the third largest planet in our Solar System. The planet contains roughly 14.5 times the mass of the Earth, but it has a low density. Scientists believe it is composed of a rocky core that is surrounded by an icy mantle made up of water, ammonia and methane ice, which is itself surrounded by an outer gaseous atmosphere of hydrogen and helium.

It is for this reason that Uranus is often referred to as an “ice planet”. The concentrations of methane are also what gives Uranus its blue color. Though telescopes have captured images of the planet, only one spacecraft has even taken pictures of Uranus over the years. This was the Voyager 2 craft which performed a flyby of the planet in 1986.

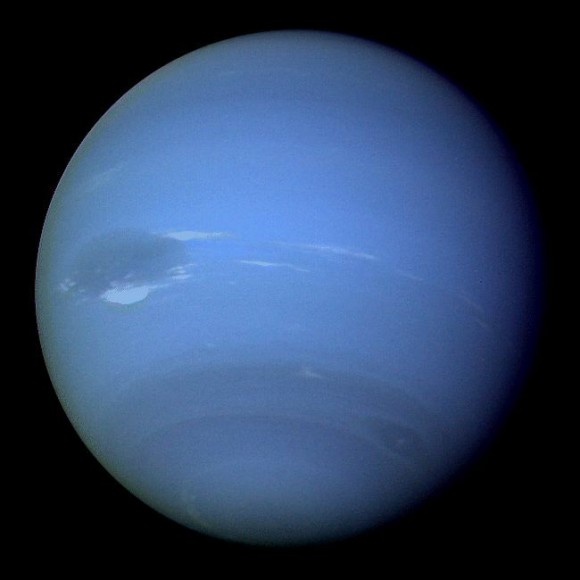
Neptune from Voyager 2. Image credit: NASA/JPL

Neptune is the eight planet of our Solar System, and the farthest from the Sun. Like Uranus, it is both a gas giant and ice giant, composed of a solid core surrounded by methane and ammonia ices, surrounded by large amounts of methane gas. Once again, this methane is what gives the planet its blue color.  It is also the smallest gas giant in the outer Solar System, and the fourth largest planet.

All of the gas giants have intense storms, but Neptune has the fastest winds of any planet in our Solar System. The winds on Neptune can reach up to 2,100 kilometers per hour, and the strongest of which are believed to be the Great Dark Spot, which was seen in 1989, or the Small Dark Spot (also seen in 1989). In both cases, these storms and the planet itself were observed by the Voyager 2 spacecraft, the only one to capture images of the planet.

Universe Today has many interesting articles on the subject of the planets, such as interesting facts about the planets and interesting facts about the Solar System.

If you are looking for more information, try NASA’s Solar System exploration page and an overview of the Solar System.

Astronomy Cast has episodes on all of the planets including Mercury.

Beagle 2: Found on Mars After An 11 Year Hunt

Credit & Coyright:

The final chapter in the saga of a wayward Mars lander was finally revealed today, as an international team released images showing the Beagle-2 lander’s final resting place on Mars.

Flashback to Christmas Day, 2003. While most folks gathered ‘round the tree and opened presents, the UK and European Space Agency awaited a gift from space.  The Beagle-2 Mars lander had been released from the European Space Agency’s Mars Express orbiter six days prior, and was coasting towards a perilous landing in Isidis Planitia and was set to phone home.

All was going according to plan, and then… silence.

It’s the worst part of any mission, waiting for a lander to call back and say that it’s safe and sound on the surface of another world. As the hours turned into days, anxious engineers used NASA’s Mars Odyssey spacecraft and the Lovell Telescope at Jodrell Bank to listen for the signal.

Beagle-2 was declared lost a few weeks later on February 6th, 2004.

But now, there’s a final twist to the tale to tell.

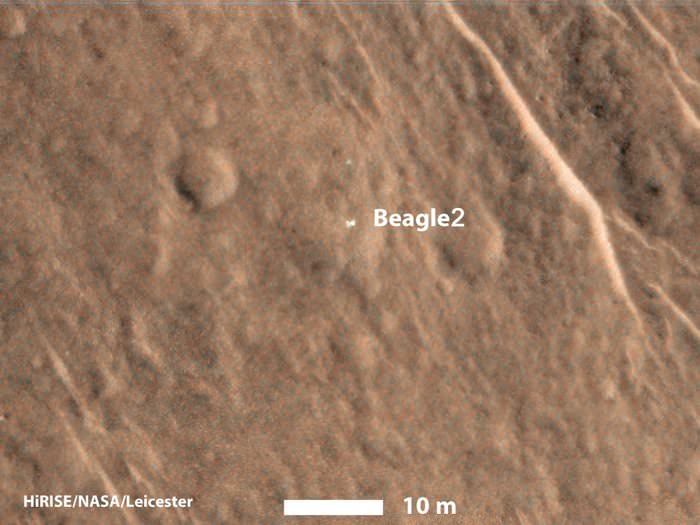
Beagle 2
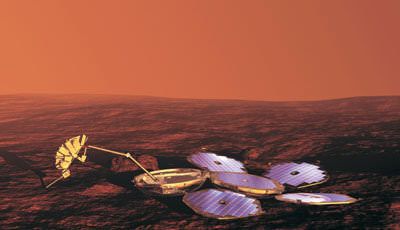
Beagle 2, partially deployed on the Martian surface. Credit and Copyright: HiRISE/NASA/Leicester.

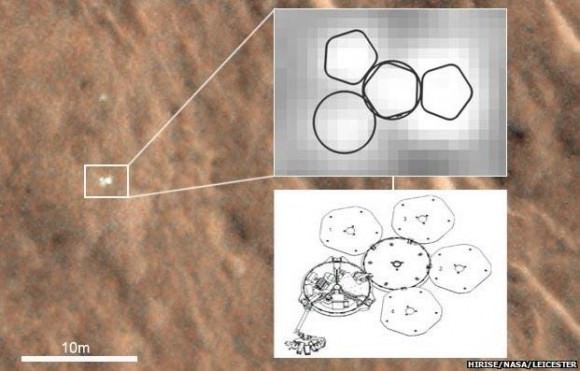
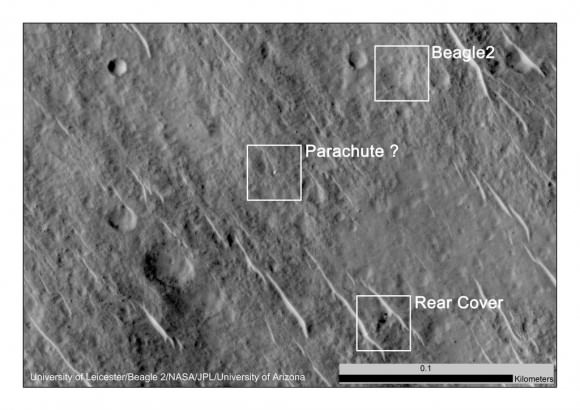
The UK Space Agency, working with ESA and NASA announced today that debris from the landing site had been identified and that indicates — contrary to suspicions — that Beagle-2 did indeed make it to the surface of the Red Planet intact. New images from the Mars Reconnaissance Orbiter released today suggest that not only did Beagle-2 land, but that its airbags did indeed deploy properly and that the dish-shaped 1-meter in diameter spacecraft partially unfolded pocket-watch style after it had bounced to a stop.

“We are very happy to learn that Beagle 2 touched down on Mars,” said ESA’s Director of Science and Robotic Exploration in a recent press release. “The dedication of the various teams in studying high-resolution images in order to find the lander is inspiring.”

So, what went wrong with Beagle-2?

At this point, no further speculation as to what caused the lander to fall silent has been forthcoming, but today’s revelation is sure to rewrite the final saga of Beagle-2.

“Not knowing what happened to Beagle-2 remained a nagging worry,” said ESA’s Mars Express project manager Rudolf Schmidt. “Understanding now that Beagle-2 made it all the way down to the surface is excellent news.”

Speculation swirled across the internet earlier this week as the UK Space Agency and ESA suggested that new information as to the fate of Beagle-2 was forthcoming, over 11 years after the incident. Back in 2004, it was suggested that Beagle-2 had encountered higher levels of dust in the Martian atmosphere than expected, and that this in turn resulted in a failure of the spacecraft’s parachutes. Presumably, the lander then failed to slow down sufficiently and crashed on the surface of Mars, the latest victim of the Great Galactic Ghoul who seems to love dining on human-built spacecraft bound for the Red Planet.

Credit: ESA
An artist’s conception of Beagle-2 fully deployed on Mars. Credit: ESA.

The loss of Beagle-2 wasn’t only a blow to the UK and ESA, but to its principal investigator Colin Pillinger as well. Pillinger was involved in the search for Beagle-2 in later years, and also played a part in the Rosetta mission to Comet 67P/Churyumov-Gerasimenko as well. Unfortunately, Pillinger passed away in May of last year from a brain hemorrhage. A portion of the western rim of Endeavour Crater currently being explored by Opportunity was named Pillinger Point in his honor.

Today’s announcement has triggered a wave of congratulations that the 11-year mystery has been solved. There have even been calls on Twitter and social media to rename the Beagle-2 site Pillinger Station.

“The history of of space exploration is marked by both success and failure,” Said Dr. David Parker, the Chief Executive of the UK Space Agency in a recent press release. “This finding makes the case that Beagle-2 was more of a success than we previously knew and undoubtedly an important step in Europe’s continuing exploration of Mars.”

Click here for the animated .gif version.
Evidence of the successful landing of Beagle-2. Click here for the animated .gif version. Credit: University of Leicester/Beagle 2/NASA/University of Arizona.

Beagle-2 is about 2 metres across unfurled, and came to rest within 5 kilometres of its target location.

There have been false announcements of the discovery of Beagle-2 before. Back in late 2005, a claim was made that the lander had been spotted by Mars Global Surveyor, though later searches came to naught.

“I can imagine the sense of closure that the Beagle-2 team must feel,” Said JPL’s MRO project scientist Richard Zurek in a recent press release. “MRO has helped find safe landing sites on Mars for the Curiosity and Phoenix missions and has searched for missing craft to learn what may have gone wrong. It’s an extremely difficult task.”

MRO entered orbit in March 2006 and carries a 0.5 metre in diameter HiRISE camera capable of resolving objects just 0.3 metres across on the surface of Mars.  The European Space Agency’s Mars Express orbiter that carried Beagle 2 is also still in operation, along with NASA’s aging Mars Odyssey spacecraft. These were joined in orbit by MAVEN and India’s Mars Orbiter just last year.

All rights reserved Beagle 2.
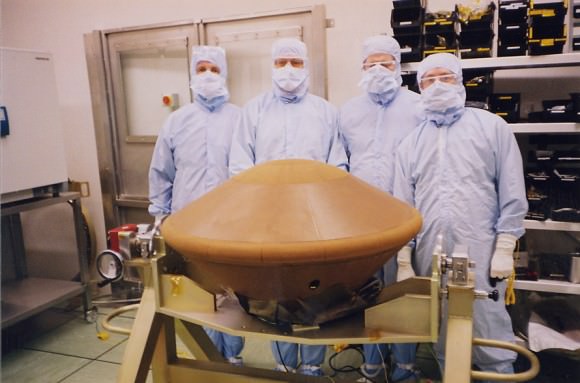
Beagle-2 encapsulated in the lab. All rights reserved, Beagle-2.

Of course, getting to Mars is tough, and landing is even harder. Mars has just enough atmosphere that you have to deal with it, but it’s so tenuous – 0.6% the surface pressure of Earth’s atmosphere at sea level – That it doesn’t provide a whole lot of usable drag.

To date, only NASA had successfully landed on Mars, and done it seven times – only the Mars Polar Lander failed back in 1999. The Russians fared much worse, with their most successful lander being Mars 3, which sent back only one blurry image before falling silent.

ESA and the Russian Federal Space Agency hope to amend that with the launch of the ExoMars mission next year, slated to land on Mars in 2018.

I remember waiting with millions of other space fans for word back from Beagle 2 on Christmas Day 2003. Think back to what your internet connection was like over 11 years ago, in an era before smart phones, Twitter and Facebook. We’d just come off of the spectacular 2003 Mars opposition season, which provided the orbital geometry ideal for launching a mission to the Red Planet. This window only comes around once every 26 months.

Though Beagle 2 was a stationary lander akin to the Viking and Mars Phoenix missions, it had a robotic arm and a clever battery of experiments, including ones designed to search for life. The signal it was supposed to use to call home was designed by the UK pop rock band Blur, a jingle that never came.

Alas, we’ll have to wait to see what the alien plains around Isidis Planitia actually look like, just 13 degrees north of the Martian equator. But hey, a lingering mystery of the modern age of planetary exploration was solved this week.

Still, we’re now left with a new dilemma. Does this mean we’ll have to write a sequel to our science fiction short story The Hunt for Beagle?

-Read free original science fiction from Dave Dickinson every Friday, including ongoing chapters from The Hunt for Beagle.


When Two Supermassive Black Holes Merge, It’s a Galactic Train Wreck

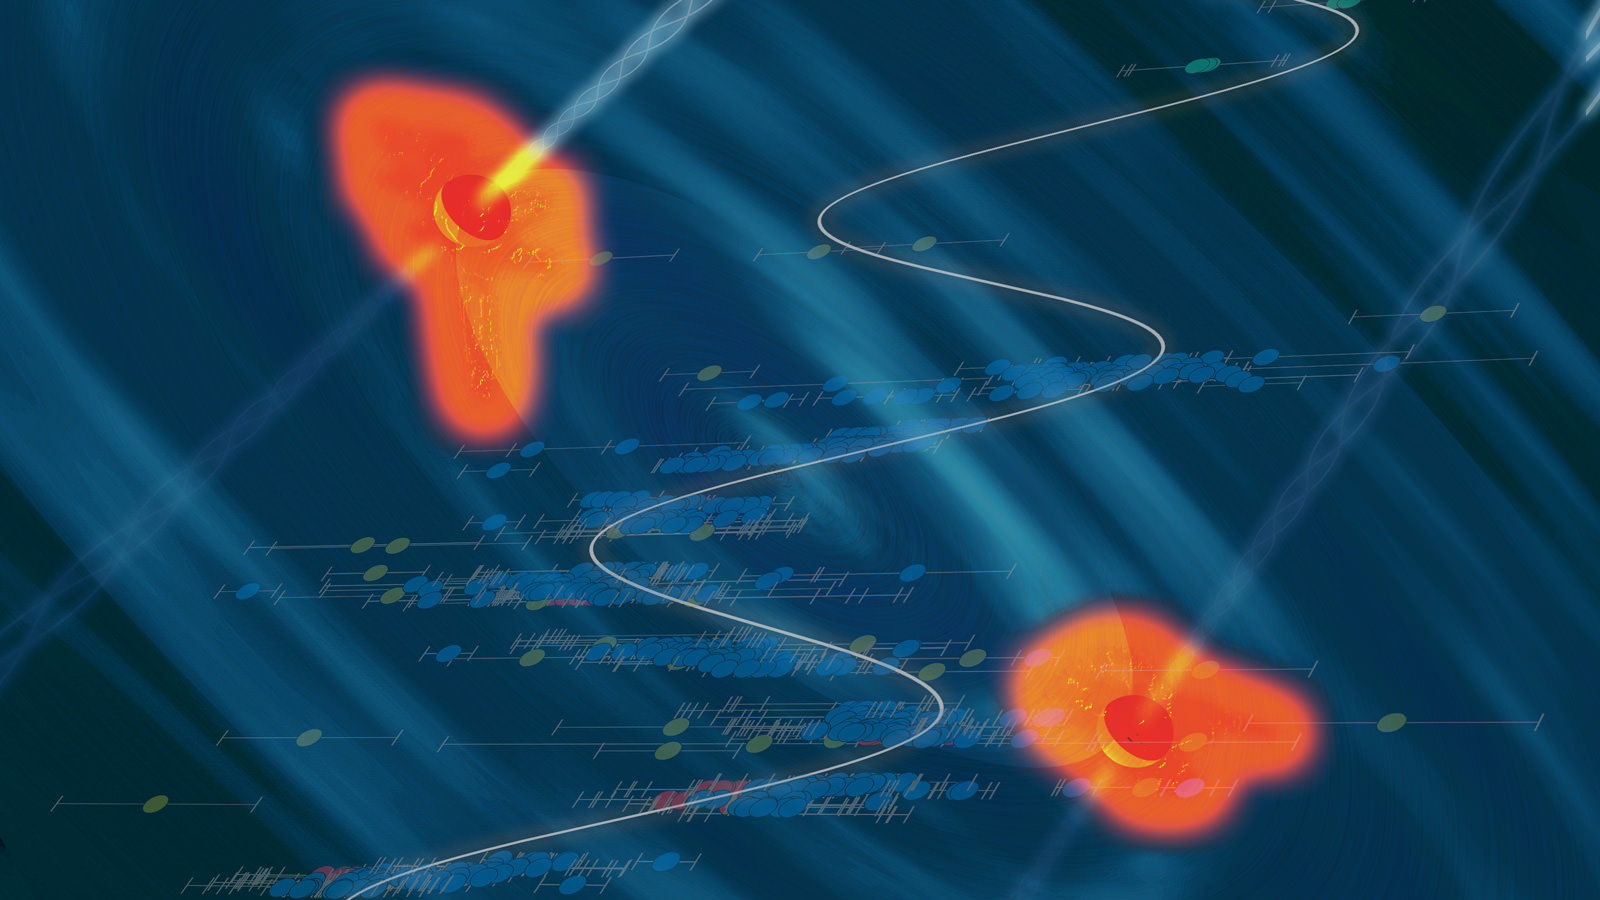
An artist's conception of a black hole binary in a heart of a quasar, with the data showing the periodic variability superposed. Credit: Santiago Lombeyda/Caltech Center for Data-Driven Discovery

Most large galaxies harbor central supermassive black holes with masses equivalent to millions, or even billions, of Suns. Some, like the one in the center of the Milky Way Galaxy, lie quiet. Others, known as quasars, chow down on so much gas they outshine their host galaxies and are even visible across the Universe.

Although their brilliant light varies across all wavelengths, it does so randomly — there’s no regularity in the peaks and dips of brightness. Now Matthew Graham from Caltech and his colleagues have found an exception to the rule.

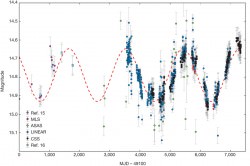
Quasar PG 1302-102 shows an unusual repeating light signature that looks like a sinusoidal curve. Astronomers think hidden behind the light are two supermassive black holes in the final phases of a merger — something theoretically predicted but never before seen. If the theory holds, astronomers might be able to witness two black holes en route to a collision of incredible scale.

The light curve combines data from two CRTS telescopes (CSS and MLS) with historical data from the LINEAR and ASAS surveys, and the literature15, 16 (see Methods for details). The error bars represent one standard deviation errors on the photometry values. The red dashed line indicates a sinusoid with period 1,884 days and amplitude 0.14 mag. The uncertainty in the measured period is 88 days. Note that this does not reflect the expected shape of the periodic waveform, which will depend on the physical properties of the system. MJD, modified Julian day. Image Credit: Graham et al.
The light curve combines data from two CRTS telescopes (CSS and MLS) with historical data from the LINEAR and ASAS surveys. Image Credit: Graham et al.

Graham and his colleagues discovered the unusual quasar on a whim. They were aiming to study quasar variability using the Catalina Real-Time Transient Survey (CRTS), which uses three ground-based telescopes to monitor some 500 million objects strewn across 80 percent of the sky, when 20 or so periodic sources popped up.

Of those 20 periodic quasars, PG 1302-102 was the most promising. It had a strong signal that appeared to repeat every five years or so. But what causes the repeating signal?

The black holes that power quasars do not emit light. Instead the light originates from the hot accretion disk that feeds the black hole. Orbiting clouds of gas, which are heated and ionized by the disk, also contribute in the form of visible emission lines.

“When you look at the emission lines in a spectrum from an object, what you’re really seeing is information about speed — whether something is moving toward you or away from you and how fast. It’s the Doppler effect,” said study coauthor Eilat Glikman from Middlebury College in Vermont, in a news release. “With quasars, you typically have one emission line, and that line is a symmetric curve. But with this quasar, it was necessary to add a second emission line with a slightly different speed than the first one in order to fit the data. That suggests something else, such as a second black hole, is perturbing this system.”

So a tight supermassive black hole binary is the most likely explanation for this oddly periodic quasar.

“Until now, the only known examples of supermassive black holes on their way to a merger have been separated by tens or hundreds of thousands of light years,” said study coauthor Daniel Stern from NASA’s Jet Propulsion Laboratory. “At such vast distances, it would take many millions, or even billions, of years for a collision and merger to occur. In contrast, the black holes in PG 1302-102 are, at most, a few hundredths of a light year apart and could merge in about a million years or less.”

But astronomers remain unsure about what physical mechanism is responsible for the quasar’s repeating light signal. It’s possible that one quasar is funneling material from its accretion disk into jets, which are rotating like beams from a lighthouse. Or perhaps a portion of the accretion disk itself is thicker than the rest, causing light to be blocked at certain spots in its orbit. Or maybe the accretion disk is dumping material onto the black hole in a regular fashion, causing periodic bursts of energy.

“Even though there are a number of viable physical mechanisms behind the periodicity we’re seeing — either the precessing jet, warped accretion disk or periodic dumping — these are all still fundamentally caused by a close binary system,” said Graham.

Astronomers still don’t have a good handle on what happens in the final few light-years of a black hole merger. And of course these two black holes still won’t collide for thousands to millions of years. Even watching for the period to shorten as they spiral inward would dwarf human timescales. But the discovery of a system so late in the game proves promising for future work.

The results have been published in Nature.

Big Asteroid 2004 BL86 Buzzes Earth on January 26: How to See it in Your Telescope

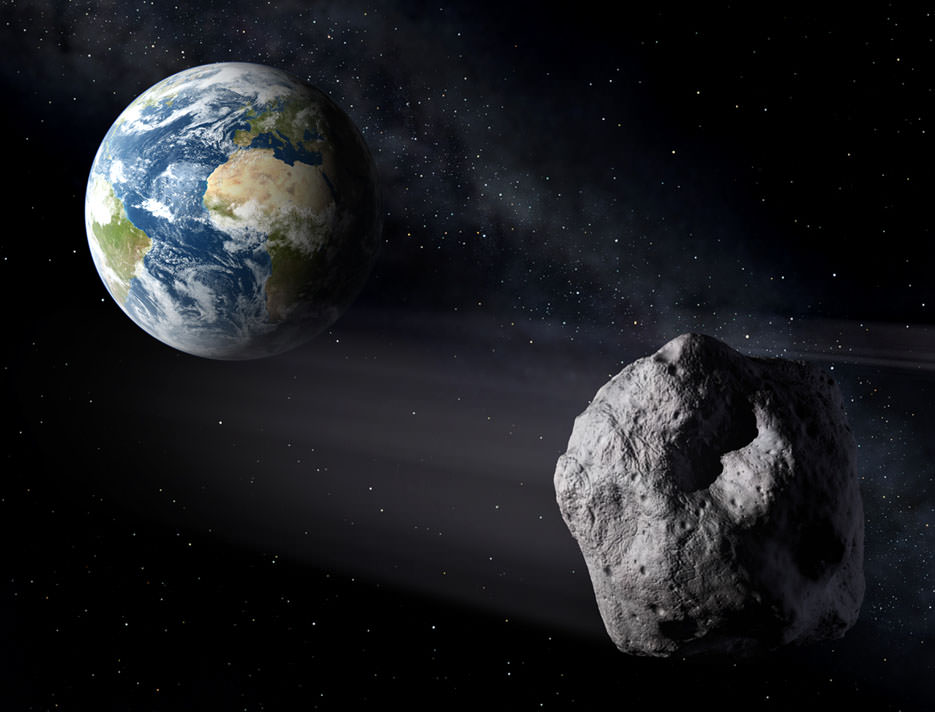
Artist view of an asteroid passing Earth. Credit: ESA/P.Carril

A lot of asteroids pass near Earth every year. Many are the size of a house, make close flybys and zoom out of the headlines. 2004 BL86 is a bit different. On Monday evening January 26th, it will become the largest asteroid to pass closest to Earth until 2027 when 1999 AN10 will approach within one lunar distance.

Big is good. 2004 BL86 checks in at 2,230 feet (680-m) wide or nearly half a mile. Add up its significant size and relatively close approach – 745,000 miles (1.2 million km) – and something wonderful happens. This newsy space rock is expected to reach magnitude +9.0, bright enough to see in a 3-inch telescope or even large binoculars.

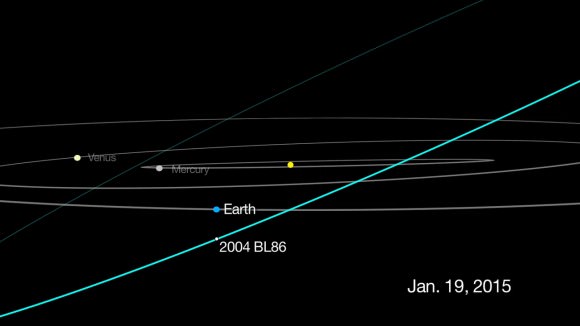
This graphic depicts the passage of asteroid 2004 BL86, which will come no closer than about three times the distance from Earth to the moon on Jan. 26, 2015. Due to its orbit around the sun, the asteroid is currently only visible by astronomers with large telescopes who are located in the southern hemisphere. But by Jan. 26, the space rock's changing position will make it visible to those in the northern hemisphere. Click to see an animation. Credit: NASA/JPL-Caltech
This graphic depicts the passage of asteroid 2004 BL86, which will safely pass by the Earth on January 26th. Closest approach occurs around 10 a.m (CST) that day. The asteroid is currently only visible by astronomers with large telescopes who are located in the southern hemisphere. But by Jan. 26, the space rock’s changing position will make it visible to those in the northern hemisphere. Click to see an animation. Credit: NASA/JPL-Caltech

This is a rare opportunity then to see an Earth-approaching asteroid so easily. All you need is a good map as 2004 BL86 will be zipping along at two arc seconds per second or two degrees (four Moon diameters) per hour. That means you’ll see it move in real time like a slow satellite inching its way across the sky. Cool!

As you can see from its name, 2004 BL86 was discovered 11 years ago in 2004 by the Lincoln Near-Earth Asteroid Research (LINEAR), an MIT Lincoln Laboratory program to track near-Earth objects  funded by the U.S. Air Force and NASA. As of September 15, 2011, the search has swept up 2,423 new asteroids and 279 new comets.

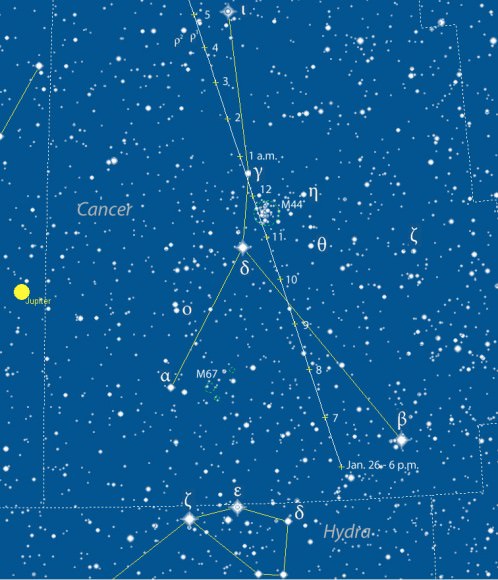
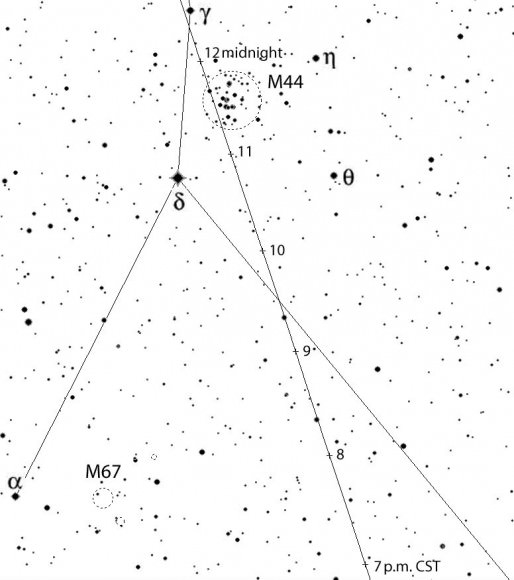
Map showing the hourly progress of 2004 BL86 Monday evening January 26th as it treks across Cancer the Crab not far from Jupiter. Stars are shown to magnitude +9. The number at the tick marks show the time (CST) each hour starting at 6 p.m., then 7 p.m., 8 p.m. and so on. Click for a larger version. Created with Chris Marriott's SkyMap program
Map showing the hourly progress of 2004 BL86 Monday evening January 26th as it treks across Cancer the Crab not far from Jupiter. Stars are shown to magnitude +9. Numbers at the tick marks show the time (CST) each hour starting at 6 p.m., then 7 p.m., 8 p.m. and so on. Click for a larger version. Created with Chris Marriott’s SkyMap program

All asteroids with well-known orbits receive a number. The first asteroid, 1 Ceres, was discovered in 1801. The 4,150th asteroid, 4150 Starr and named for the Beatles’ Ringo Starr, was found in 1984. 2004 BL86 will likely be the highest-numbered asteroid any of us will ever see. How does 357,439 sound to you?

Some observers prefer a black on white map for tracking asteroids and deep sky objects. Click to view a larger version. Created with Chris Marriott's SkyMap program
Some observers prefer a black on white map for tracking asteroids and deep sky objects. Click to view a larger version. Created with Chris Marriott’s SkyMap program

Observers in the Americas, Europe and Africa will have the best seats for viewing the asteroid, which will shine brightest between 7 p.m. and midnight CST from a comfortably high perch in Cancer the Crab not far from Jupiter. The half-moon will also be out but over in the western sky, so shouldn’t get in the way of seeing our speedy celeb.

Not only will 2004 BL86 pass near a few fairly bright stars but the Beehive Cluster (M44) will temporarily gain a new member between 11 p.m. and midnight as the asteroid buzzes across the well-known star cluster.

“Monday, January 26 will be the closest asteroid 2004 BL86 will get to Earth for at least the next 200 years,” said Don Yeomans, who’s retiring as manager of NASA’s Near Earth Object Program Office at the Jet Propulsion Laboratory in Pasadena, California, after 16 years in the position.

More detailed map showing the hourly position of the asteroid through central Cancer. Stars plotted to magnitude +9.5. Created with Chris Marriott's SkyMap software
More detailed map showing the hourly position of the asteroid through central Cancer. Stars plotted to magnitude +9.5. Click to get a larger version. Created with Chris Marriott’s SkyMap software

To learn more about the space rock and acquire close-ups of its surface, NASA’s Deep Space Network antenna at Goldstone, California, and the Arecibo Observatory in Puerto Rico will attempt to ping the asteroid with microwaves to create radar-generated images of the asteroid during the days surrounding its closest approach to Earth.

“When we get our radar data back the day after the flyby, we will have the first detailed images,” said radar astronomer Lance Benner of JPL, principal investigator for the Goldstone radar observations of the asteroid. “At present, we know almost nothing about the asteroid, so there are bound to be surprises.”

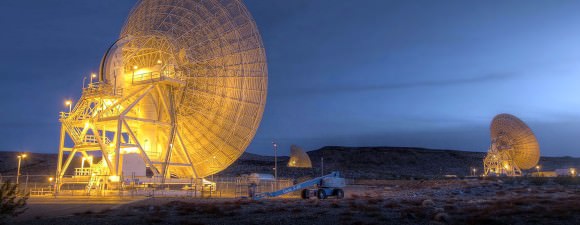
NASA's Deep Space Network will be watching during 2004 BL86's flyby Monday Jan. 26. Credit: NASA
NASA’s Deep Space Network will be watching during 2004 BL86’s flyby Monday Jan. 26. Credit: NASA

While 2004 BL86 will be brightest Monday night, that’s not the only time amateur astronomers might see it. It comes into view for southern hemisphere observers around magnitude +13 on Jan. 24 and leaves the scene at a similar brightness high in the northeastern sky in the northern hemisphere on the 29th. If you use a star-charting program like Starry Night, Guide, MegaStar and others, you can get updated orbital element packages HERE.  Just select your program and download the Observable Unusual Minor Planets file. Open it in your software and create maps for the entire apparition.

One last observing tip before you go your own way. Close asteroids will sometimes be a little bit off a particular track depending on your location. Not much but enough that I recommend you scan not just the single spot where you expect to see it but also nearby in the field of view. If you see a “star” on the move – that’s it.

As always, Dr. Gianluca Masi, Italian astrophysicist, will share his live coverage of the event beginning at 1:30 p.m. (19:30 UT) Jan. 26th.

Let us know if you see our not-so-little cosmic friend. Good luck!

Like a BOSS: How Astronomers are Getting Precise Measurements of the Universe’s Expansion Rate

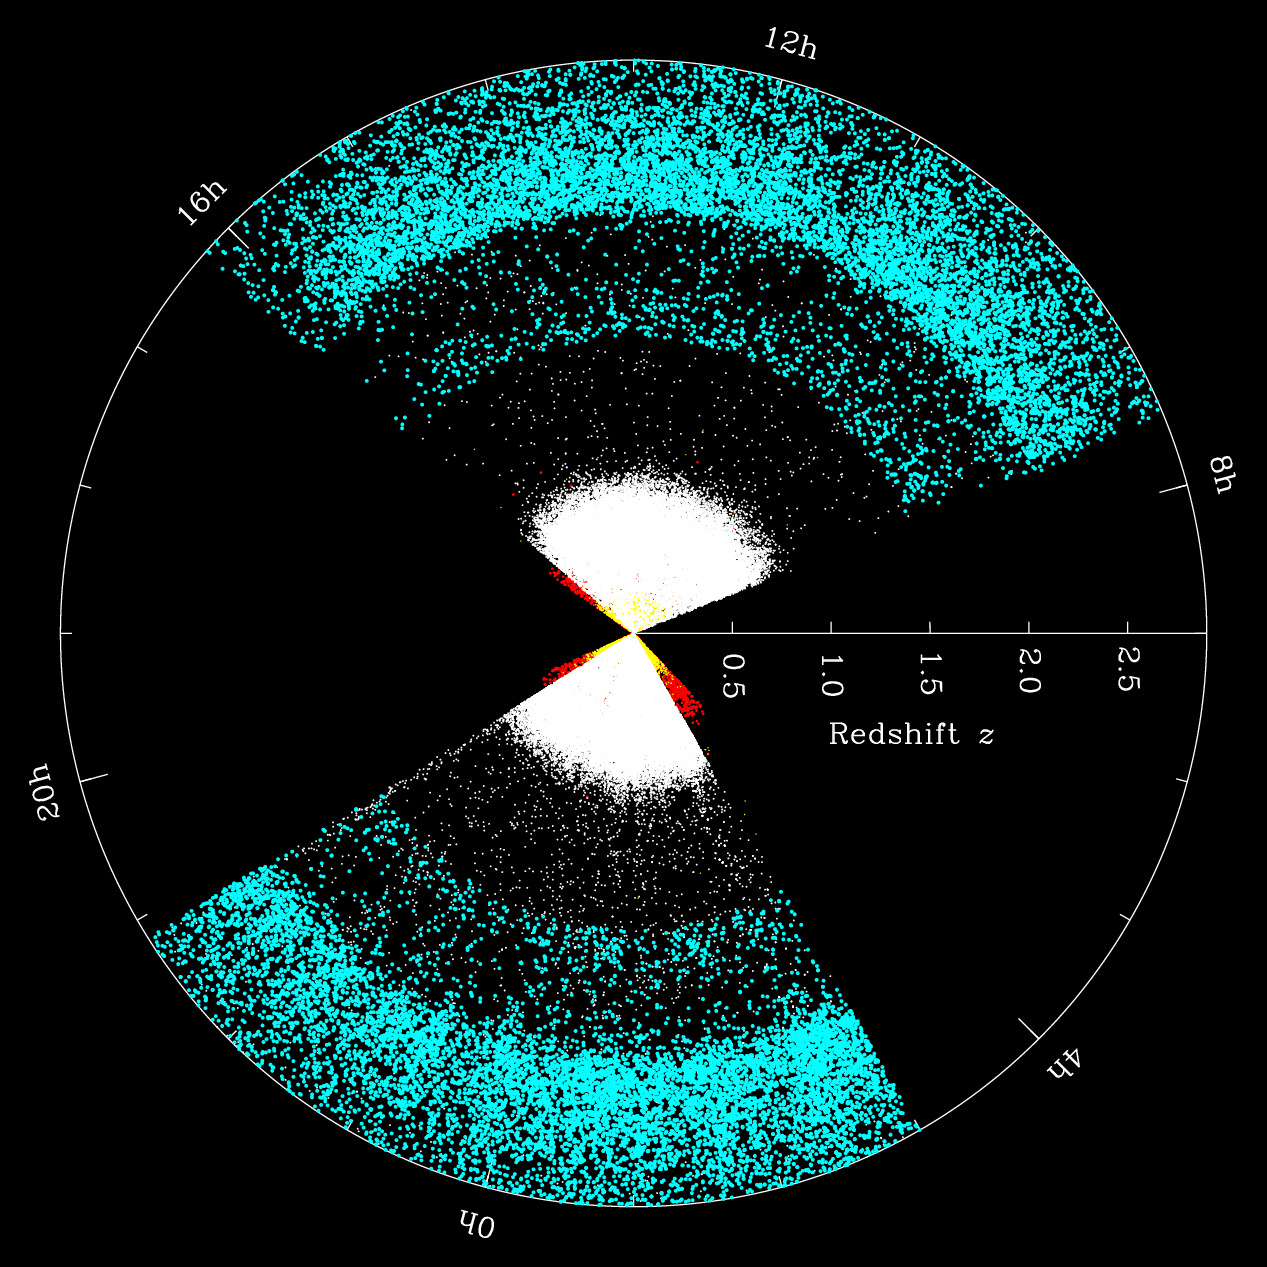
Distribution of galaxies and quasars in a slice of BOSS out to a redshift of 3, or 11 billion years in the past. Credit: SDSS-III

Astrophysicists studying the expansion of the Universe with the largest galaxy catalogs ever assembled are ushering in an exciting era of precision cosmology. Last week, the Sloan Digital Sky Survey (SDSS) issued its final public data release, and scientists working in its largest program, the Baryon Oscillation Spectroscopic Survey (BOSS) also presented their final results at the American Astronomical Society meeting in Seattle, Washington.

By mapping over 10,000 square degrees — 25% of the sky — BOSS is “measuring our universe’s accelerated expansion with the world’s largest extragalactic redshift survey,” according to SDSS-III Director Daniel Eisenstein of the Harvard-Smithsonian Center for Astrophysics. The BOSS results include new and precise measurements of the universe’s expansion rate (called the “Hubble constant”) and matter density, which includes dark matter, stars, gas, and dust.

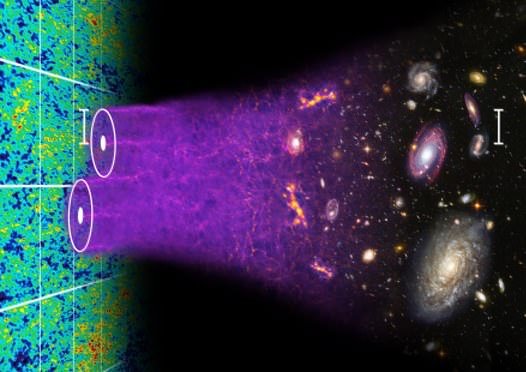
BOSS conducted its observations at 2.5-meter Sloan Foundation Telescope at Apache Point Observatory in New Mexico, producing spectra and spatial positions for 1.5 million galaxies and 300,000 quasars in a volume equivalent to a cube with length 8.5 billion light-years on a side (see image above). Astronomers used this rich dataset to map the objects’ distributions and to detect the characteristic scale imprinted by baryon acoustic oscillations in the early universe. Sound waves propagate outward with time, like ripples spreading in a pond, and are indicated by a large-scale clustering signal in the positions of galaxies relative to each other (see illustration below). By analyzing this signal at different times, it is possible to study the behavior of the mysterious “dark energy” causing the accelerating expansion of the universe.

An illustration of the concept of baryon acoustic oscillations, imprinted in the early universe and seen today in galaxy surveys. (courtesy:  Chris Blake and Sam Moorfield)
An illustration of the concept of baryon acoustic oscillations, imprinted in the early universe and seen today in galaxy surveys. (courtesy: Chris Blake and Sam Moorfield)

In BOSS’s final results, hundreds of scientists in the international collaboration measured this scale with unprecedented precision. In particular, Ashley Ross from Ohio State University presented results that demonstrated the power of combining an analysis of the transverse and line-of-sight distributions of galaxies. In a paper by Eric Aubourg and collaborators, BOSS astronomers measured the cosmic distance scale of galaxies in the “local” universe and of quasars in the distance universe with impressively small systematic errors—at less than the 1% level—when combined with cosmic microwave background constraints. Their cosmological analysis yields a measurement of the Hubble constant and of the matter density of the universe consistent with a “flat” cold dark matter cosmology with a cosmological constant (see below). Cosmological models including curvature, evolving dark energy, or massive neutrinos are not completely ruled out but are less supported by the data than before. Other results from the collaboration will be submitted for publication in the coming months.

Cosmological constraints on the Hubble parameter h, matter density Ωm, and curvature parameter Ωk from BOSS's baryon acoustic oscillations (BAO) combined with supernovae (SN) and Planck results. (Courtesy: Aubourg et al. 2014)
Cosmological constraints on the Hubble parameter h, matter density Ωm, and curvature parameter Ωk from BOSS’s baryon acoustic oscillations (BAO) combined with supernovae (SN) and Planck results. (Courtesy: Aubourg et al. 2014)

The BOSS dataset “represents the gold standard in mapping out the network of galaxies that comprises the large-scale structure of the Universe…The data enables us to trace, with greater precision than ever before, the presence of dark energy, the behaviour of gravity on cosmic scales, and the effect of massive neutrinos,” says Chris Blake of Swinburne University, not affiliated with the collaboration.

Where will the BOSS team go from here? The collaboration has begun work on SDSS-IV, whose six-year mission includes an ambitious extended BOSS (eBOSS) survey. According to eBOSS Targeting Coordinator Jeremy Tinker of New York University, eBOSS observations of over 700,000 quasars will precisely measure the distance scale “at a much higher redshift regime that is not covered by current large-scale surveys.”

You can read more about BOSS and updates about the three other componenets of the SDSS in our previous article here.
SDSS website

(Full disclosure: Ramin Skibba had been a member of the BOSS collaboration during 2010-2012.)

What Is The Gibbous Moon?

Astrophoto: The Moon by Logan Mancuso
The Moon. Credit: Logan Mancuso

What does it mean when you hear the term “gibbous moon”? It’s when the Moon is more than half full, but not quite fully illuminated, when you look at it from the perspective of Earth. The reason the light changes has to do with how the Moon orbits the Earth.

The average distance between the Earth and the Moon is about 382,500 km (237,675 miles). As the Moon orbits our planet, the illumination of the Sun changes on its surface. The Moon takes about 29.5 days to go from a new moon to a full moon and then back again. This is called a “synodic period” or sometimes, a “synodic month.”

It’s slightly longer than the “sidereal period” or “sidereal month” (27.3 days) for the Moon to return to the same position relative to the stars. That’s because the Earth is moving at the same time along its orbit of the Sun, requiring the Moon to “catch up” to reach the same illumination, according to NASA.

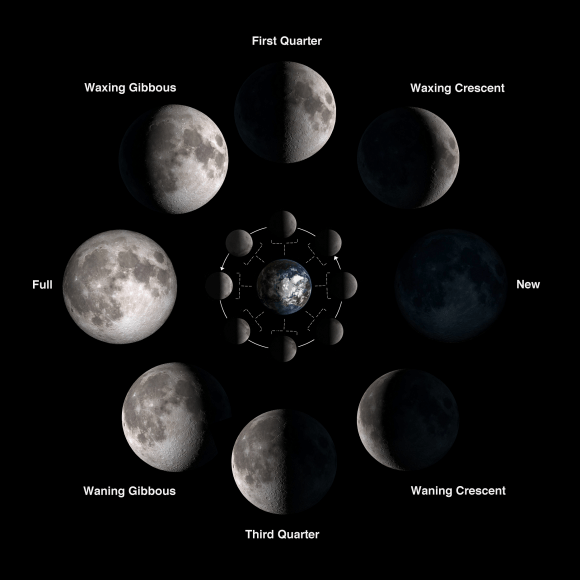
How the phases of the Moon work. Credit: NASA/Bill Dunford

So as the Moon orbits the Earth, the illumination of the Sun changes. When the Moon is in between the Earth and the Sun — with the three objects perfectly aligned — the angle between the Moon and the Sun is 0 degrees. This produces a “new moon”, which is when the Moon is not illuminated or barely illuminated at all.

The first quarter occurs when the Moon is at a 90-degree angle with the Sun, as seen from Earth. Once the Moon’s angle exceeds 90 degrees, that’s when it enters the waxing gibbous phase. At 180 degrees from the Sun, the Moon is fully illuminated (a full moon). Then after it reaches 180 degrees, when the Moon and the Sun are on the opposite sides of the Earth, it becomes a waning gibbous moon.

At 270 degrees, the Moon finishes its gibbous phase, enters the third quarter of its synodic period and becomes a waning crescent, until it reaches the new moon phase and starts the cycle anew. And actually, the Moon’s position around the Earth plays a role in solar and lunar eclipses.

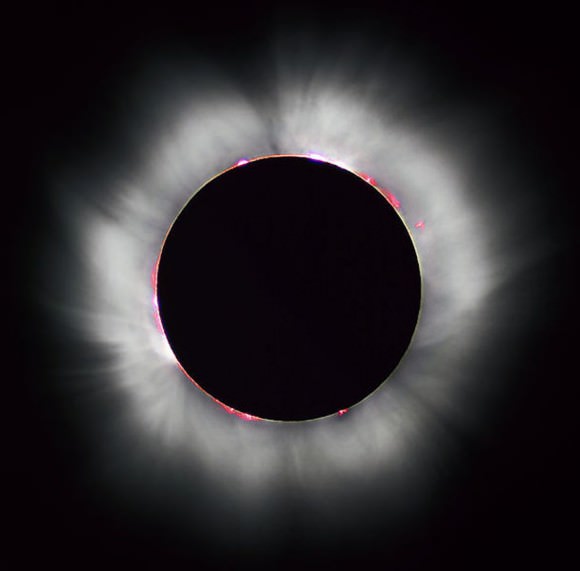
Total solar eclipse in 1999. The alignment of the nearby Moon and massive Sun, the weightiest body in the Solar System by far, didn't cause anyone to float off the ground. To my knowledge. Credit: Luc  Viatour
Total solar eclipse in 1999. Credit: Luc Viatour

A solar eclipse can only happen when the Moon is in its “new phase”. This is, again, because of geometry — because the Moon is in between the Sun and the Earth. From time to time, the position of the Moon lines up with the position of the Sun in Earth’s sky. Coincidentally, the Sun and the Moon appear to be about the same size from Earth’s surface, which makes it possible for the Moon to completely (or almost completely) block the Sun. This creates a solar eclipse. The full eclipse phase can last anywhere from seconds to minutes.

By contrast, a lunar eclipse happens when the Moon is in its “full phase.” At this time, the Earth is in between the Moon and the Sun. When the Moon enters the Earth’s shadow, the shadow can completely or partially fall across the Moon’s surface. A total lunar eclipse phase tends to last anywhere from minutes to over an hour. It creates a ruddy (red or brown) glow due to the effect of sunsets and sunrises all around the Earth shining on the Moon at the same time, according to Bad Astronomy’s Phil Plait.

You’ll notice that as the Moon goes through its various phases, it keeps the same side of itself turned towards Earth. This is due to an effect called tidal locking. After the Moon was formed (likely through a near-cataclysmic collision with Earth), its rotation period didn’t align with that of Earth’s. But over millions of years, the tug of the Earth’s gravity produced a bulge in the Moon’s interior on the side closest to Earth.

Tidal locking results in the Moon rotating about its axis in about the same time it takes to orbit the Earth (left side). If the Moon didn't spin at all, then it would alternately show its near and far sides to the Earth while moving around our planet in orbit, as shown in the figure on the right. Credit: Wikipedia
Tidal locking results in the Moon rotating about its axis in about the same time it takes to orbit the Earth (left side). If the Moon didn’t spin at all, then it would alternately show its near and far sides to the Earth while moving around our planet in orbit, as shown in the figure on the right. Credit: Wikipedia

As Discovery News explains, over time that bulge was pulled back and forth as the Moon orbited Earth. If the rotation is much slower than the orbit, the bulge “lags behind” while the smaller body orbits. Eventually, this causes one side to always face the larger body.

Tidal locking, by the way, is a fairly common phenomenon in our Solar System — particularly at Jupiter and Saturn, which are massive gas giants that (compared to their immense size) have nat-sized moons orbiting close by. Tidal locking also likely takes place with exoplanets that are orbiting close in to their parent stars.

We have done many stories on Universe Today about the Moon. Here’s one about the phases of the Moon. Want to know when the next full moon is going to be? Here’s a handy guide from NASA that covers the phases of the Moon for 6000 years. And here’s a good explainer on the phases of the Moon. We also discussed the formation of the Moon on Astronomy Cast, Episode 17: Where Did the Moon Come From?