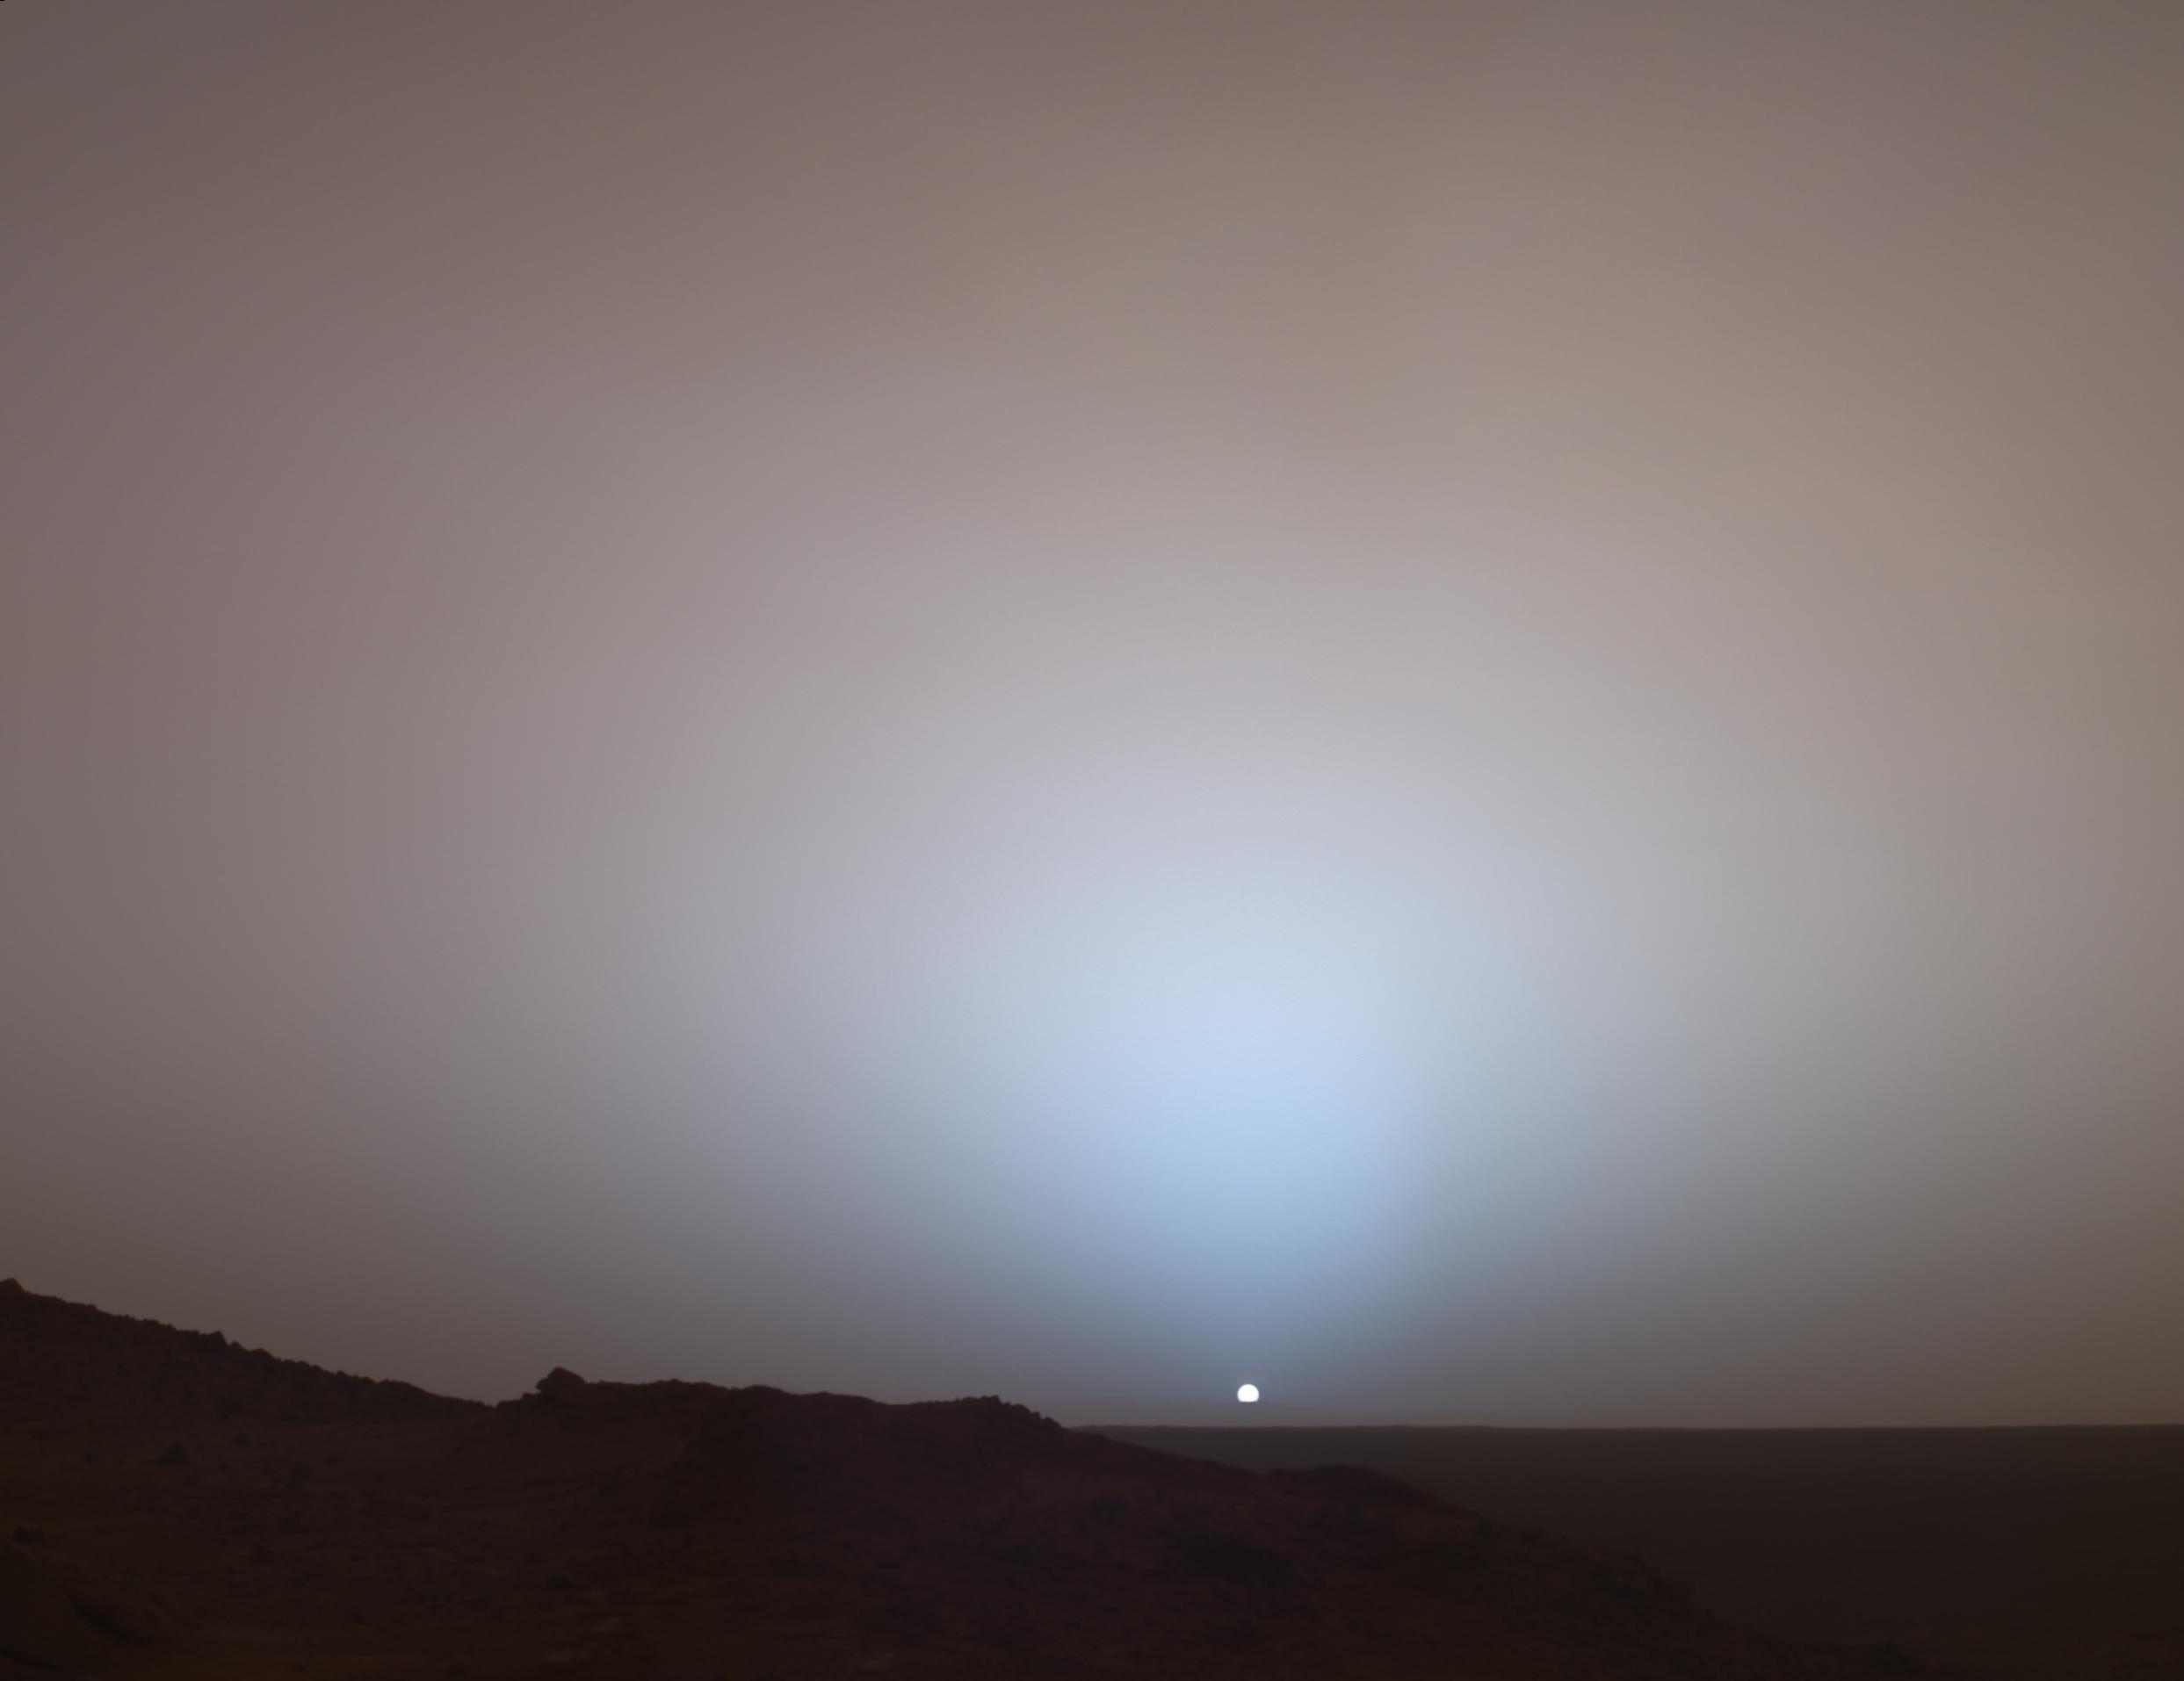
Even robots can’t tear their eyes from a beautiful sunset. NASA’s Mars Curiosity rover pointed its high resolution mast camera at the setting Sun to capture this 4-image sequence on April 15 at the conclusion of the mission’s 956th Martian day. While it resembles an earthly sunset, closer inspection reveals alien oddities.
A day on Mars lasts 24 hours and 39 minutes, so sunrise and sunset follow nearly the same rhythm as they do on Earth. When we eventually establish a base there, astronauts should be able to adjust to the planet’s day-night rhythm with relative ease. Jet lag would be worse.
But sunsets and sunrises offer a different palette of colors than they would on Earth. For starters, the Sun only radiates the equivalent of a partly cloudy afternoon’s worth of light. That’s because Mars’ average distance from the Sun is 141.6 million miles or about half again Earth’s distance. Increased distance reduces the intensity of sunlight.
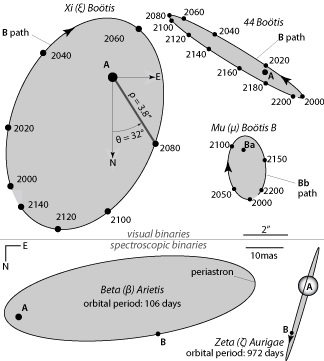
Not only that, but the solar disk shrinks from the familiar 0.5° across we see from Earth to 0.35° at Mars. Here on the home planet, your little finger extended at arm’s length would cover the equivalent of two Suns. On Mars it would be three!
What about color? Dust and other fine particles in the atmosphere scatter the blues and greens from the setting or rising Sun to color it yellow, orange and red. When these tints are reflected off clouds, sunset colors are amplified and spread about the sky, making us reach for that camera phone to capture the glory.
Things are a little different on Mars. The ever-present fine dust in the Martian atmosphere absorbs blue light and scatters the warmer colors, coloring the sky well away from the Sun a familiar ruddy hue. At the same time, dust particles in the Sun’s direction scatter blue light forward to create a cool, blue aureole near the setting Sun. If you were standing on Mars, you’d only notice the blue glow when the Sun was near the horizon, the time when its light passes through the greatest depth of atmosphere and dust.
On Earth, blue light from the Sun is scattered by air molecules and spreads around the sky to create a blue canopy. Mars has less the 1% of Earth’s atmosphere, so we only notice the blue when looking through the greatest thickness of the Martian air (and dust) around the time of sunset and sunrise.
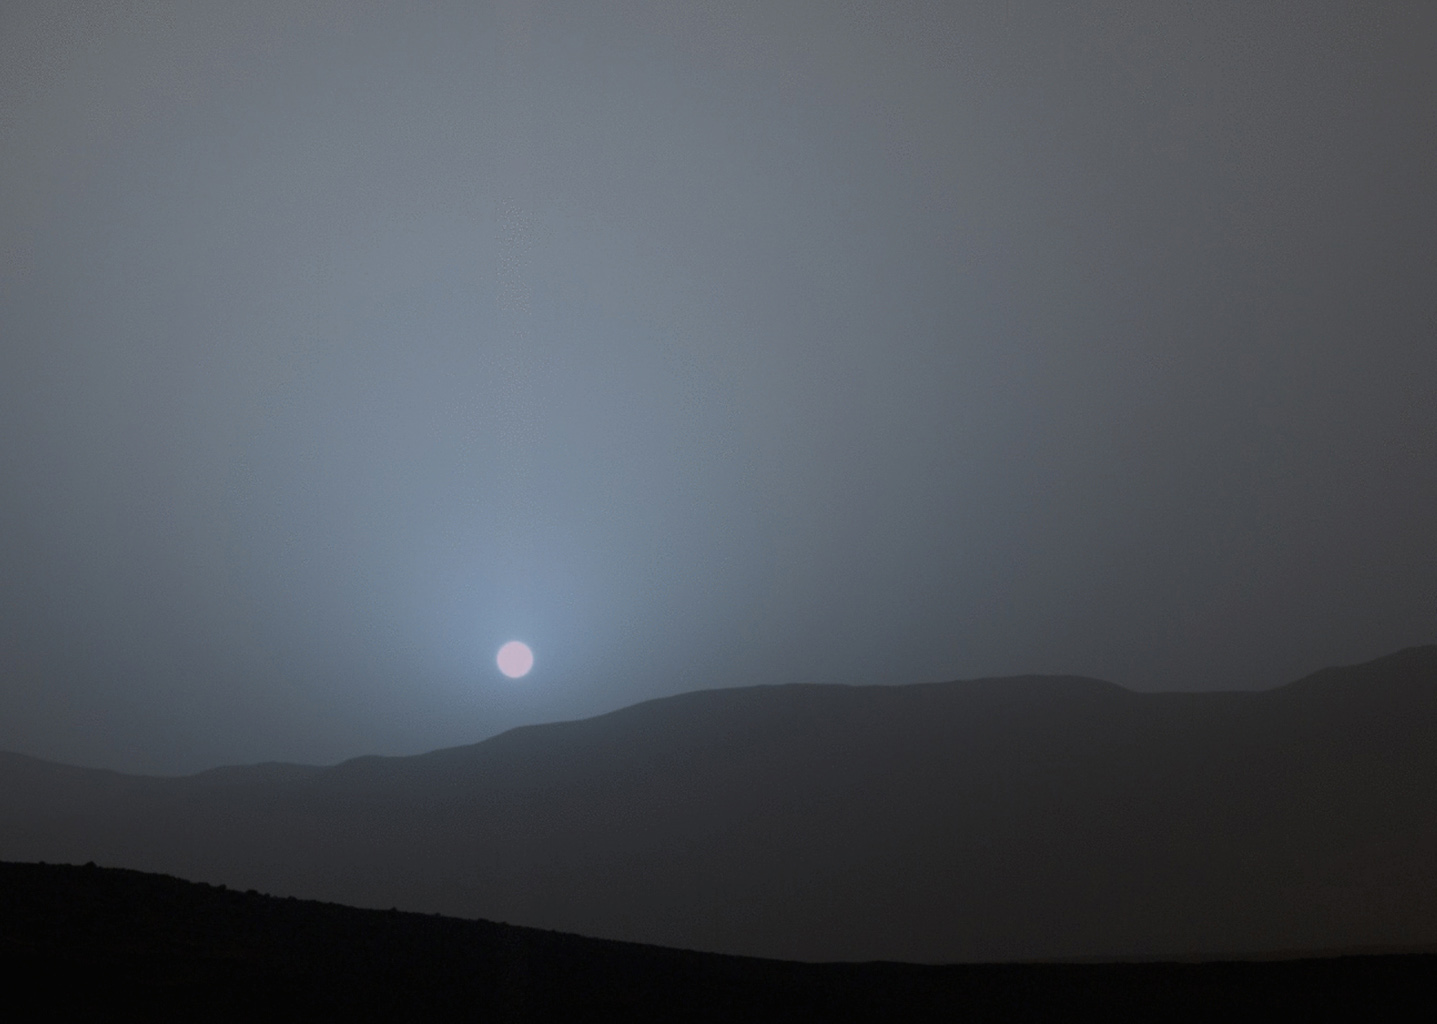
Sunset on Mars photographed by the Opportunity Rover released earlier this year
The video above of the setting Sun was made using stills taken by Opportunity, NASA’s “other” rover that’s been trekking across the Martian landscape for more than 10 years now. You can see a bit of pink in the Sun just before it sets as in the Curiosity photos, but there’s something else going on, too. Or not going on.
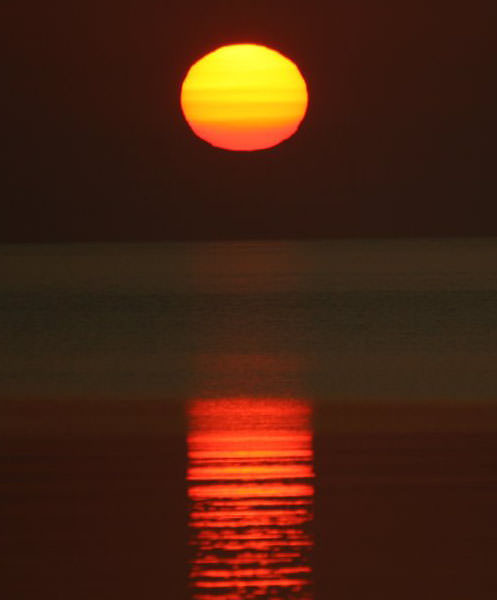
When the Sun sets or rises on Earth, it’s squashed like a melon due to atmospheric refraction. Much thicker air adjacent to the horizon bends the Sun’s light upward, pushing the bottom of the solar disk into the top half which is less affected by refraction because it’s slightly higher. Once the Sun rises high enough, so we’re looking at it through less atmosphere, refraction diminishes and it becomes a circle again.
I’ve looked at both the Opportunity sunset and Curiosity sunset videos many times, and as far as I can tell, the Sun’s shape doesn’t change. At least it’s not noticeable to the casual eye. I bet you can guess why — the air is too thin to for refraction to make much of a difference.
Twilights linger longer on the Red Planet as well because dust lofted high into the stratosphere by storms continues to reflect the Sun’s light for two hours or more after sundown.
So you can see that sunset phenomena on Mars are different from ours because of the unique qualities of its atmosphere. I trust someone alive today will be the first human to see and photograph a Martian sunset. Hope I’m still around when that awesome pic pops up on Twitter.