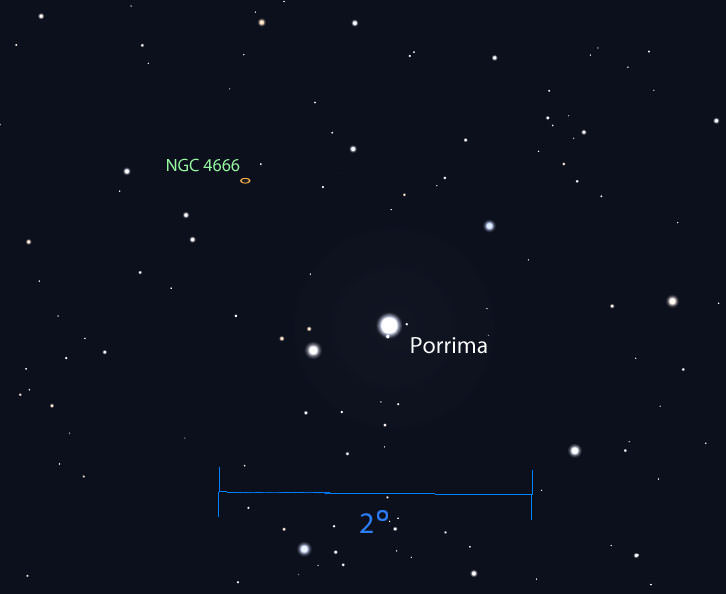
It’s known as HIP 85605, one of two stars that make up a binary in the Hercules constellation roughly 16 light years away. And if a recent research paper produced by Dr. Coryn Bailer-Jones of the Max Planck Institute for Astronomy in Heidelberg, Germany is correct, it is on a collision course with our Solar System.
Now for the good news: according to Bailer-Jones’ calculations, the star will pass by our Solar System at a distance of 0.04 parsecs, which is equivalent to 8,000 times the distance between the Earth and the Sun (8,000 AUs). In addition, this passage will not affect Earth or any other planet’s orbit around the Sun. And perhaps most importantly of all, none of it will be happening for another 240,000 to 470,000 years from now.
“Even though the galaxy contains very many stars,” Bailer-Jones told Universe Today via email, “the spaces between them are huge. So even over the (long) life of our galaxy so far, the probability of any two stars have actually collided — as opposed to just coming close — is extremely small.”
However, in astronomical terms, that still counts as a near-miss. In a universe that is 46 billion light years in any direction – and that’s just the observable part of it – an event that is expected to take place just 50 light days away is considered to be pretty close. And in the context of space and time, a quarter of a million to half a million years is the very near future.
The real concern is the effect that the passage of HIP 85605 could have on the Oort Cloud – the massive cloud of icy planetesimals that surrounds the Solar System. Given that it’s distance is between 20,000 and 50,000 AU from our Sun, HIP 85605 would actually move through the Oort cloud and cause serious disruption.

Many of these planetesimals could be blown off into space, but others could be sent hurtling towards Earth. Assuming humanity is still around at this point in time, this could present a bit of an inconvenience, even if it is spread over the course of a million years.
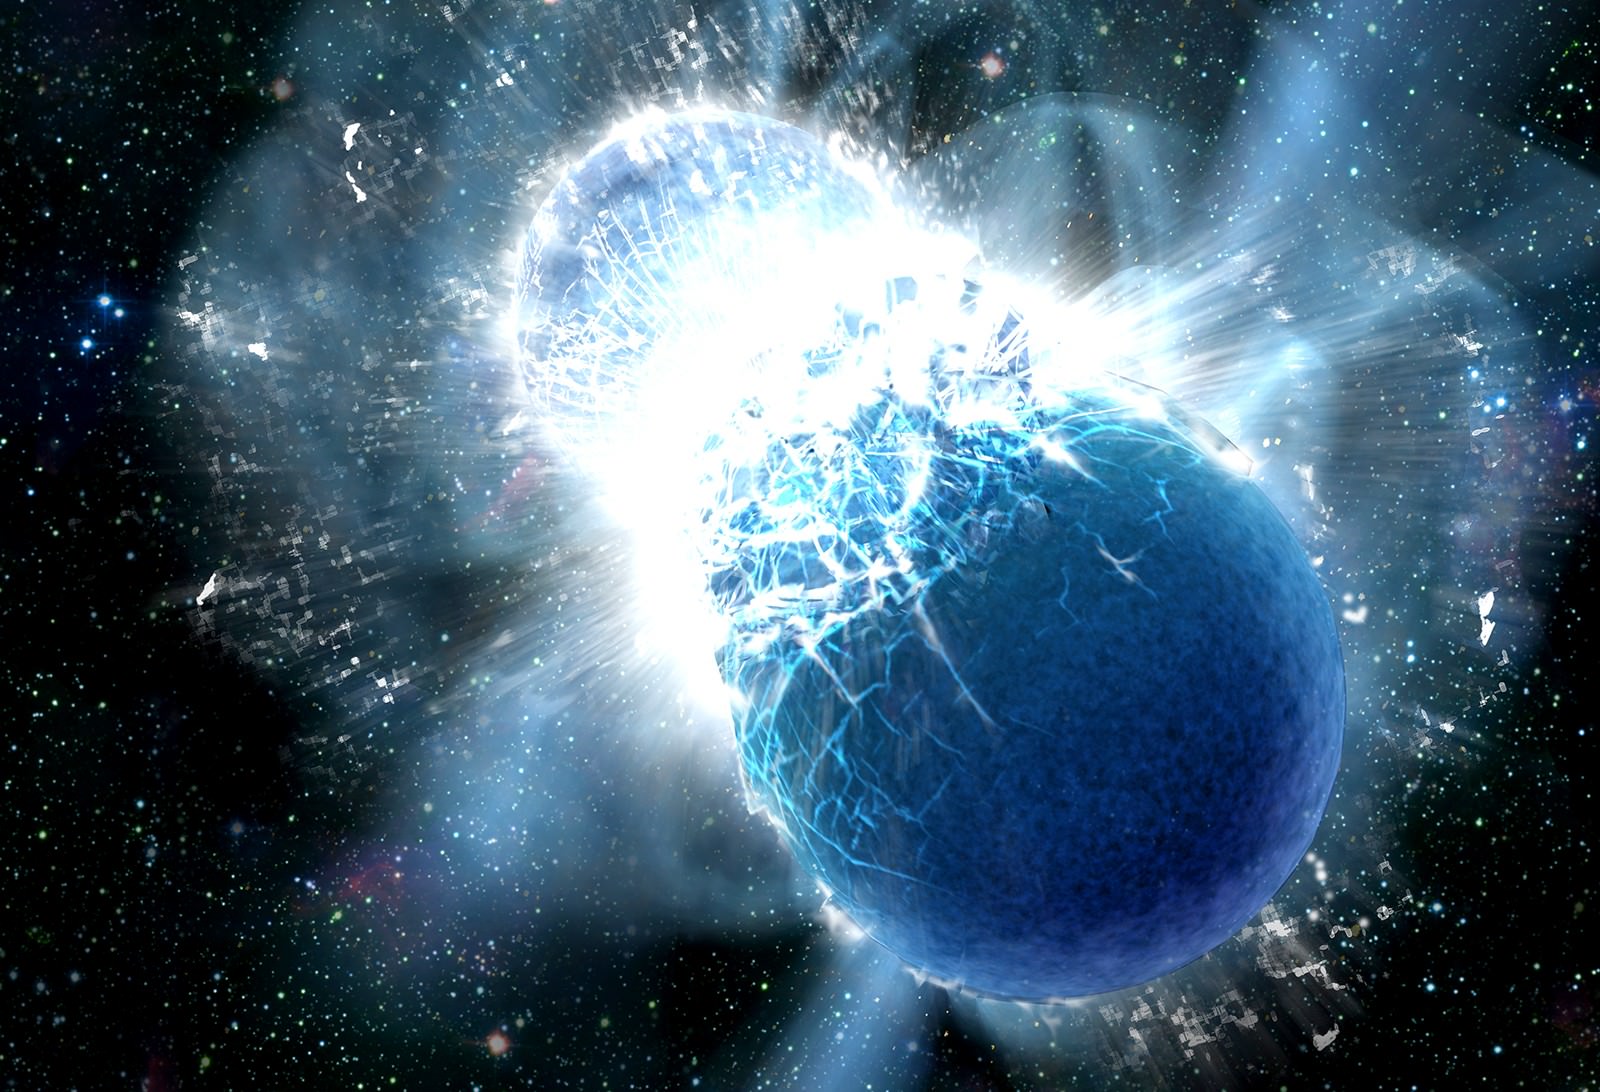
As it stands, such “close encounters” between stars are quite rare. Stellar collisions usually only occur within binaries, where white dwarfs or neutron stars are concerned. “The exception to this is physically bound binary stars in a tight orbit,” said Bailer-Jones. “It can and does happen that one star expands during its evolution and will then interfere with the evolution of the other star. Neutron-neutron star pairs can even merge.”
But of course, on an astronomical timescale, stars passing each other by as they perform their cosmic dance is actually a pretty common occurrence. As part of Bailer-Jones larger study of over 50,000 stars within our galaxy, this “close encounter” is one of several predicted to take place in the coming years.
Of all of them, only HIP 85605 is expected to come within a single parsec between 240 and 470 thousand years from now. He also indicates with (90% confidence) that the last time such an encounter took place was 3.8 million years ago when gamma Microscopii – a G7 giant which has two and a half times the mass of our Sun – came within 0.35-1.34 pc of our system, which may have caused a large perturbation in the Oort cloud.

On his MPIA webpage, in the study’s FAQ section, Bailer-Jones claims that his research into stellar close encounters was motivated by a desire to study the potential impacts of astronomical phenomena on Earth, and is part of a larger program named “astroimpacts”.
“I am interested in the history of the Earth,” he says, “and astronomical phenomena have clearly played a role in this. But what role precisely, how significant, and what can we expect to happen in the future?” Whereas several studies have been conducted in the past, he feels that the methods – which include assuming a linear relative motion of stars – produces inaccurate results.”
In contrast, Bailer-Jones study relies on “more recent data or re-analyses of data to produce hopefully more accurate results, and then compensate more rigorously for the uncertainties in the data, so that I can attach probabilities to my statements.”
As a result of this, he predicts that HIP 85605 has a 90% chance of passing within a single parsec of our Sun in the next 240 to 470 thousands years. However, he also admits that if the astronomy is incorrect, the next closest encounter won’t be happening for another 1.3 million years, when a K7 dwarf known as GL 710 is predicted to pass within 0.10 – 0.44 parsecs.
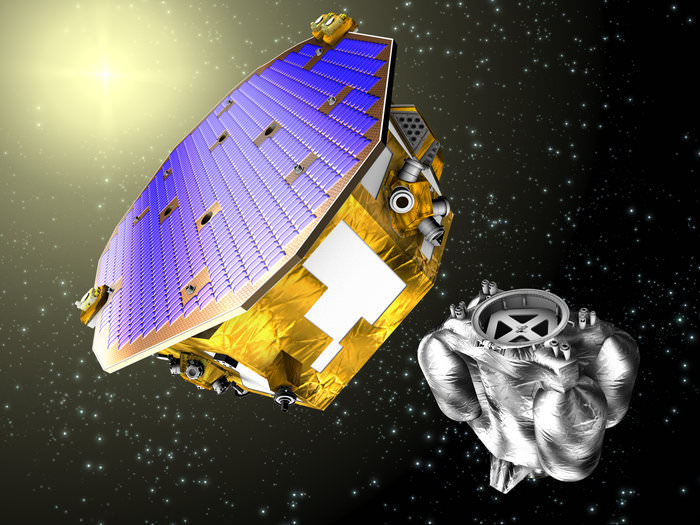
Bailer-Jones also believes that the European Space Agency’s Gaia spacecraft will help make more accurate predictions in the future. By understanding and mapping the environment of the Milky Way Galaxy, measuring the gravitational potential and determining the velocity of stars, scientists will be able to see how their various orbits around the galaxy’s center could cause them to intersect.
But perhaps the most interesting question explored on his webpage is the possibility of using stellar close encounters as a shortcut for exploring exoplanets. According to current cosmological models, the majority of stars within our galaxy are believed to host exoplanets.
So if a star is passing us at just a few parsecs (or even with a single parsec) why not hop on over and investigate its planets? Well, as Bailer-Jones indicates, that’s not really a practical idea: “Traveling to a star passing our solar system at a distance of around 1 pc with a relative speed of 30 km/s is no easier than traveling the the nearby stars (the nearest of which is just over 1 pc away). And we would have to wait 10s of thousands of years for the next encounter. If we can ever achieve interstellar travel, I don’t suppose it would take that long to achieve, so why wait?”
Darn. Still, if there’s one thing this phenomena and Bailer-Jones study reminds us, it is that in the course of dancing around the center of the Milky Way, stars are not fixed in a single point in space. Not only do they periodically move within reach of each other, they can also have an affect on life within them.
Alas, the timescale on which such things happen, not to mention the consequences they entail, are so large that people here on Earth need not worry. By the time HIP 85605 or GL 710 come within a parsec or two of us, we’ll either be long-since dead or too highly evolved to care!
*Update: According to a new study posted by Erick E. Mamajek and associates on arXiv, the passage of the recently-discovered low mass star W0720 (aka. “Scholtz Star”) – roughly 70,000 years ago and at a distance of 0.25 Parsecs from our Sun – was the closest encounter our Solar System has had with another star. They calculate the possibility that it would have penetrated the System’s Outer Oort Cloud at 98%. However, they also estimate that the impact it would have had on the flux of long-period comets was negligible, but that the passage also highlights how “dynamically important Oort Cloud perturbers may be lurking among nearby stars”.
Having read the study, Bailer-Jones claims on the updated FAQ section of his MPIA webpage that their analysis appears to be correct. Based on the assumption that the star was moving on a constant velocity relative to the Sun prior to the encounter, he agrees that the calculations on the distances and timing of the passage are valid. While his own study identified a possible closer encounter (Hip 85605), he reiterates that the data on this star is of poor quality. Meanwhile, another close encounter took place involving Hip 89825; but here, the approach distance is estimated to have been 0.02 Parsecs larger. Hence, W0720 can be said to have been the closest encounter with some degree of certainty at this time.
The study appeared on Feb. 16th at arXiv Astrophysics.
Further Reading: arXiv Astrophysics, Max Planck Institute of Astronomy