The Origins of Life Could Indeed Be “Interstellar”

This image shows a star-forming region in interstellar space. A new study used AI and radiotelescope data to find 140,000 regions in the Milky Way that will eventually form stars like this region. Image credit: NASA, ESA and the Hubble Heritage (STScI/AURA)-ESA/Hubble Collaboration

Some of science’s most pressing questions involve the origins of life on Earth. How did the first lifeforms emerge from the seemingly hostile conditions that plagued our planet for much of its history? What enabled the leap from simple, unicellular organisms to more complex organisms consisting of many cells working together to metabolize, respire, and reproduce? In such an unfamiliar environment, how does one even separate “life” from non-life in the first place?

Now, scientists at the University of Hawaii at Manoa believe that they may have an answer to at least one of those questions. According to the team, a vital cellular building block called glycerol may have first originated via chemical reactions deep in interstellar space.

Glycerol is an organic molecule that is present in the cell membranes of all living things. In animal cells this membrane takes the form of a phospholipid bilayer, a dual-layer membrane that sandwiches water-repelling fatty acids between outer and inner sheets of water-soluble molecules. This type of membrane allows the cell’s inner aqueous environment to remain separate and protected from its external, similarly watery world. Glycerol is a vital component of each phospholipid because it forms the backbone between the molecule’s two characteristic parts: a polar, water-soluble head, and a non-polar, fatty tail.

Many scientists believe that cell membranes such as these were a necessary prerequisite to the evolution of multicellular life on Earth; however, their complex structure requires a very specific environment – namely, one low in calcium and magnesium salts with a fairly neutral pH and stable temperature. These carefully balanced conditions would have been hard to come by on the prehistoric Earth.

Icy bodies born in interstellar space offer an alternative scenario. Scientists have already discovered organic molecules such as amino acids and lipid precursors in the Murchison meteorite that landed in Australia in 1969. Although the idea remains controversial, it is possible that glycerol could have been brought to Earth in a similar manner.
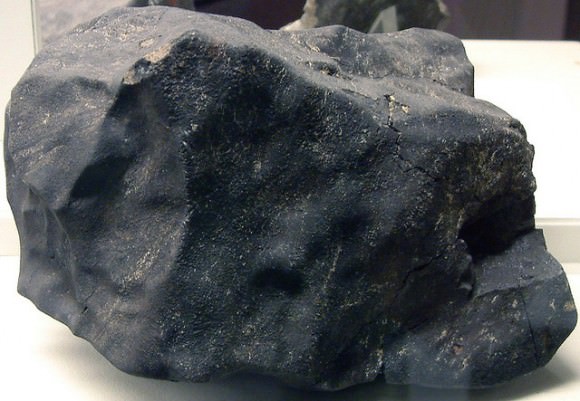
The Murchison Meteorite. Image credit: James St. John
The Murchison Meteorite.
Image credit: James St. John

Meteors typically form from tiny crumbs of material in cold molecular clouds, regions of gaseous hydrogen and interstellar dust that serve as the birthplace of stars and planetary systems. As they move through the cloud, these grains accumulate layers of frozen water, methanol, carbon dioxide, and carbon monoxide. Over time, high-energy ultraviolet radiation and cosmic rays bombard the icy fragments and cause chemical reactions that enrich their frozen cores with organic compounds. Later, as stars form and ambient material falls into orbit around them, the ices and the organic molecules they contain are incorporated into larger rocky bodies such as meteors. The meteors can then crash into planets like ours, potentially seeding them with building blocks of life.

In order to test whether or not glycerol could be created by the high-energy radiation that typically bombards interstellar ice grains, the team at the University of Hawaii designed their own meteorites: small bits of icy methanol cooled to 5 degrees Kelvin. After blasting their model ices with energetic electrons meant to mimic the effects of cosmic rays, the scientists found that some molecules of methanol within the ices did, in fact, transform into glycerol.

While this experiment appears to be a success, scientists realize that their laboratory models do not exactly replicate conditions in interstellar space. For instance, methanol traditionally makes up only about 30% of the ice in space rocks. Future work will investigate the effects of high-energy radiation on model ices made primarily of water. High-energy electrons fired in a lab are also not a perfect substitute for true cosmic rays and do not represent effects on ice that may result from ultraviolet radiation in interstellar space.

More research is necessary before scientists can draw any global conclusions; however, this study and its predecessors do provide compelling evidence that life as we know it truly could have come from above.

How Do Planets Form? Semarkona Meteorite Shows Some Clues

Artist’s impression of a baby star still surrounded by a protoplanetary disc in which planets are forming. Credit: ESO

It may seem all but impossible to determine how the Solar System formed, given that it happened roughly 4.5 billion years ago. Luckily, much of the debris that was left over from the formation process is still available today for study, circling our Solar System in the form of rocks and debris that sometimes make their way to Earth.

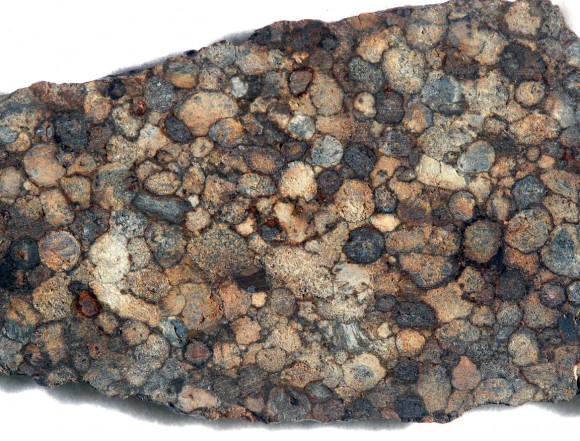
Among the most useful pieces of debris are the oldest and least altered type of meteorites, which are known as chondrites. They are built mostly of small stony grains, called chondrules, that are barely a millimeter in diameter.

And now, scientists are being provided with important clues as to how the early Solar System evolved, thanks to new research based on the the most accurate laboratory measurements ever made of the magnetic fields trapped within these tiny grains.

To break it down, chondrite meteorites are pieces of asteroids — broken off by collisions — that have remained relatively unmodified since they formed during the birth of the Solar System. The chondrules they contain were formed when patches of solar nebula – dust clouds that surround young suns – was heated above the melting point of rock for hours or even days.

The dust caught in these “melting events” was melted down into droplets of molten rock, which then cooled and crystallized into chondrules. As chondrules cooled, iron-bearing minerals within them became magnetized by the local magnetic field in the gas cloud. These magnetic fields are preserved in the chondrules right on up to the present day.

A slice of the NWA 5205 meteorite from the Sahara Desert displays wall-to-wall chondrules. Credit: Bob King

The chondrule grains whose magnetic fields were mapped in the new study came from a meteorite named Semarkona – named after the town in India where it fell in 1940.

Roger Fu of MIT – working under Benjamin Weiss – was the chief author of the study; with Steve Desch of Arizona State University’s School of Earth and Space Exploration attached as co-author.

According to the study, which was published this week in Science, the measurements they collected point to shock waves traveling through the cloud of dusty gas around the newborn sun as a major factor in solar system formation.

“The measurements made by Fu and Weiss are astounding and unprecedented,” says Steve Desch. “Not only have they measured tiny magnetic fields thousands of times weaker than a compass feels, they have mapped the magnetic fields’ variation recorded by the meteorite, millimeter by millimeter.”

The scientists focused specifically on the embedded magnetic fields captured by “dusty” olivine grains that contain abundant iron-bearing minerals. These had a magnetic field of about 54 microtesla, similar to the magnetic field at Earth’s surface (which ranges from 25 to 65 microtesla).

Coincidentally, many previous measurements of meteorites also implied similar field strengths. But it is now understood that those measurements detected magnetic minerals that were contaminated by the Earth’s own magnetic field, or even from the hand magnets used by the meteorite collectors.

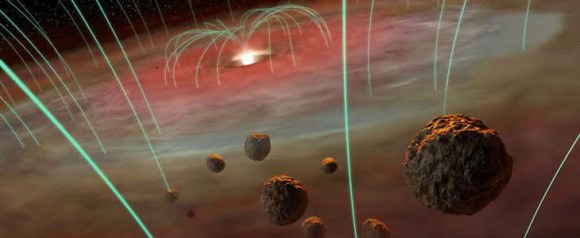
Artist depiction of a protoplanetary disk permeated by magnetic fields. Objects in the foregrounds are millimeter-sized rock pellets known as chondrules.  Credit: Hernán Cañellas
Artist depiction of a protoplanetary disk permeated by magnetic fields. Objects in the foregrounds are millimeter-sized rock pellets known as chondrules.
Credit: Hernán Cañellas

“The new experiments,” Desch says, “probe magnetic minerals in chondrules never measured before. They also show that each chondrule is magnetized like a little bar magnet, but with ‘north’ pointing in random directions.”

This shows, he says, that they became magnetized before they were built into the meteorite, and not while sitting on Earth’s surface. This observation, combined with the presence of shock waves during early solar formation, paints an interesting picture of the early history of our Solar System.

“My modeling for the heating events shows that shock waves passing through the solar nebula is what melted most chondrules,” Desch explains. Depending on the strength and size of the shock wave, the background magnetic field could be amplified by up to 30 times. “Given the measured magnetic field strength of about 54 microtesla,” he added, “this shows the background field in the nebula was probably in the range of 5 to 50 microtesla.”

There are other ideas for how chondrules might have formed, some involving magnetic flares above the solar nebula, or passage through the sun’s magnetic field. But those mechanisms require stronger magnetic fields than what has been measured in the Semarkona samples.

This reinforces the idea that shocks melted the chondrules in the solar nebula at about the location of today’s asteroid belt, which lies some two to four times farther from the sun than the Earth’s orbits.

Desch says, “This is the first really accurate and reliable measurement of the magnetic field in the gas from which our planets formed.”

Further Reading: ASU

We are not Alone: Government Sensors Shed New Light on Asteroid Hazards

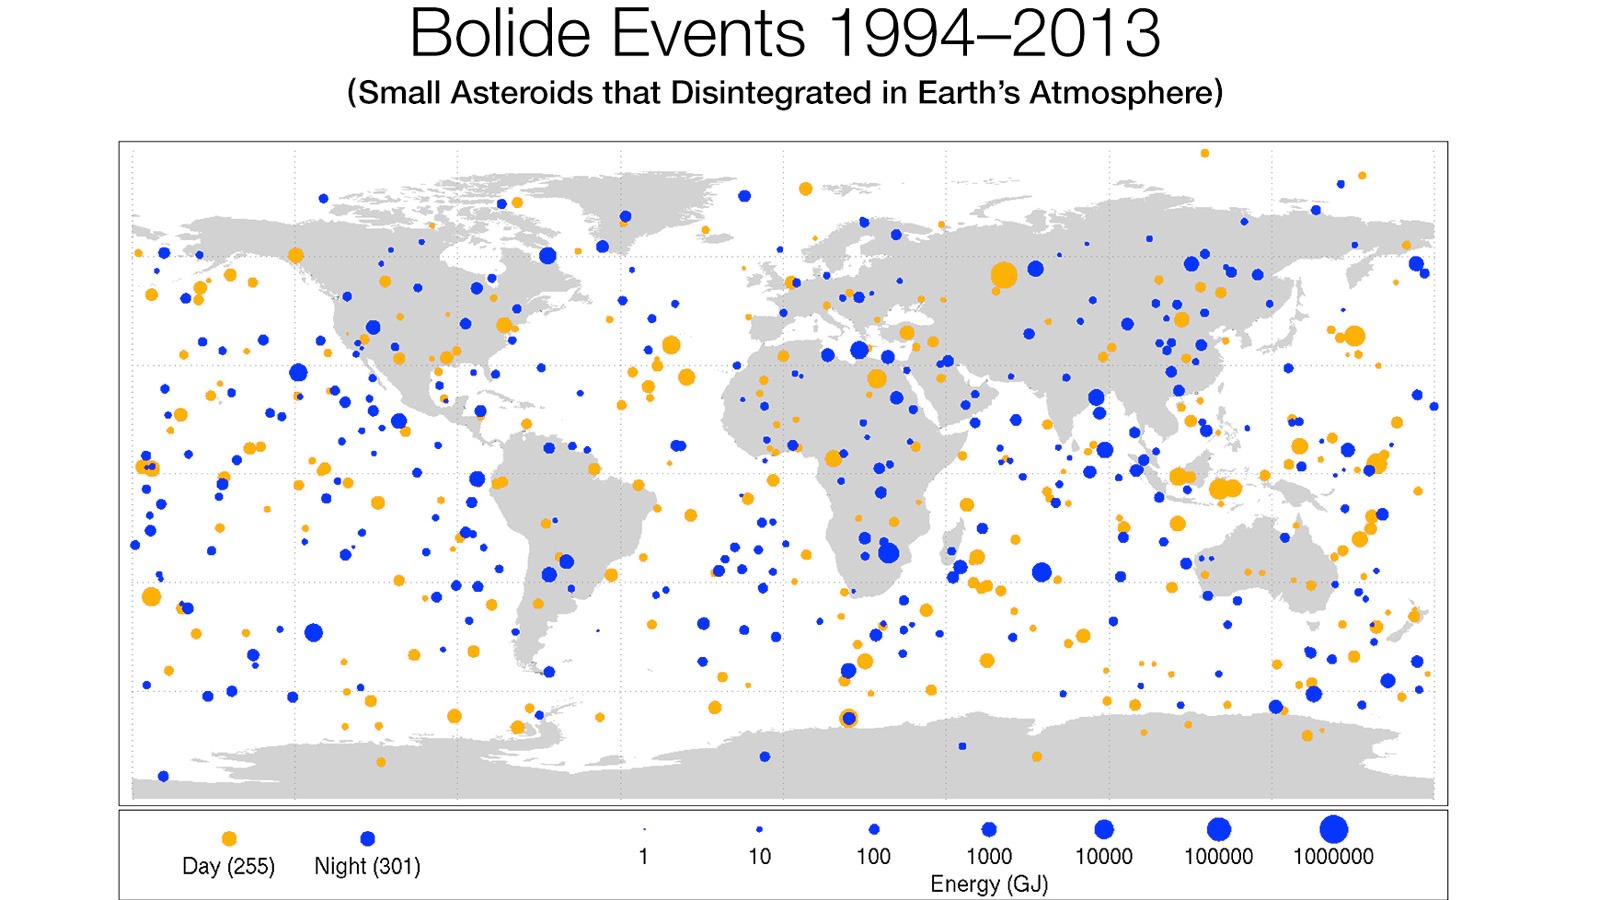
This diagram maps data gathered from 1994-2013 on small asteroids impacting Earth's atmosphere to create very bright meteors (bolides). The location of impacts from objects ranging from 1 meter (3 feet) to nearly 20 meters (60 feet) in size such as Chelyabinsk asteroid are shown globally. (Credit: Planetary Science, NASA)

How hazardous are the thousands and millions of asteroids that surround the third rock from the Sun – Earth? Since an asteroid impact represents a real risk to life and property, this is a question that has been begging for answers for decades. But now, scientists at NASA’s Jet Propulsion Laboratory have received data from a variety of US Department of Defense assets and plotted a startling set of data spanning 20 years.

This latest compilation of data underscores how frequent some of these larger fireballs are, with the largest being the Chelyabinsk event on February 15, 2013 which injured thousands in Russia. The new data will improve our understanding of the frequency and presence of small and large asteroids that are hazards to populated areas anywhere on Earth.

On Feb. 28, 2009, Peter Jenniskens (SETI/NASA), finds his first 2008TC3 meteorite after an 18-mile long journey. "It was an incredible feeling," Jenniskens said. The African Nubian Desert meteorite of Oct 7, 2008 was the first asteroid whose impact with Earth was predicted while still in space approaching Earth. 2008TC3 and Chelyabinsk are part of the released data set. (Credit: NASA/SETI/P.Jenniskens)
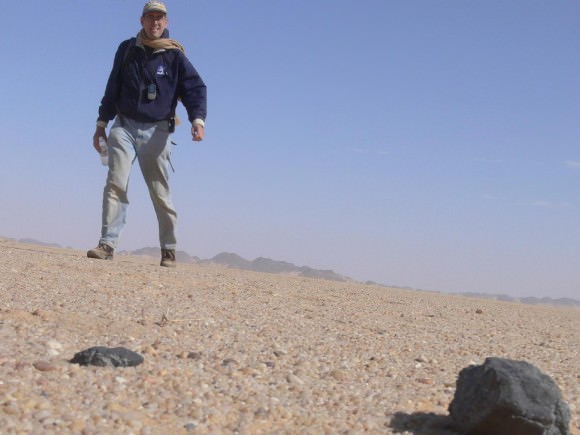
On Feb. 28, 2009, Peter Jenniskens (SETI/NASA), finds his first 2008TC3 meteorite after an 18-mile long journey. “It was an incredible feeling,” Jenniskens said. The meteorite which impacted in the Nubian Desert of Africa on Oct 7, 2008 was the first asteroid whose impact with Earth was predicted while still in space approaching Earth. Meteorite 2008TC3 and Chelyabinsk’s are part of the released data set. (Credit: NASA/SETI/P.Jenniskens)

The data from “government sensors” – meaning “early warning” satellites to monitor missile launches (from potential enemies) as well as infrasound ground monitors – shows the distribution of bolide (fireball) events. The data first shows how uniformly distributed the events are around the world. This data is now released to the public and researchers for more detailed analysis.

The newest data released by the US government shows both how frequent bolides are and also how effectively the Earth’s atmosphere protects the surface. A subset of this data had been analyzed and reported by Dr. Peter Brown from the University of Western Ontario, Canada and his team in 2013 but included only 58 events. This new data set holds 556 events.

The newly released data also shows how the Earth’s atmosphere is a superior barrier that prevents small asteroids’ penetration and impact onto the Earth’s surface. Even the 20 meter (65 ft) Chelyabinsk asteroid exploded mid-air, dissipating the power of a nuclear blast 29.7 km (18.4 miles, 97,400 feet) above the surface. Otherwise, this asteroid could have obliterated much of a modern city; Chelyabinsk was also saved due to sheer luck – the asteroid entered at a shallow angle leading to its demise; more steeply, and it would have exploded much closer to the surface. While many do explode in the upper atmosphere, a broad strewn field of small fragments often occurs. In historical times, towns and villages have reported being pelted by such sprays of stones from the sky.

NASA and JPL emphasized that investment in early detection of asteroids has increased 10 fold in the last 5 years. Researchers such as Dr. Jenniskens at the SETI Institute has developed a network of all-sky cameras that have determined the orbits of over 175,000 meteors that burned up in the atmosphere. And the B612 Foundation has been the strongest advocate of discovering of all hazardous asteroids. B612, led by former astronauts Ed Lu and Rusty Schweikert has designed a space telescope called Sentinel which would find hazardous asteroids and help safeguard Earth for centuries into the future.

Speed is everything. While Chelyabinsk had just 1/10th the mass of Nimitz-class super carrier, it traveled 1000 times faster. Its kinetic energy on account of its speed was 20 to 30 times that released by the nuclear weapons used to end the war against Japan – about 320 to 480 kilotons of TNT. Briefly, asteroids are considered to be any space rock larger than 1 meter and those smaller are called meteoroids.

Two earlier surveys can be compared to this new data. One by Eugene Shoemaker in the 1960s and another by Dr. Brown. The initial work by Shoemaker using lunar crater counts and the more recent work of Dr. Brown’s group, utilizing sensors of the Department of Defense, determined estimates of the frequency of asteroid impacts (bolide) rates versus the size of the small bodies. Those two surveys differ by a factor of ten, that is, where Shoemaker’s shows frequencies on the order of 10s or 100s years, Brown’s is on the order of 100s and 1000s of years. The most recent data, which has adjusted Brown’s earlier work is now raising the frequency of hazardous events to that of the work of Shoemaker.

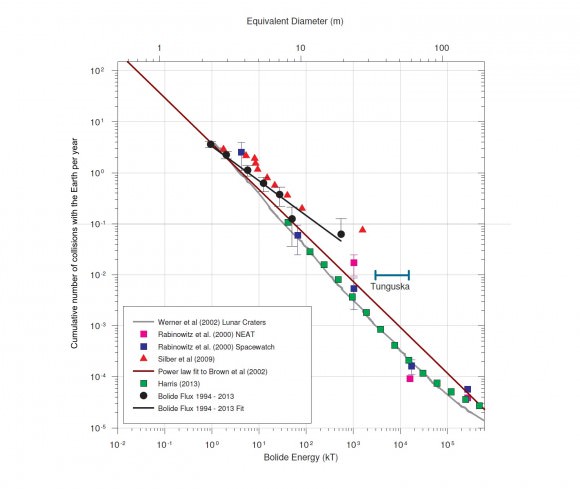
The work of Dr. Brown and co-investigators led to the following graph showing the frequency of collisions with the Earth of asteroids of various sizes. This plot from a Letter to Nature by P. Brown et al. used 58 bolides from data accumulated from 1994 to 2014 from government sensors. Brown and others will improve their analysis with this more detailed dataset. The plot shows that a Chelyabinsk type event can be expected approximately every 30 years though the uncertainty is high. The new data may reduce this uncertainty. Tungunska events which could destroy a metropolitan area the size of Washington DC occur less frequently – about once a century.

The estimated cumulative flux of impactors at the Earth. The bolide impactor flux at Earth (Bolide flux 1994-2013 - black circles) based on ~20 years of global observations from US Government sensors and infrasound airwave data. Global coverage averages 80% among a total of 58 observed bolides with E > 1 kt and includes the Chelyabinsk Chelyabinsk bolide (far right black circle). This coverage correction is approximate and the bolide flux curve is likely a lower limit. The full caption is at bottom. (Credit: P. Brown, Letter to Nature, 2013, Figure 3)
The estimated cumulative flux of impactors at the Earth. The bolide impactor flux at Earth (Bolide flux 1994-2013 – black circles) based on ~20 years of global observations from US Government sensors and infrasound airwave data. Global coverage averages 80% among a total of 58 observed bolides with E > 1 kt and includes the Chelyabinsk Chelyabinsk bolide (far right black circle). This coverage correction is approximate and the bolide flux curve is likely a lower limit. The full caption is at bottom. (Credit: P. Brown, Letter to Nature, 2013, Figure 3)

Asteroids come in all sizes. Smaller asteroids are much more common, larger ones less so. A common distribution seen in nature is represented by a bell curve or “normal” distribution. Fortunately the bigger asteroids number in the hundreds while the small “city busters” count in the 100s of thousands, if not millions. And fortunately, the Earth is small in proportion to the volume of space even just the space occupied by our Solar System. Additionally, 69% of the Earth’s surface is covered by Oceans. Humans huddle on only about 10% of the surface area of the Earth. This reduces the chances of any asteroid impact effecting a populated area by a factor of ten.

Altogether the risk from asteroids is very real as the Chelyabinsk event underscored. Since the time of Tugunska impact in Siberia in 1908, the human population has quadrupled. The number of cities of over 1 million has increased from 12 to 400. Realizing how many and how frequent these asteroid impacts occur plus the growth of the human population in the last one hundred years raises the urgency for a near-Earth asteroid discovery telescope such as B612’s Sentinel which could find all hazardous objects in less than 10 years whereas ground-based observations will take 100 years or more.

Reference:
New Map Shows Frequency of Small Asteroid Impacts, Provides Clues on Larger Asteroid Population

Full Caption of the included plot from LETTERS TO NATURE, The Chelyabinsk airburst : Implications for the Impact Hazard, P.G. Brown, et al.

The estimated cumulative flux of impactors at the Earth. The bolide impactor flux at Earth (Bolide flux 1994-2013 – black circles) based on ~20 years of global observations from US Government sensors and infrasound airwave data. Global coverage averages 80% among a total of 58 observed bolides with E > 1 kt and includes the Chelyabinsk Chelyabinsk bolide (far right black circle). This coverage correction is approximate and the bolide flux curve is likely a lower limit. The brown-coloured line represents an earlier powerlaw fit from a smaller dataset for bolides between 1 – 8 m in diameter15. Error bars represent counting statistics only. For comparison, we plot de-biased estimates of the near-Earth asteroid impact frequency based on all asteroid survey telescopic search data through mid- 2012 (green squares)8 and other earlier independently analysed telescopic datasets including NEAT discoveries (pink squares) and finally from the Spacewatch (blue squares) survey, where diameters are determined assuming an albedo of 0.1. Energy for telescopic data is computed assuming a mean bulk density of 3000 kgm-3 and average impact velocity of 20.3 kms-1. The intrinsic impact frequency for these telescopic data was found using an average probability of impact for NEAs as 2×10⁻⁹ per year for the entire population. Lunar crater counts converted to equivalent impactor flux and assuming a geometric albedo of 0.25 (grey solid line) are shown for comparison9, though we note that contamination by secondary craters and modern estimates of the NEA population which suggest lower albedos will tend to shift this curve to the right and down. Finally, we show estimated influx from global airwave measurements conducted from 1960-1974 which detected larger (5-20m) bolide impactors (upward red triangles) using an improved method for energy estimation compared to earlier interpretations of these same data.

Chaotic Wombs May Birth Wrong-way Planets

Turbulent somethings lead to something. Image Credit: Vob

We’ve heard it time and time again. When it comes to new exoplanet findings, our conventional wisdom never holds. So the surprise that a batch of extrasolar planets are moving retrograde, orbiting in directions opposite to the way their stars are spinning, shouldn’t come as a surprise.

Then again, maybe it should. These discoveries turned the long-standing view of how planets form on its head. Now Eduard Vorobyov at the University of Vienna and colleagues argue that chaotic conditions in the planetary system’s gaseous wombs may be to blame.

Theorists have long assumed that stars and their planetary companions assemble from spinning disks of gas and dust. This causes the star to spin in one direction, while its planetary companions follow suit. “In some fundamental sense, the cloud carries a ‘genetic code’ that obligates the formation of corotating stars and planets,” Vorobyov told Universe Today.

So how do these wrong-way exoplanets get out of whack? Some theorists have postulated that the gravitational tugs from neighbors might change their direction of rotation. But this is pretty difficult for massive planets.

So Vorobyov and his colleagues took a second look at the initial clouds in which stars and their corotating planets form. Initially, astronomers thought that clouds evolve in relative isolation. Recent simulations, however, suggest that “clouds form within a turbulent environment and move like bees in a hive from one place to another,” said Vorobyov.

So a moving cloud might end up in an environment that’s quite different from the one it had at birth. It could even find itself surrounded by gas that’s swirling opposite to its spin.

Vorobyov and colleagues ran simulations that place clouds into environments with various characteristics. Sure enough when a gas cloud is surrounded by gas that’s swirling in the opposite direction, the inner disk continues to rotate in the same direction of the star, but the outer disk flips and starts to rotate in the opposite direction.

Over time, grains glom together in both disks until they ultimately form planets. Any inner planets will rotate with the star and any outer planets will rotate opposite the star.

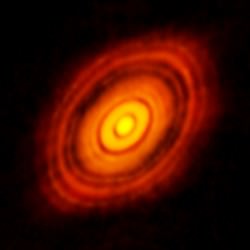
ALMA image of the protoplanetary disc around HL Tauri
ALMA image of the protoplanetary disc around HL Tauri. Image Credit: ALMA / ESO / NOAJ / NRAO / NSF

But there are a few interesting byproducts. The first is that there’s a gap between the two counter-rotating disks. So whenever we see gaps in protoplanetary disks (like the one ALMA spotted a few weeks ago), these gaps might not be the result of a forming planet, but instead a null space between two counter-rotating disks.

The second is that the outer disk produces shock waves, which can trigger early planet formation. “The idea that planets would naturally form in the first very short (100,000 to 400,000 years) lifetime of the protostar would be profound, even if some of the planets were later destroyed,” expert Joel Green from the University of Texas told Universe Today.

This stands in contrast to the idea that planets collect their mass from collisions. It’s a process that astronomers think takes millions of years. But Green isn’t completely convinced by the simulations just yet as there seems to be no physical reason for the outer disks to end up counter rotating.

It all really comes down to the question of nature vs. nurture. “In some philosophical sense, the nurture (external environment) may completely change the nature of planet-forming disks,” said Vorobyov.

The results will be published in Astronomy & Astrophysics and are available online.

Curiosity Rover Snaps Photos of Comet Siding Spring, Giant Sunspot and Mars-shine

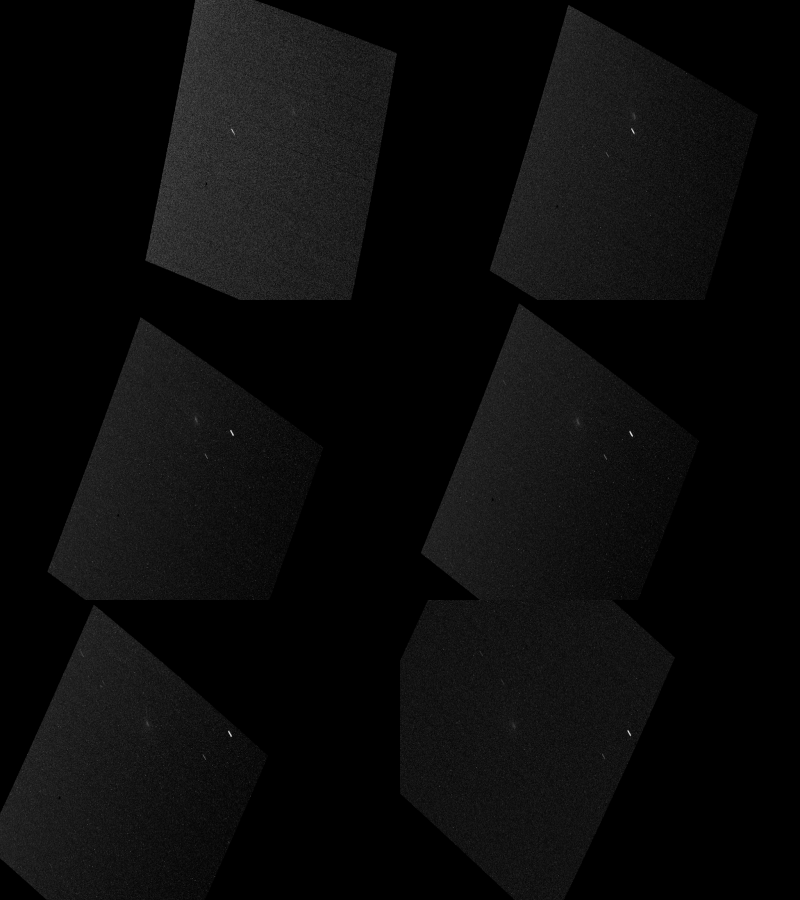
It's not much, but it's the clearest view taken by NASA's Curiosity Rover of C/2013 A1 Siding Spring as it passed near Mars on October 19th. The comet is the fuzzy streak moving from right to left. Click for a full-sized view. Credit: NASA/JPL-Caltech/MSSS/TAMU

NASA’s Curiosity Rover spends most of its time staring at the ground, but like humans, it looks up once in a while too. As reported earlier, NASA ground controllers pointed the rover’s Mast Camera (mastcam) skyward to shoot a series of photos of Comet Siding Spring when it passed closest to the Red Planet on October 19th.  Until recently, noise-speckled pictures available on the raw image site confounded interpretation. Was the comet there or wasn’t it?  In these recently released versions, the fuzzy intruder is plain to see, tracking from right to left across the field of view. 

Remember the monster sunspot group on bold display during last month's partial solar eclipse. It was the largest group of the current solar cycle. Here it is again - returning for a second time - as seen by Curiosity on November 10th. Credit: NASA/JPL-Caltech
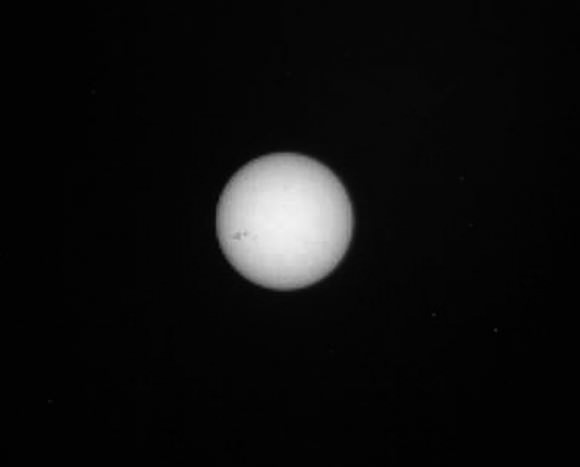
Remember the monster sunspot group on bold display during last month’s partial solar eclipse? It was the largest group of the current solar cycle and largest recorded in 24 years. Here it is again (lower left) – returning for a second time – as seen by Curiosity on November 10th. Click for raw version. Credit: NASA/JPL-Caltech

Ten exposures of 25 seconds each were taken between 4:33 p.m. and 5:54 p.m. CDT on October 19th to create the animation.  The few specks you see are electronic noise, but the sharp, bright streaks are stars that trailed during the time exposure. Curiosity’s Mastcam camera system has dual lenses –  a 100mm f/10 lens with a 5.1° square field of view and a 34mm, f/8 lens with a 15° square field of view. NASA didn’t include the information about which camera was used to make the photos, but if I had to guess, the faster, wide-angle view would be my choice. Siding Spring was moving relatively quickly across the Martian sky at closest approach.

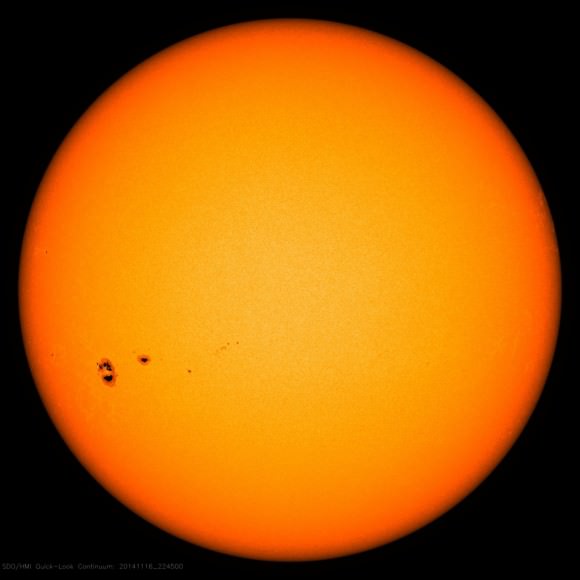
Sunspot region 2192 (lower left) has returned for an encore in this photo taken by NASA's Solar Dynamics Observatory. The same group is visible in images taken 4 days earlier from Mars. Credit: NASA/SDO
Sunspot region 2192 (lower left) has returned for an encore in this photo taken by NASA’s Solar Dynamics Observatory. The same group is visible in images taken 4 days earlier from Mars. Credit: NASA/SDO

Prowling through the Curiosity raw image files, I came across this photo of the Sun on November 10th. Three dark spots at the left are immediately obvious and a dead-ringer for Active Region 2192, now re-named 2209 as it rounds the Sun for Act II.  You’ll recall this was the sunspot group that nearly stole the show during the October 23rd partial solar eclipse. From Mars’ perspective, which currently allows Curiosity to see further around the solar “backside”, AR 2209 showed up a few days before it was visible from Earth.

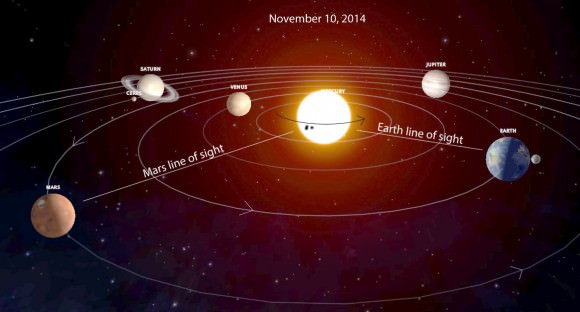
Mars Earth line of sight nov 10 final V2
Because of Mars’ position relative to the Sun, Curiosity saw the return of sunspot group 2192 before it was visible from Earth. The Sun had to rotate about another 4 days to carry the group into Earth’s line of sight. Source: Solarsystemscope with additions by the author

Although it’s slimmed down in size, the region is still large enough to view with the naked eye through a safe solar filter. More importantly, it possesses a complex beta-gamma-delta magnetic field where magnetic north and south poles are in close proximity and ripe for reconnection and production of M-class and X-class flares. Already, the region’s crackled with three moderate M-class flares over the past two days. In no mood to take a back seat, AR 2209 continues to dominate solar activity even during round two.

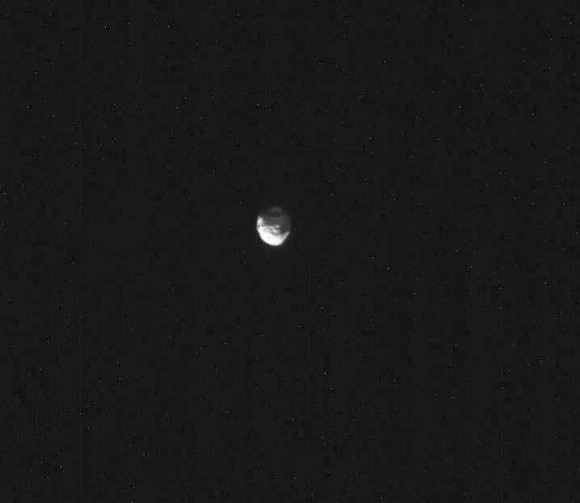
Phobos is very small but big enough for someone on the surface to see its shape with the naked eye, especially when the moon is high in the sky and closest to the observer. Then, it spans 1/3 the diameter of our Moon. Credit: NASA/JPL-Caltech
Phobos is very small but orbits close enough for someone on the surface to see its shape with the naked eye, especially when it’s high in the sky and closest to the observer. Phobos is about 1/3 the size of our Moon. This photo was taken by Curiosity on October 20th and shows the moon’s largest crater, Stickney, at top.  Credit: NASA/JPL-Caltech with toning by the author to bring out details

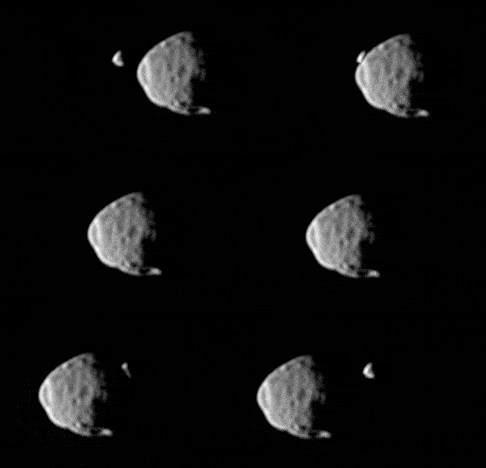
Mars possesses two small moons, Deimos and Phobos. Curiosity has photographed them both before including an occultation Deimos (9 miles/15 km) by the larger Phobos (13.5 miles/22 km). Phobos orbits closer to Mars than any other moon does to its primary in the Solar System, just 3,700 miles (6,000 km). As a result, it moves too fast for Mars’ rotation to overtake it the way Earth’s rotation overtakes the slower-moving Moon, causing it to set in the west overnight. Contrarian Phobos rises in the western sky and sets in the east just 4 hours 15 minutes later. When nearest the horizon and farthest from an observer, it’s apparent size is just 0.14º. At the zenith it grows to 0.20º of 1/3 the diameter of the Moon.

Phobos occults Deimos in real time photographed by the Curiosity Rover on August 1, 2013. Credit: NASA/JPL-Caltech

One longish observing session on the planet would cover a complete rise-set cycle during which Phobos would first appear as a crescent and finish up a full moon a few hours later. All this talk about Phobos is only meant to direct you to the picture above taken by Curiosity on October 20, 2014 when the moon was a thick crescent. As on Earth, where Earthshine fills out the remainder of the crescent Moon, so too does Mars-shine provide enough illumination to see the full outline of Phobos.

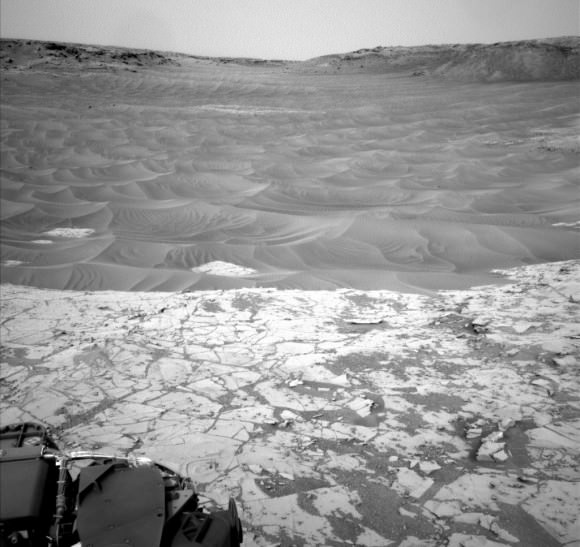
Four-wheel drive only. Curiosity took this photo showing a sea of dark dune from the Pahrump Hills outcrop on November 13th. Credit: NASA/JPL-Caltech
Four-wheel drive only! Curiosity took this photo showing a sea of dark dunes from the Pahrump Hills outcrop on November 13th. Credit: NASA/JPL-Caltech

Curiosity has also photographed Earth, sunsets and transits of Phobos across the Sun while rambling across the dusty red landscape since August 2012. Before we depart, it seems only fair to aim our gaze Mars-ward again to see what’s up. Or down. The rover’s been doing a geological “Walkabout” in the Pahrump Hills outcrop at the base of Mt. Sharp in Gale Crater since September. Earlier this fall it drilled and sampled rock there containing more hematite than at any of its previous stops. Hematite is an iron oxide that’s often associated with water.

The mission may spend weeks or months at the outcrop looking for and drilling new target rocks before moving further up the geological layer cake better known as Mt. Sharp.

Whittling Away At SN1987A

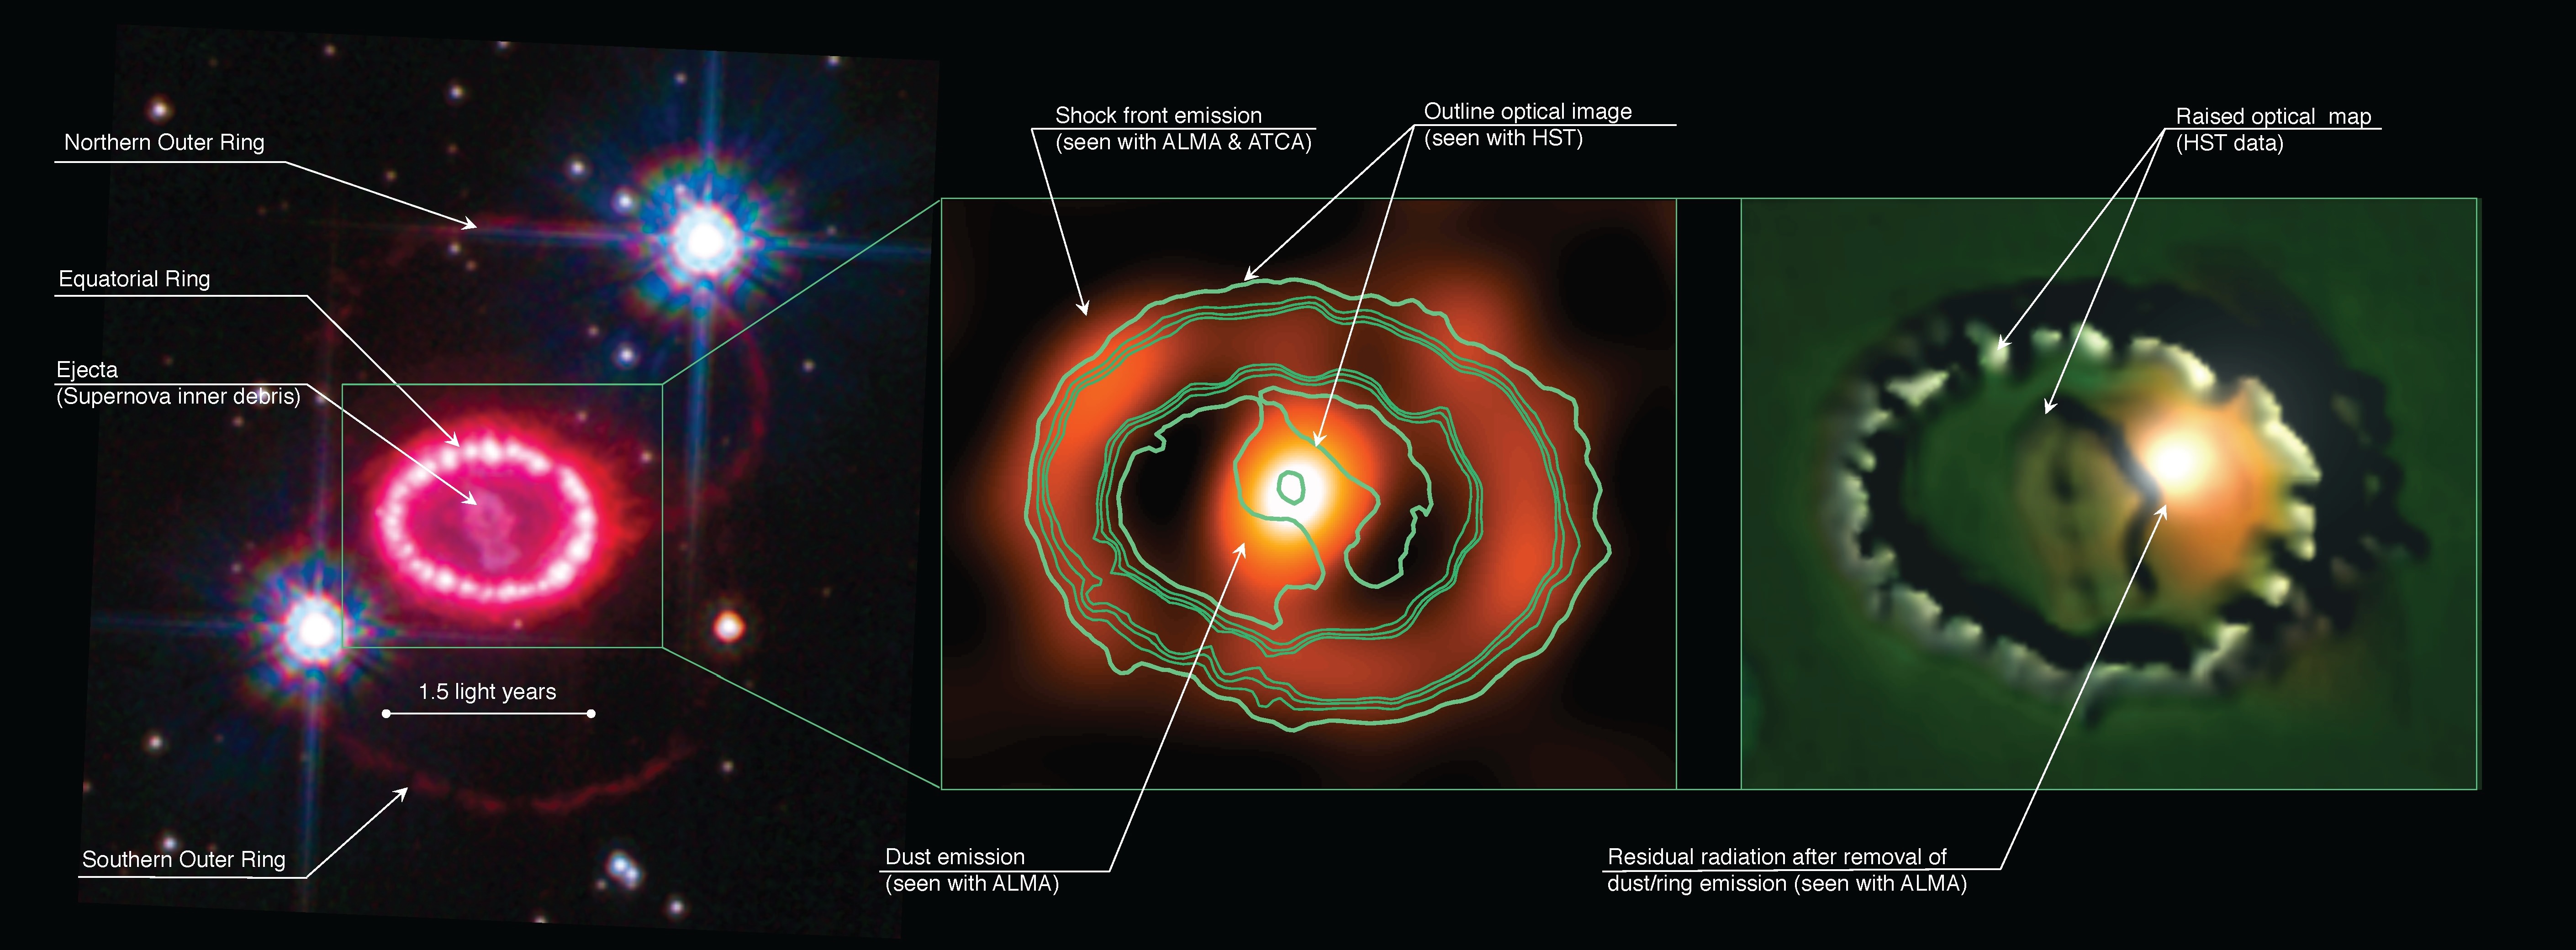
Left Panel: SNR1987A as seen by the Hubble Space Telescope in 2010.Middle Panel: SNR1987A as seen by the Australia Telescope Compact Array (ATCA) in New South Wales and the Atacama Large Millimeter/submillimeter Array (ALMA) in Chile. Right Panel: A computer generated visualisation of the remnant showing the possible location of a Pulsar. Credit: ATCA & ALMA Observations & data - G. Zanardo et al. / HST Image: NASA, ESA, K. France (University of Colorado, Boulder), P. Challis and R. Kirshner (Harvard-Smithsonian Center for Astrophysics)

A team of Australian astronomers has been busy utilizing some of the world’s leading radio telescopes located in both Australia and Chile to carve away at the layered remains of a relatively new supernova. Designated as SN1987A, the 28 year-old stellar cataclysm came to Southern Hemisphere observer’s attention when it sprang into action at the edge of the Large Magellanic Cloud some two and a half decades ago. Since then, it has provided researchers around the world with a ongoing source of information about one of the Universe’s “most extreme events”.

Representing the University of Western Australia node of the International Centre for Radio Astronomy Research, PhD Candidate Giovanna Zanardo led the team focusing on the supernova with the Australia Telescope Compact Array (ATCA) in New South Wales. Their observations took in the wavelengths spanning the radio to the far infrared.

“By combining observations from the two telescopes we’ve been able to distinguish radiation being emitted by the supernova’s expanding shock wave from the radiation caused by dust forming in the inner regions of the remnant,” said Giovanna Zanardo of the International Centre for Radio Astronomy Research (ICRAR) in Perth, Western Australia.

“This is important because it means we’re able to separate out the different types of emission we’re seeing and look for signs of a new object which may have formed when the star’s core collapsed. It’s like doing a forensic investigation into the death of a star.”

“Our observations with the ATCA and ALMA radio telescopes have shown signs of something never seen before, located at the centre or the remnant. It could be a pulsar wind nebula, driven by the spinning neutron star, or pulsar, which astronomers have been searching for since 1987. It’s amazing that only now, with large telescopes like ALMA and the upgraded ATCA, we can peek through the bulk of debris ejected when the star exploded and see what’s hiding underneath.”

A video compilation showing Supernova Remnant 1987A as seen by the Hubble Space Telescope in 2010, and by radio telescopes located in Australia and Chile in 2012. The piece ends with a computer generated visualization of the remnant showing the possible location of a Pulsar. Credit: Dr Toby Potter, ICRAR-UWA, Dr Rick Newton, ICRAR-UWA

But, there is more. Not long ago, researchers published another paper which appeared in the Astrophysical Journal. Here they made an effort to solve another unanswered riddle about SN1987A. Since 1992 the supernova appears to be “brighter” on one side than it does the other! Dr. Toby Potter, another researcher from ICRAR’s UWA node took on this curiosity by creating a three-dimensional simulation of the expanding supernova shockwave.

“By introducing asymmetry into the explosion and adjusting the gas properties of the surrounding environment, we were able to reproduce a number of observed features from the real supernova such as the persistent one-sidedness in the radio images”, said Dr. Toby Potter.

So what’s going on? By creating a model which spans over a length of time, researchers were able to emulate an expanding shock front along the eastern edge of the supernova remnant. This region moves away more quickly than its counterpart and generates more radio emissions. When it encounters the equatorial ring – as observed by the Hubble Space Telescope – the effect becomes even more pronounced.

A visualization showing how Supernova1987A evolves between May of 1989 and July of 2014. Credit: Dr Toby Potter, ICRAR-UWA, Dr Rick Newton, ICRAR-UWA

“Our simulation predicts that over time the faster shock will move beyond the ring first. When this happens, the lop-sidedness of radio asymmetry is expected to be reduced and may even swap sides.”

“The fact that the model matches the observations so well means that we now have a good handle on the physics of the expanding remnant and are beginning to understand the composition of the environment surrounding the supernova – which is a big piece of the puzzle solved in terms of how the remnant of SN1987A formed.”

Original Story Source: Astronomers dissect the aftermath of a Supernova – International Centre for Radio Astronomy Research News Release.

Philae Idled, Batteries Drained; Needs Luck, Sunshine to Awake

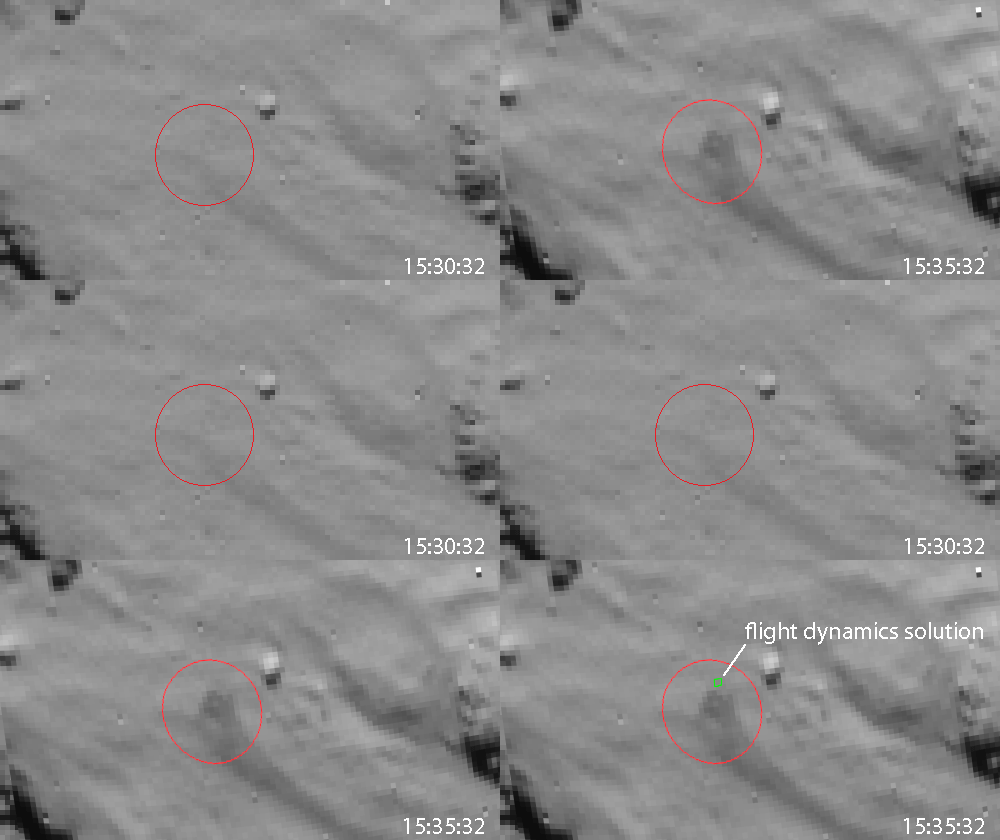
The animated image below provides strong evidence that Philae touched down for the first time almost precisely where intended. The animation comprises images recorded by Rosetta's navigation camera as the orbiter flew over the (intended) Philae landing site on November 12th. The dark area is probably dust raised by the craft on touchdown. The boulder to the right of the circle is seen in detail in the photo below. Credit: ESA/Rosetta/NAVCAM – CC BY-SA IGO 3.0

Contact with the Philae lander was lost at 6:36 p.m. (CST) this evening, November 14th, before the normal loss of signal when Rosetta orbits below the lander’s horizon. Without sunlight to juice up its solar panels and recharge the its batteries, the craft will remain in “idle mode” – maybe for a long time. All its instruments and most systems on board have been shut down. 

“Prior to falling silent, the lander was able to transmit all science data gathered during the First Science Sequence,” says DLR’s Stephan Ulamec, Lander manager. All of the science instruments were deployed, including the instruments that required mechanical movement, such as APXS, MUPUS, and the drill, which is designed to deliver samples to the PTOLEMY and COSAC instruments inside the lander.

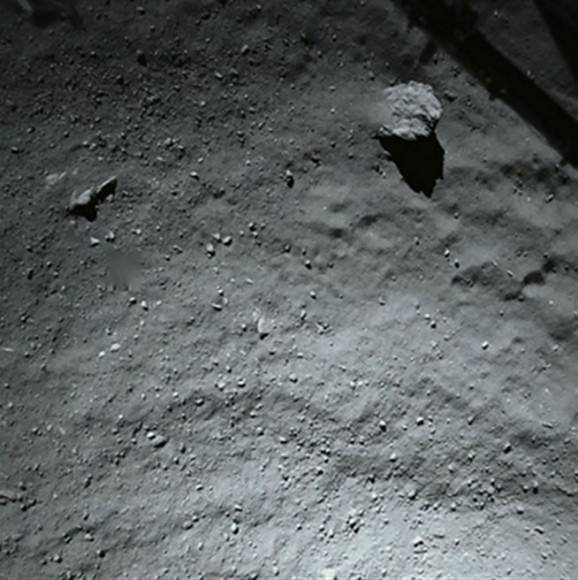
This image was taken by Philae's down-looking descent ROLIS imager when it was about 131 feet  (40 meters) above the surface of the comet. The surface is covered by dust and debris ranging from millimeter to meter sizes. The large block in the top right corner is 16.4 feet (5 m) in size. In the same corner the structure of the Philae landing gear is visible. Credit: ESA/Rosetta/Philae/ROLIS/DLR
This image was taken by Philae’s down-looking descent ROLIS imager when it was about 131 feet (40 meters) above the surface of the comet. The surface is covered by dust and debris ranging from millimeter to meter sizes. The large block in the top right corner is 16.4 feet (5 m) in size. In the same corner the structure of the Philae landing gear is visible. Credit: ESA/Rosetta/Philae/ROLIS/DLR

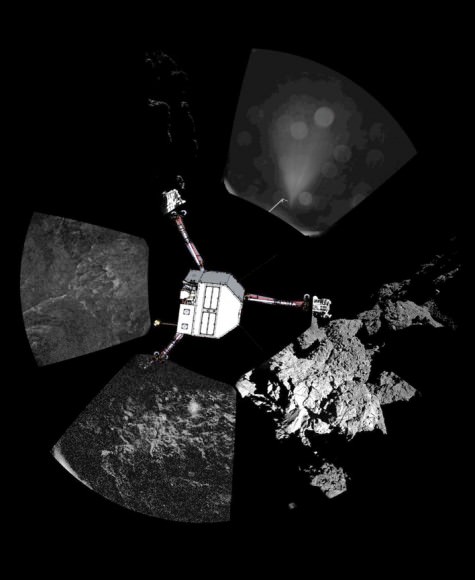
No contact will be possible unless maneuvers by controllers on the ground nudge Philae back into a sunnier spot. On its third and final landing, it unfortunately came to rest in the shadow of one of the comet’s many cliffs. Contrary to earlier reports (or speculations), Valentina Lommatsch from the German Aerospace Center explained that all three of Philae’s legs are on the ground. But the lander appears to be tipped up at an angle because one of the scenes from the panorama (below) shows mostly sky.

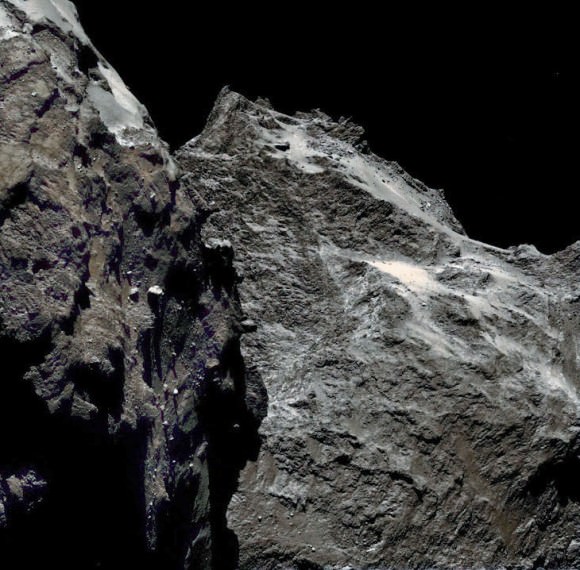
Jagged cliffs and prominent boulders are visible in this color image taken by OSIRIS, the Rosetta spacecraft’s scientific imaging system, on September 5, 2014 from a distance of 38.5 miles (62 km). Credit: ESA/Rosetta/MPS for OSIRIS team
Jagged cliffs and prominent boulders are visible in this photo taken by OSIRIS on September 5, 2014 from a distance of 38.5 miles (62 km) and processed/colorized by Marco Faccin and Elisabetta Bonora. Credit: ESA/Rosetta/MPS for OSIRIS team

This evening, mission controllers sent commands to rotate the lander’s main body to which the solar panels are fixed. This may have exposed more panel area to sunlight, but we won’t know until Saturday morning (Nov. 15) at 4 a.m. (CST) when the Rosetta orbiter has another opportunity to listen for Philae’s signal.

Our last panorama from Philae?  This image was taken with the CIVA camera; at center Philae has been added to show its orientation on the surface. Credit: ESA
Our last panorama from Philae? This image was taken with the CIVA camera; at center Philae has been added to show its orientation on the surface. Credit: ESA

The batteries were designed to power the probe for about 55 hours. Had Philae landed upright in the targeted region, its solar panels would have been out in the open and soaking up the sunlight needed for multiple recharges. There’s also the possibility that months from now, as seasons progress and illumination changes on the comet, that the Sun will rise again over the probe.

We may hear from the lander again or not. But if not, all the science instruments were deployed in the first two days of landing and data has been received.

* Update 7 a.m. (CST) November 15: A bit of good news! Rosetta has regained contact with Philae during the overnight communication pass, confirming that the lander still has power. The bad news is that the batteries will be completely drained sometime today.

Philae regained mission control
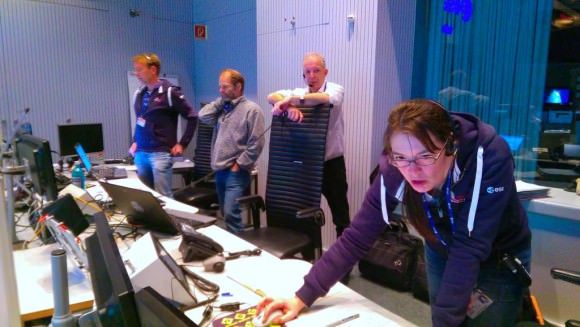
Deputy flight director Elsa Montagnon watches data flow from Philae on the surface of comet 67P/C-G Credit: ESA
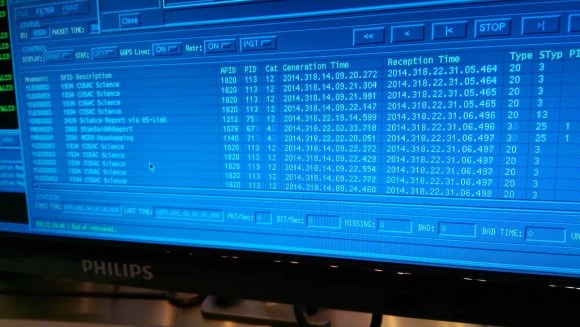
Science data transmitted by Philae on November 14th. Credit: ESA

Aurora on Venus Versus Solar Activity

Credit:

It’s a major mystery posed by our sister world.

Does the atmosphere of Venus possess upper atmospheric phenomena similar to the Earth, such as aurora or nightglow?

Now, a recent announcement out of the American Astronomical Society’s 46th annual meeting of the Division of Planetary Science being held this week in Tucson, Arizona has shed new light on the dilemma.

The discovery was announced on Wednesday, November 12th at the 46th AAS meeting and was made as a collaborative effort by researchers from New Mexico State University at Las Cruces, the Stanford Research Institute (SRI) International, the University of Colorado at Boulder, the University of Koln and University of Munich, Germany, the European Space and Technology Center in the Netherlands and the Institut de Recherche en Astrophysique et Planétologie, in France.

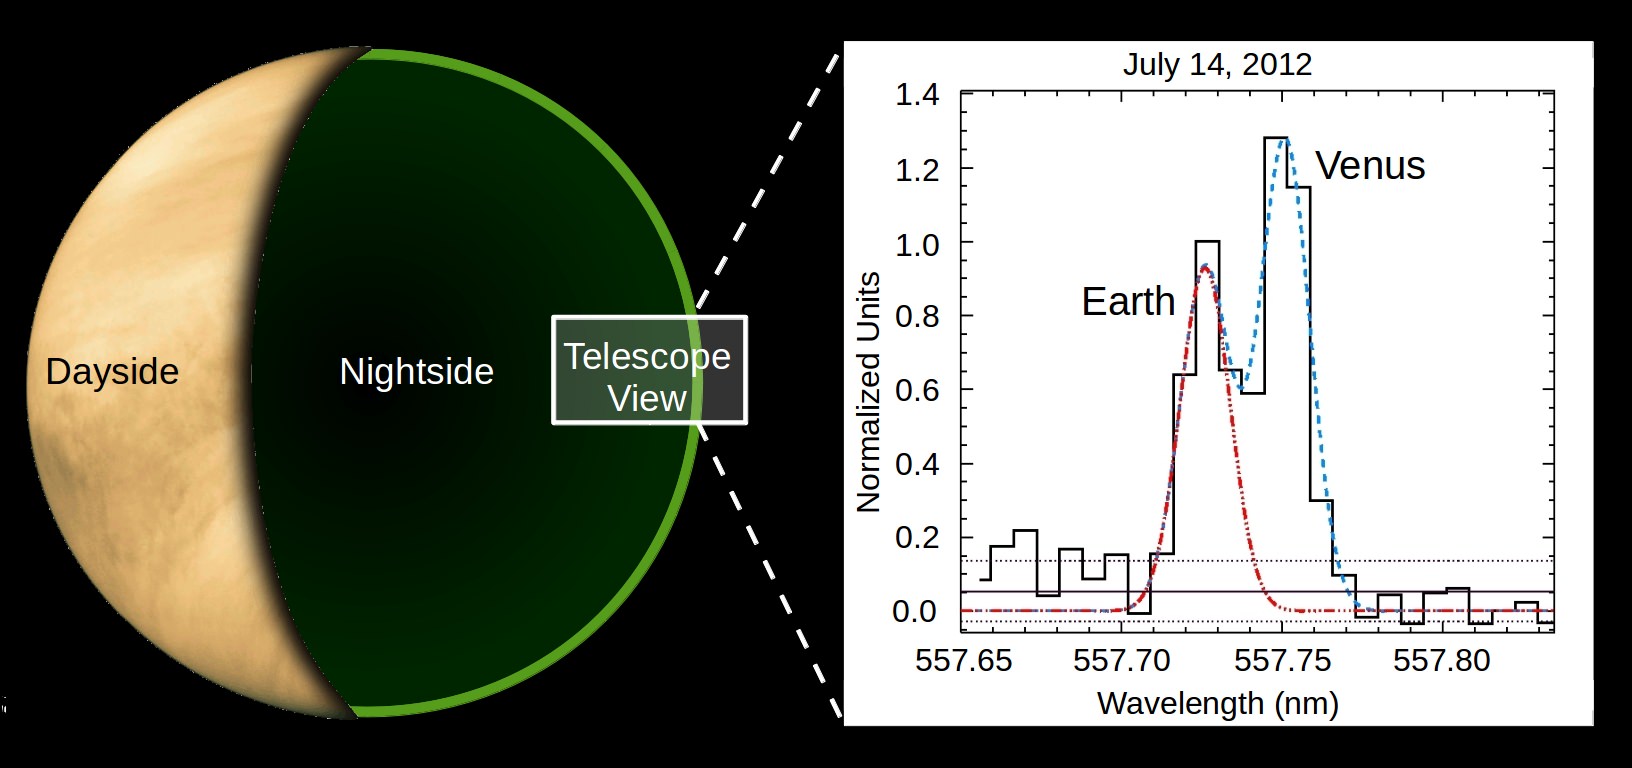
For the study, researchers observed Venus from December 2010 to July 2012 using the Astrophysical Research Consortium (ARC)Echelle Spectrograph and the ARC  3.5 metre telescope located at Apache Point near Sunspot, New Mexico.

Timing was crucial, as the Sun was coming off of a profound deep minimum through 2009 and just beginning to become active with the start of solar cycle #24. Observers were looking for activity along the 5577.3 angstrom wavelength known as the “oxygen green line.” Activity had not been seen at this wavelength on the nighttime side of Venus since 2004.

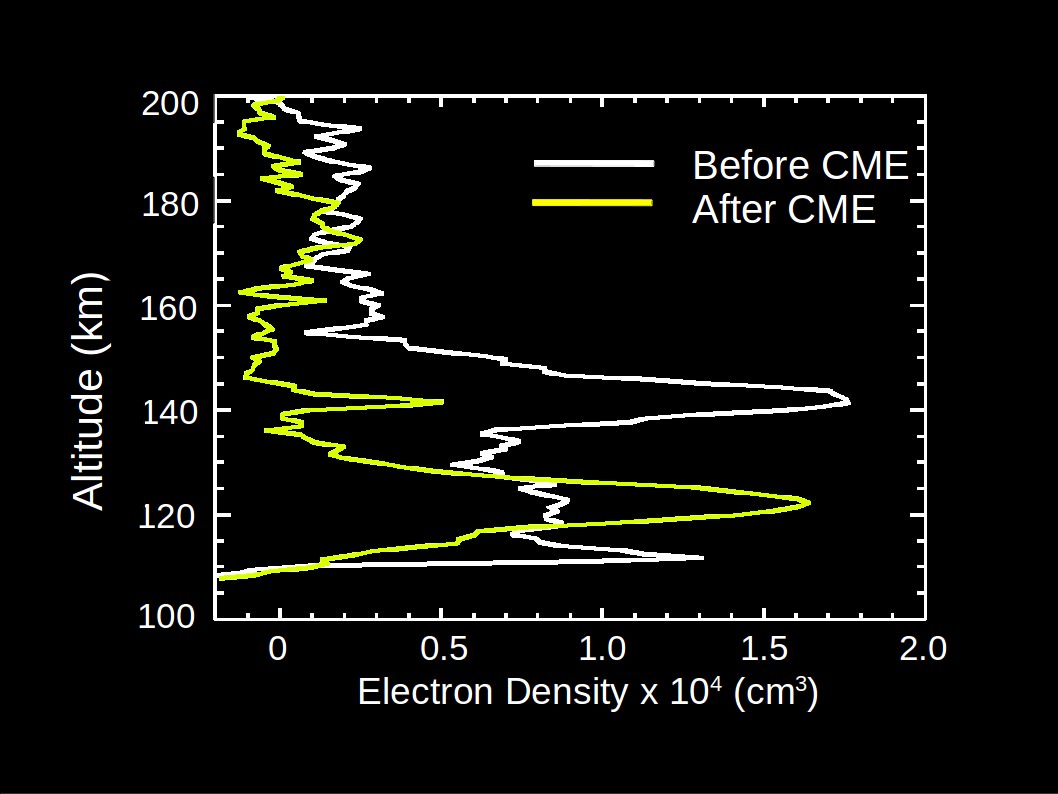
The altitude drop in the Venusian atmosphere measured in the study. Credit : Credit: DPS press release/C. Gray/New Mexico State University.

“These are intriguing results, suggesting that it is possible to have aurora on non-magnetic planets,” said Candace Gray, Astronomer and NASA Earth and Space Science Fellow at Las Cruces and lead researcher in the study.  “On Venus, this green line has been seen only intermittently.”

Earth is the oddball among the terrestrial planets in the inner solar system with its robust magnetic field. On Earth, aurorae occur when said field captures charged particles ejected from the Sun and funnels them in towards the poles. Events seen in the study tended to drop 140 to 120 kilometres in altitude in the Venusian atmosphere, highly suggestive of auroral activity seen in the ionosphere of Earth.

Researchers were fortunate during one of the recent runs at Apache Point that the Sun kicked off a coronal mass ejection that headed Venus’s way. During the July 2012 solar storm, the team detected one of the brightest green line emissions that had ever been detected by observers on Earth.

Credit: Wikimedia Commons image.
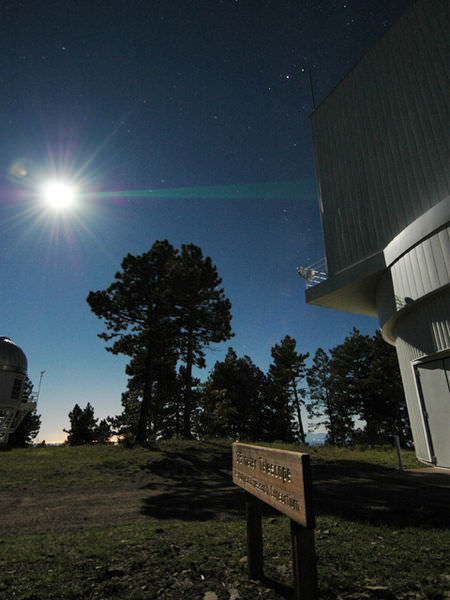
The 3.5 metre telescope at Apache Point, in this case, being used for lunar ranging experiments. Credit: M3long/Wikimedia Commons image.

This demonstrates that perhaps, a magnetic field is optional when it comes to auroral activity, at least in the case of the planet Venus. Located only 0.7 astronomical units (108.5 million kilometres) from the Sun, our tempestuous star actually wraps the planet with its very own magnetotail.

Researchers are also looking to compare their results with observations from the European Space Agency’s Venus Express orbiter which arrived at the planet on April 2006.

“Currently, we are using observations from VIRTIS on Venus Express to try and detect the green line,” Gray told Universe Today. “We had coordinated ground based observations with them this past February, and we detected the green line from the ground when they were observing the night side limb. Additionally, we are using the Electron Spectrometer and ASPERA-4 to observe how the electron energy and density changes in the atmosphere after coronal mass ejection impacts.”

This also raises the interesting possibility that NASA’s MAVEN spacecraft — which recently arrived in orbit around Mars — might just detect similar activity in the tenuous Martian atmosphere as well. Like Venus, the Red Planet also lacks a global magnetic field.

Could this glow be connected with spurious sightings of the “Ashen Light of Venus” that have cropped up over the centuries?

Of course, ashen light, also known as Earthshine on the dark limb of the Moon, is easily explained as sunlight reflected back from the Earth. Moonless Venus, however, should be ashen light free.

“The green line emission that we see is brightest on the limb (edge) of the planet,” Gray told Universe Today. “We’re sure that there is emission all along the nightside, but because of the optical depth, it appears much brighter on the limb of the planet. I think it would be too faint to detect with the naked eye.”

Nightglow has been a leading suspect for ashen light on the Venusian nightside, and a similar green line emission detection rivaling the 2012 event was made by Tom Slanger using the Keck I telescope 1999.

Other proposed suspects over the centuries for ashen light on Venus include lightning, volcanism, light pollution (!) from Venusian cities, or just plain old observer error.

Certainly, future observations are needed to cinch the solar activity connection.

“We will likely observe Venus again from Apache Point the next time Venus is visible to us in June 2015,” Gray told Universe Today. “We will continue looking at Venus Express observations until the craft dies in the atmosphere.”

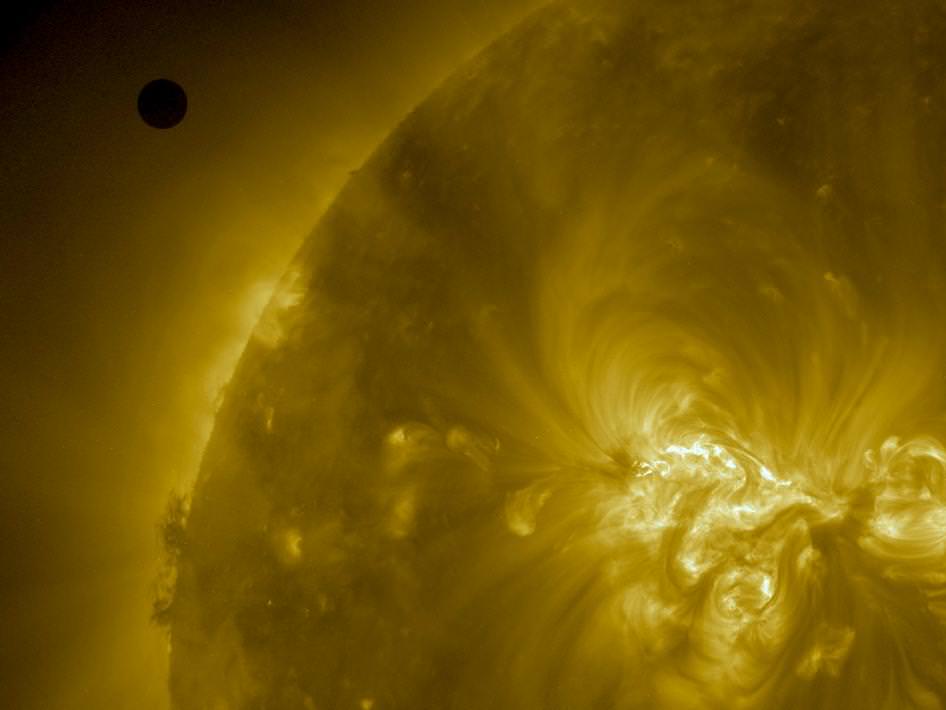
Venus turns its night time back towards us during the 2012 transit of the Sun, as seen from NASA's Solar Dynamics Observatory (Credit: NASA/SDO).
Venus turns its night time back towards us during the 2012 transit of the Sun, as seen from NASA’s Solar Dynamics Observatory (Credit: NASA/SDO).

Venus can currently be seen crossing through the field of view of SOHO’s LASCO C3 camera. After spending most of 2014 in the dawn sky, Venus will emerge from behind the Sun low in the dusk to head towards greatest elongation in the evening sky on June 6th, 2015. And from there, Venus will once again slender towards a crescent, presenting its nightside towards Earth, and just perhaps, continuing to present a lingering mystery of modern astronomy.

China Reveals Designs for Mars Rover Mission

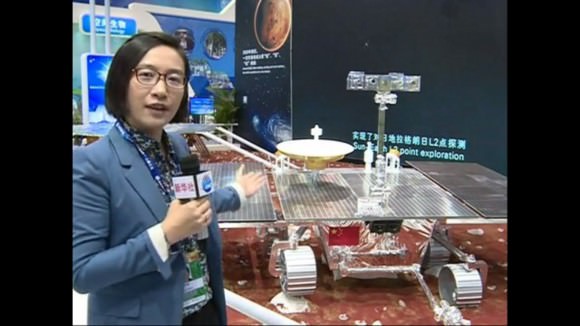
A mock-up of a future Chinese Martian rover was displayed at the International Industry Fair in Shanghai (Credit: South China Morning Post)

For many space-faring nations, ambitions for Mars run broad and deep. Now, add China to the list of countries with Mars in their sights. News reports from China disclosed that country is considering a future Mars rover mission, with a potential 2020 launch date. Additionally came other hints that China may be looking to develop a next-generation heavy-lift launch system.

This new project, while early in development, reveals how Chinese aspirations are growing rapidly. Human space flight successes have been followed by recent lunar mission successes of the Yutu lunar rover and the Chang’e-5 T1 test of a sample return mission. The Chinese Mars missions could influence future plans of ESA, India and NASA or more simply raise the urgency to execute missions in concept or early development without hesitation.

China View reporter Lai Yuchen is seen describing and pointing out the future Sino-Mars rover with plans for a 2020 launch coinciding with the NASA/JPL Mars 2020 rover mission . (Click still image for video Link) (Photo/Video Credit: China View)

The Mars rover mock-up display was presented at the aerospace show by China Aerospace Science and Technology Corporation (CASC). The design appears similar to the Yutu rover which landed successfully on the Moon late in 2013. While Yutu’s mobility system failed prematurely, many mission milestones were achieved.

The Mars rover design is significantly larger than Yutu but includes changes that can be attributed to the challenges of roving Mars at tens of millions of kilometers distance and under more gravitational force. The wheels are beefed up, since it must withstand more force and rugged martian terrain (gravity on Mars is 37% of the Earth’s in strength but 2.25 times the strength of gravity on the Moon’s surface.) The the solar panels are larger due to 1.) less sunlight at Mars – 35% to 50% of Earth’s, and 2.) more electrically demanding instruments.

The goals of the Chinese Mars rover will be to search for life and water. The NASA missions searching for indicators of habitable environments and for water has cost billions of dollars but the Chinese space program is operating on a fraction of what NASA’s annual budget is. Whereas the Chinese Mars program will be competing with the lunar program for government funds, it remains to be seen how quickly they can make progress and actually meet milestones for a 2020 launch date.

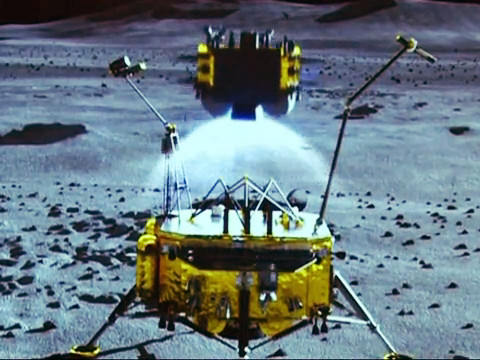
Besides video of the China View reporter presenting and discussing the Mars rover (link to photo above), the video also includes a simulation of the Chinese lunar sample return spacecraft, which is underdevelopment and was tested early this month during a the Chang’e-5 T1 circum-lunar mission that proved a small re-entry vehicle.

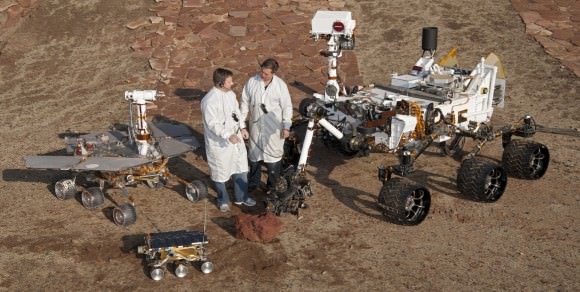
The future Chinese rover would be nearly as large as the MER rovers. Full scale models of all three NASA/JPL Mars rovers are shown here - Mars Pathfinder, MER and MSL in a JPL Mars yard with engineers.  (Photo Credit: NASA/JPL)
The future Chinese rover would be nearly as large as the MER rovers. Full scale models of all three NASA/JPL Mars rovers are shown here – Mars Pathfinder, MER and MSL in a JPL Mars yard with engineers. (Photo Credit: NASA/JPL)

The actual dimensions of this rover were not reported but an estimate of the size can be determined by the size of the high-gain directional antenna. Assuming it is an X-Band dish, like the one on the MER Rovers and Curiosity, then this Sino-rover would be near the same size as the MER rovers – Spirit and Opportunity. The Sino-rover shares a six wheel design like MER and MSL rovers.

Other reports from the China Daily indicated that industry leaders in China are urging China’s space agency to develop a more powerful heavy-lift launch system. It could be used for the nation’s human spaceflight goals to send a space station in to orbit, as well as send missions to Mars and beyond.

“It is a must for us to develop a more powerful heavy-lift rocket if we want to reach and explore deep space,” Zhang Zhi, a senior rocket researcher at the China Academy of Launch Vehicle Technology the aerospace exhibition.

Plans also call for an orbiter to likely function as a communication relay as MGS, Mars Odyssey and MRO have done for the American rovers. Whether this would involve a single spacecraft such as the NASA Vikings or dual crafts such as the present American rovers with supporting orbiters is unknown. Given the successful landing of the Yutu rover encapsuled in a soft-lander, one might expect the same for the Chinese Mars rover rather than an airbag landing used by MER. Either way, they will be challenged by the seven minutes of terror just like the American rovers. They will have to solve for themselves the entry, descent and landing of a rover. Only American-made rovers have successfully landed on Mars; all Russian attempts have ended in failure.

The Chinese Lunar Sample Return mission is show in simulation in the China View video. This mission would pave the way for a Chinese Mars sample return by 2030. (Photo Credit: China View)

The presentation also stated future plans for a sample-return mission by 2030. If the first Chineses Mars rover lands successfully in 2020, it will join up to four active rovers on the surface. Curiosity, ExoMars (ESA/NASA), Mars Rover 2020 and MER Opportunity. Six years seems like a long time but MER’s Oppy is a proven trooper having lasted over ten years. Curiosity, barring the unexpected, might last beyond 2020. ExoMars and NASA’s 2020 rover are still in development phases. Using ExoMars or 2020, NASA has plans to recover collected samples from rovers and return them to Earth in the 2020s and possibly as soon as 2022.

References:

China unveils first Mars rover and exploration system for red planet
China Daily

Radio Galaxy With Black Hole Has ‘Fierce Electrical Thunderstorm’ Raging In Its Depths

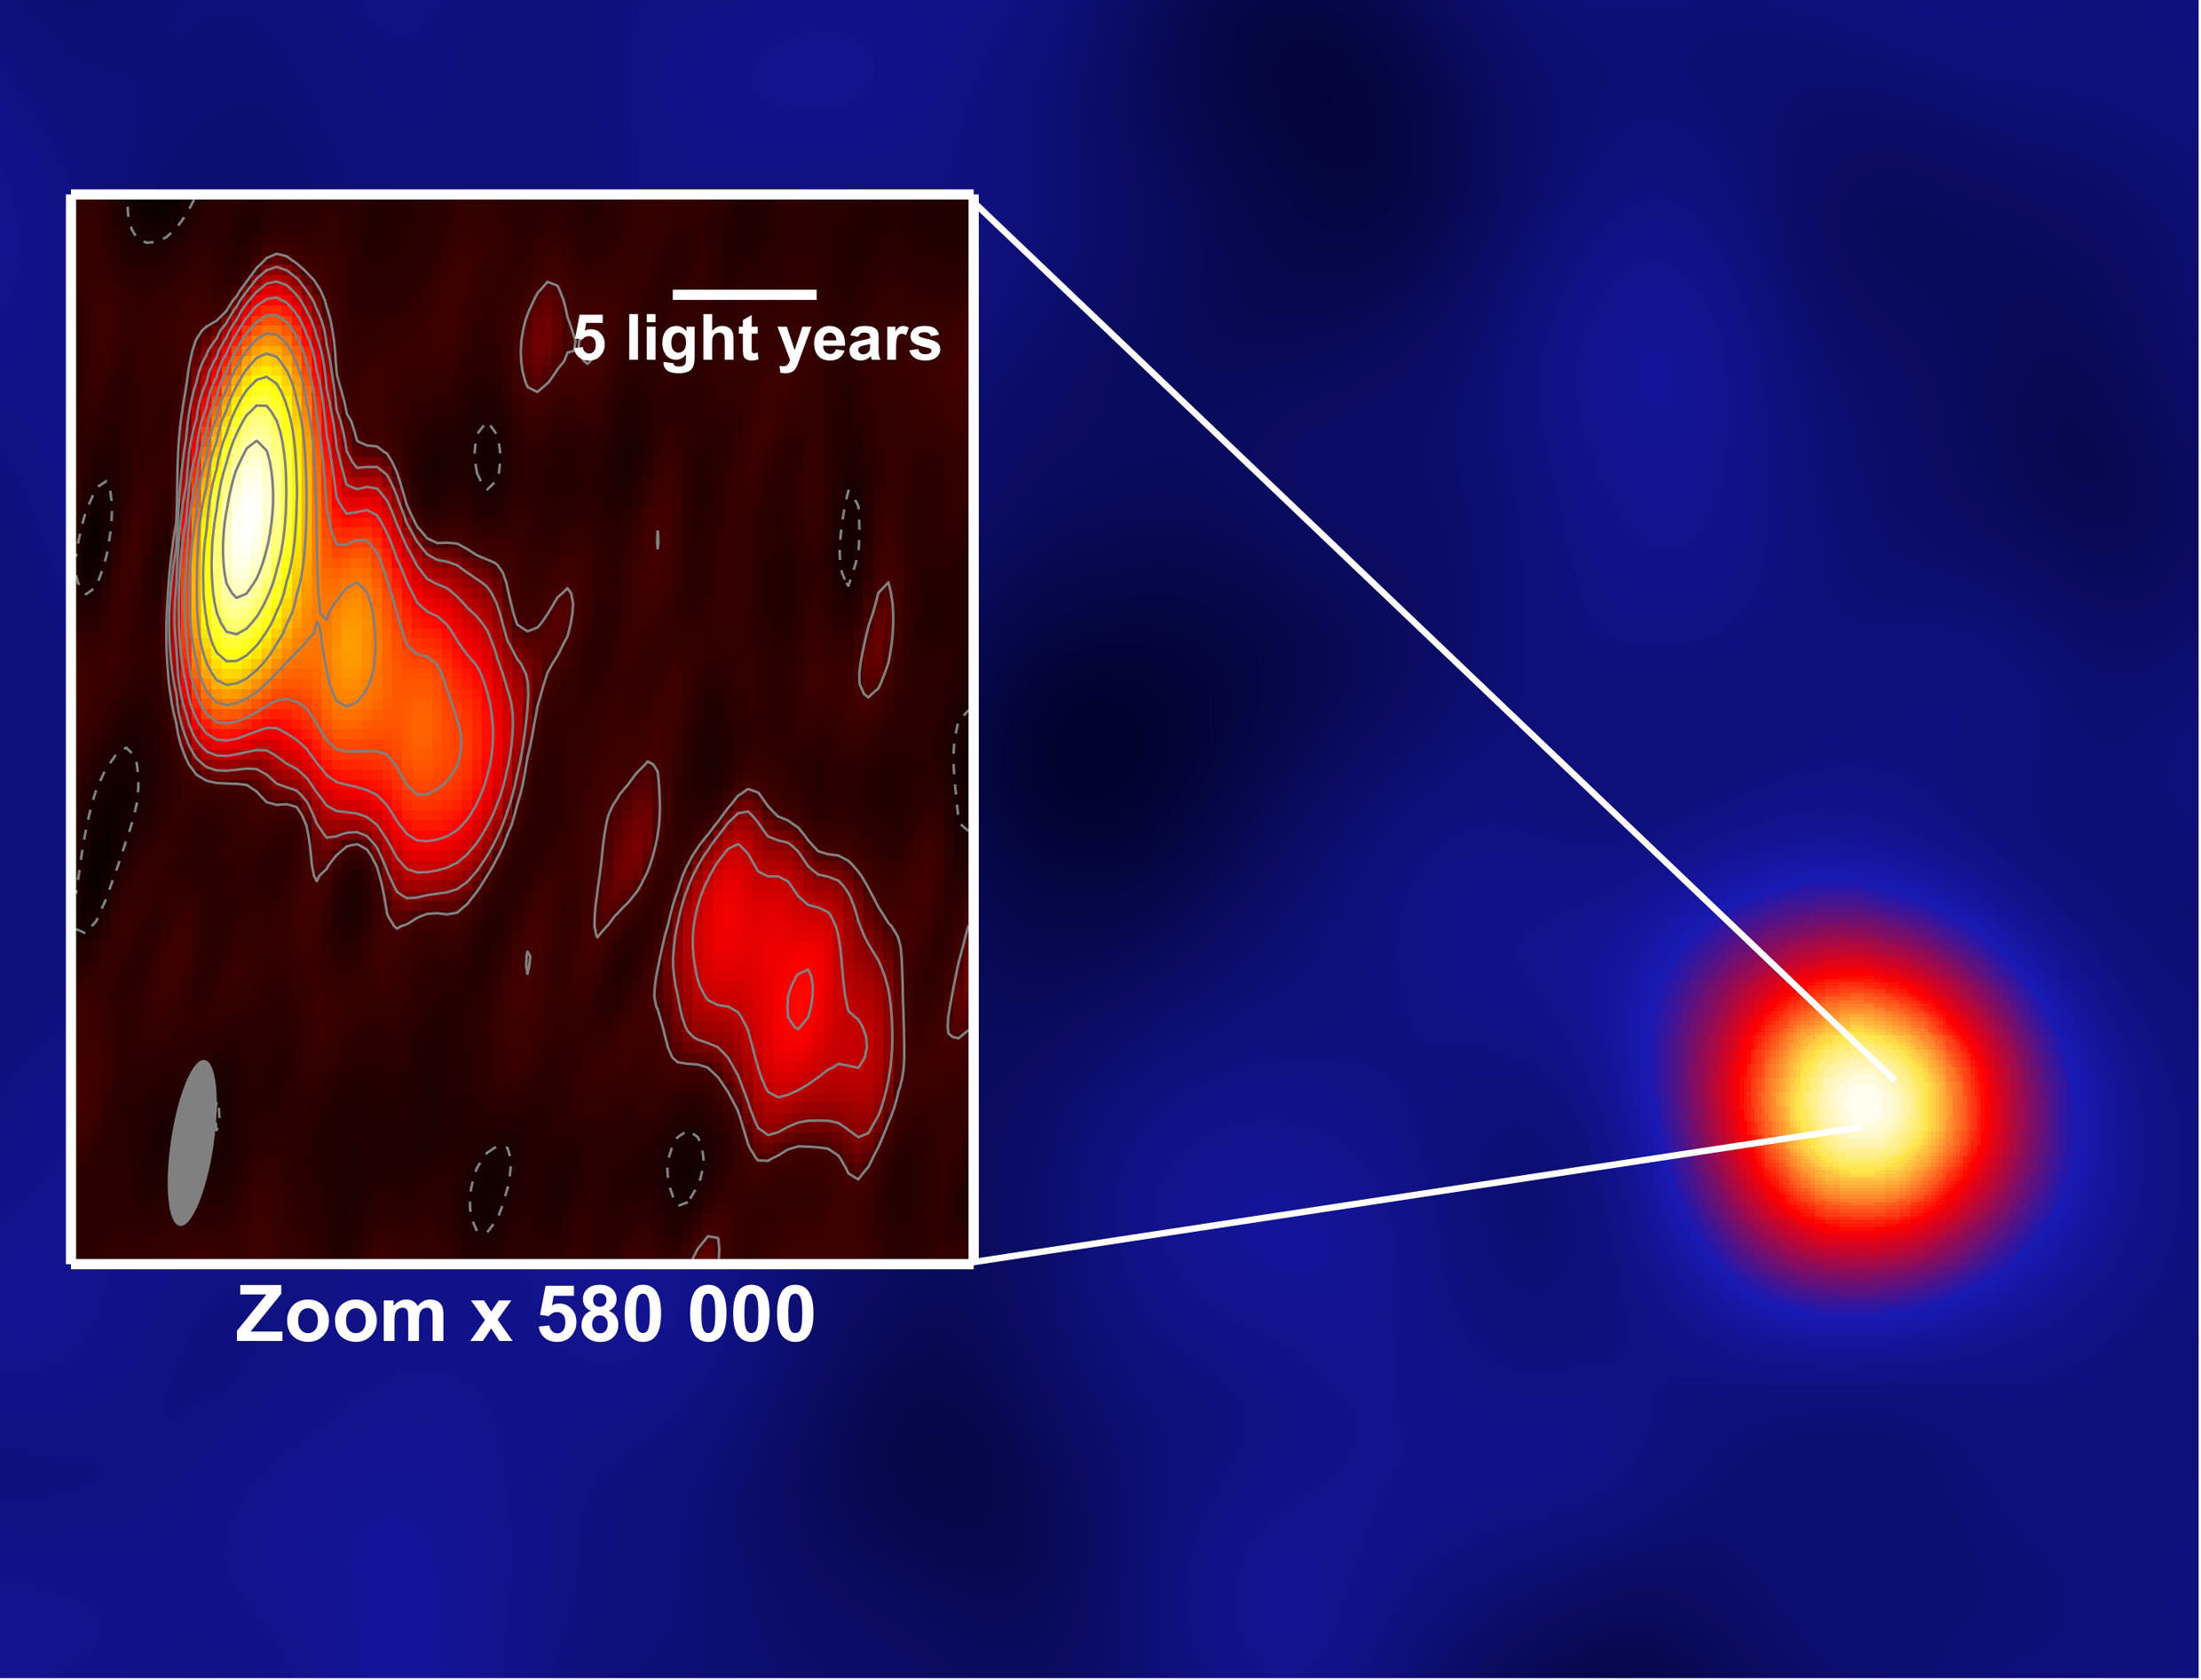
Observations of the IC 310 radio galaxy have revealed the first lightning flashes observed from a black hole, astronomers say. Credit: Valencian Universities Network for the Promotion of Research, Development and Innovation (RUVID)

We know black holes are dangerous to people and galactic objects alike due to their immense gravity. But it turns out the galaxies that host supermassive black holes also have stormy interiors, at least according to one new study.

Scientists have found gamma-ray euptions emerging from the center of the IC 310 radio galaxy in Perseus — the strongest such variations in brightness ever found, they say — which they are comparing to a lightning storm.

It’s common for changes in brightness to happen in these galaxies as falling matter plunges into the black hole. The radio galaxies also produce jets that shoot matter away from the center at close to the speed of light.

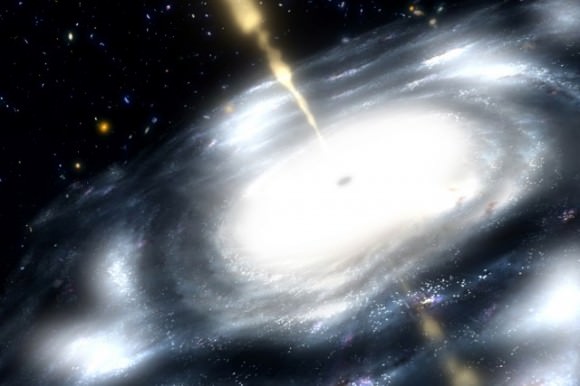
Artist rendering of a supermassive black hole. Credit: NASA / JPL-Caltech.

What baffles researchers for IC 310 is how quickly they saw brightness shifts– on the order of five minutes, which is odd considering that the black hole’s event horizon (the point where there’s no way you’ll get out of there) requires 25 minutes to go across. This means the lightning is likely coming from a region that is smaller than the event horizon itself.

“We believe that in the black hole’s polar regions there are huge electric fields, which are able to accelerate fundamental particles at relativist speeds,” stated study leader Eduardo Ros, a researcher from the Max Planck Institute for Radio Astronomy and the Universitat de València.

“When they interact with others of lower energy, [they] are able to produce highly energized gamma rays,” he added. “We can imagine this process as a fierce electrical thunderstorm.”

Results of the study were published in the journal Science. Observatories participating included the Major Atmospheric Gamma-ray Imaging Cherenkov Telescopes (MAGIC) at La Palma in the Canary Islands, and the European Very Large Baseline Interferometer Network.

Source: Valencian Universities Network for the Promotion of Research, Development and Innovation (RUVID)