James Webb Space Telescope’s Giant Sunshield Test Unit Unfurled First Time

The sunshield test unit on NASA's James Webb Space Telescope is unfurled for the first time. Credit: NASA

GODDARD SPACE FLIGHT CENTER, MD – The huge Sunshield test unit for NASA’s James Webb Space Telescope (JWST) has been successfully unfurled for the first time in a key milestone ahead of the launch scheduled for October 2018.

Engineers stacked and expanded the tennis-court sized Sunshield test unit last week inside the cleanroom at a Northrop Grumman facility in Redondo Beach, California.

NASA reports that the operation proceeded perfectly the first time during the test of the full-sized unit.

The Sunshield and every other JWST component must unfold perfectly and to precise tolerances in space because it has not been designed for servicing or repairs by astronaut crews voyaging beyond low-Earth orbit into deep space, William Ochs, Associate Director for JWST at NASA Goddard told me in an exclusive interview.

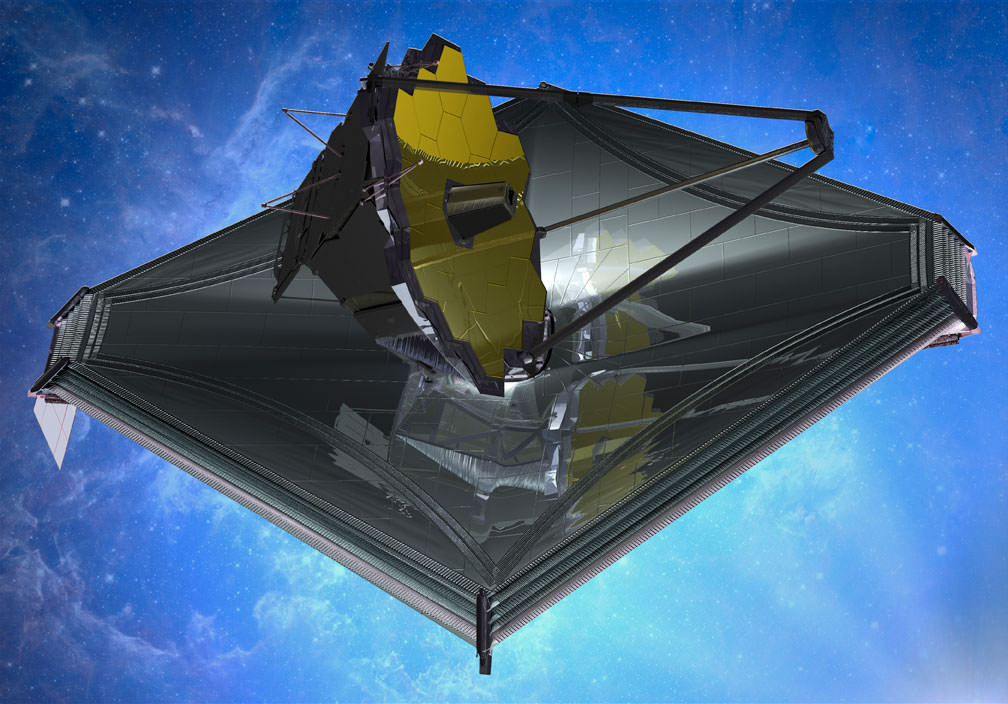
Artist’s concept of the James Webb Space Telescope (JWST) with Sunshield at bottom.  Credit: NASA/ESA
Artist’s concept of the James Webb Space Telescope (JWST) with Sunshield at bottom. Credit: NASA/ESA

The five layered Sunshield is the largest component of the observatory and acts like a parasol.

Its purpose is to protect Webb from the suns heat and passively cool the telescope and its quartet of sensitive science instruments via permanent shade to approximately 45 kelvins, -380 degrees F, -233 C.

The kite-shaped Sunshield provides an effective sun protection factor or SPF of 1,000,000. By comparison suntan lotion for humans has an SPF of 8 to 40.

Two sides of the James Webb Space Telescope (JWST). Credit: NASA

The extreme cold is required for the telescope to function in the infrared (IR) wavelengths and enable it to look back in time further than ever before to detect distant objects.

The shield separates the observatory into a warm sun-facing side and a cold anti-sun side.

Its five thin membrane layers also provides a stable thermal environment to keep the telescopes 18 primary mirror segments properly aligned for Webb’s science investigations.

JWST is the successor to the 24 year old Hubble Space Telescope and will become the most powerful telescope ever sent to space.

The Webb Telescope is a joint international collaborative project between NASA, the European Space Agency (ESA) and the Canadian Space Agency (CSA).

NASA has overall responsibility and Northrop Grumman is the prime contractor for JWST.

Webb will launch folded up inside the payload fairing of an ESA Ariane V ECA rocket from the Guiana Space Center in Kourou, French Guiana.

In launch configuration, the Sunshield will surround the main mirrors and instruments like an umbrella.

During the post launch journey to the L2 observing orbit at the second Sun-Earth Lagrange point nearly a million miles (1.5 million Km) from Earth, the telescopes mirrors and sunshield will begin a rather complex six month long unfolding and calibration process.

The science instruments have been mounted inside the ISIM science module and are currently undergoing critical vacuum chamber testing at NASA Goddard Space Flight Center which provides overall management and systems engineering.

Gold coated flight spare of a JWST primary mirror segment made of beryllium and used for test operations inside the NASA Goddard clean room.  Credit: Ken Kremer- kenkremer.com
Gold coated flight spare of a JWST primary mirror segment made of beryllium and used for test operations inside the NASA Goddard clean room. Credit: Ken Kremer- kenkremer.com

The mirror segments have arrived at NASA Goddard where I’ve had the opportunity to observe and report on work in progress.

Stay tuned here for Ken’s continuing JWST, MMS, ISS, Curiosity, Opportunity, SpaceX, Orbital Sciences, Boeing, Orion, MAVEN, MOM, Mars and more Earth and Planetary science and human spaceflight news.

Ken Kremer

Sunshield test unit on NASA's James Webb Space Telescope is unfurled for the first time at Northrup Grumman.  Credit: NASA
Sunshield test unit on NASA’s James Webb Space Telescope is unfurled for the first time at Northrup Grumman. Credit: NASA

NASA Preps for Nail-biting Comet Flyby of Mars

This graphic depicts the orbit of comet C/2013 A1 Siding Spring as it swings around the sun in 2014. On Oct. 19, the comet will have a very close pass at Mars. Its nucleus will miss Mars by about 82,000 miles (132,000 kilometers). The comet's trail of dust particles shed by the nucleus might be wide enough to reach Mars or might also miss it. Credit: NASA/JPL

As Comet C/2013 A1 Siding Spring inches closer to the Red Planet, NASA’s taking steps to protect its fleet of orbiting Mars spacecraft. On October 19, the comet’s icy nucleus will miss the planet by just 82,000 miles (132,000 km). That’s 17 times closer than the closest recorded Earth-approaching comet, Lexell’s Comet in 1770. 

Comet C/2013 A1 (Siding Spring) on July 11, 2014. The comet, discovered by comet hunter Rob McNaught from Siding Spring Observatory in New South Wales, Australia on January 3, 2013, shows a bright coma and well-developed tail. Credit: Joseph Brimacombe
Comet C/2013 A1 (Siding Spring) on July 11, 2014. The comet, discovered by comet hunter Robert McNaught from Siding Spring Observatory in New South Wales, Australia on January 3, 2013, shows a bright coma and well-developed tail. Credit: Joseph Brimacombe

No one’s worried about the tiny nucleus doing any damage. It’ll zip right by. Rather it’s dust particles embedded in vaporizing ice that concern NASA planners. Dust spreads into a broad tail that could potentially brush Mars’ upper atmosphere and strike an orbiter. A single particle of debris half a millimeter across may not seem like your mortal enemy, but when it’s traveling at 35 miles (56 km) per second relative to the spacecraft, one hit could spell trouble.

This graphic depicts the orbit of comet C/2013 A1 Siding Spring as it swings around the sun in 2014. On Oct. 19, the comet will have a very close pass at Mars. Its nucleus will miss Mars by about 82,000 miles (132,000 kilometers). The comet's trail of dust particles shed by the nucleus might be wide enough to reach Mars or might also miss it. Credit: NASA/JPL
The orbit of comet C/2013 A1 Siding Spring as it swings around the sun in 2014. NASA’s already begun moving the Mars orbiters toward safe positions in preparation for the upcoming flyby. Credit: NASA/JPL

“Three expert teams have modeled this comet for NASA and provided forecasts for its flyby of Mars,” explained Rich Zurek, chief scientist for the Mars Exploration Program at NASA’s Jet Propulsion Laboratory in Pasadena, California. “The hazard is not an impact of the comet nucleus, but the trail of debris coming from it. Using constraints provided by Earth-based observations, the modeling results indicate that the hazard is not as great as first anticipated. Mars will be right at the edge of the debris cloud, so it might encounter some of the particles — or it might not.”

The agency’s taking a prudent approach. NASA currently operates the Mars Reconnaissance Orbiter (MRO) and Mars Odyssey spacecraft with a third orbiter, MAVEN, currently on its way to the planet and expected to settle into orbit a month before the comet flyby. Teams operating the orbiters plan to have all spacecraft positioned on the opposite side of Mars when the comet is most likely to pass by.

Already, mission planners tweaked MRO’s orbit on July 2 to move it toward a safe position with a second maneuver to follow on August 27. A similar adjustment is planned for Mars Odyssey on August 5 and October 9 for the Mars Atmosphere and Volatile Evolution (MAVEN) probe. The time of greatest risk to the spacecraft is brief – about 20 minutes – when the widest part of the comet’s tail passes closest to the planet.

Will dust shed by the comet streak as meteors in the Martian sky on October 19?  The rovers will be watching. Credit: NASA/JPL
Will dust shed by the comet streak as meteors in the Martian sky on October 19? The rovers will be watching. Credit: NASA/JPL

One question I’m always asked is whether the Mars rovers are in any danger of dust-producing meteors in the comet’s wake. While the planet might get peppered with a meteor shower, its atmosphere is thick enough to incinerate cometary dust particles before they reach the surface, not unlike what happens during a typical meteor shower here on Earth. Rover cameras may be used to photograph the comet before the flyby and to capture meteors during the comet’s closest approach.

Despite concerns about dust, NASA knows a good opportunity when it sees one. In the days before and after the flyby, all three orbiters will conduct studies on the comet.

According to a recent NASA press release, instruments on MRO and Odyssey will examine the nucleus, coma and tail and possible effects on the Martian atmosphere:

Comet Siding Spring observed by the Spitzer Space Telescope in two wavelengths of infrared light in March 2014. The hint of blue-white corresponds to dust, red-orange to gas. Credit: NASA
Comet Siding Spring observed by the Spitzer Space Telescope in two wavelengths of infrared light in March 2014. The hint of blue-white corresponds to dust, red-orange to gas. Credit: NASA/JPL-Caltech/M. Kelley (Univ. Maryland)

“Odyssey will study thermal and spectral properties of the comet’s coma and tail. MRO will monitor Mars’ atmosphere for possible temperature increases and cloud formation, as well as changes in electron density at high altitudes and MAVEN will study gases coming off the comet’s nucleus as it’s warmed by the sun. The team anticipates this event will yield detailed views of the comet’s nucleus and potentially reveal its rotation rate and surface features.”

This is Comet Siding Spring’s first trip to the inner solar system. Expect exciting news as we peer up close at pristine ices and dust that have been locked in deep freeze since the time the planets formed.

For more information on the event, check out this NASA website devoted to the comet.


Having Fun with the Equation of Time

An analemma of the Sun, taken from Budapest, Hungary over a one year span. (Courtesy of György Soponyai, used with permission).

If you’re like us, you might’ve looked at a globe of the Earth in elementary school long before the days of Google Earth and wondered just what that strange looking figure eight thing on its side was.

Chances are, your teacher had no idea either, and you got an answer such as “it’s a calendar, kid” based on the months of the year marking its border.

In a vague sense, this answer is correct… sort of. That funky figure eight is what’s known as an analemma, and it traces out the course of the Sun in the sky through the year as measured from a daily point fixed in apparent solar time.

Analemma (Wikimedia Commons image).
Ye ole analemma… perpetually lost in the South Pacific? (Wikimedia Commons image).

But try explaining that one to your 3rd grade teacher. Turns out, measuring the passage of time isn’t as straight forward as you’d think. Our modern day clock and calendar is a sort of compromise, a method of marking the passage of time in a continuing battle to stay in sync with the heavens.

For most of history, the daily passage of time was denoted by the Sun. Solar Noon occurs when the Sun stands at its highest elevation (also known as its altitude) above the local horizon when it transits the north-south meridian. The trouble is, the passage apparent solar time doesn’t exactly match what we call solar mean time, or the 24 hour rotation of the Earth. In fact, this discrepancy can add up to as much as more than 16 minutes ahead of solar noon in late October and November and over 12 minutes behind it in February. This is worth bringing up this week because this factor, known as “The Equation of Time” — think “equation” in the sense that sundial owners must factor it in to make solar mean and apparent time “equal” — reaches its shallow minimum for 2014 this Saturday at 7:00 UT/3:00 AM EDT with a value of -6.54 minutes.

The solar analemma as plotted from the latitude of the Greenwich Observatory in England. (Wikimedia Commons/PAR/JPL Horizons).

So, what gives? Why won’t the pesky universe stay in sync?

Well, the discrepancy arises from two factors: the eccentricity of the Earth’s orbit, or how much it deviates from circular and the obliquity of the ecliptic to the celestial equator, think the tilt of Earth’s axis. Of the two, obliquity is the major factor, with eccentricity playing a minor but measurable role. And remember, we move slightly faster in our orbit in January near perihelion as per Kepler’s Laws of planetary motion than at aphelion, which occurred earlier this month , though be careful not to confuse the term “faster” with “sun fast.”

This means that were the Earth to orbit the Sun in a perfect circle with its poles perpendicular to its orbit, apparent and mean time would essentially stay in sync. Of course, no known planet has such a perfect alignment scenario, and other worlds do indeed host alien analemmas (analemmae?) of their own.

It’s also interesting to note that the two each major and minor minima of the Equation of Time roughly coincide with the four cross quarter tie in days of the year (marked by Groundhog’s Day, May Day, Lammas Day and Halloween, respectively) while the zero value points fall within a few weeks of the equinoxes and solstices.

A graph showing the flucuation of the value of the Equation of Time throughout the callendar year. (Created by the author).
A graph showing the fluctuation of the value of the Equation of Time (with minutes on the vertical axis) throughout the calendar year. (Created by the author).

In the current epoch, the deep minimum falls on February 21st, while the highest maximum falls on November 3rd on non-leap years. The four zero value dates are April 15th, June 13th, September 1st and December 25th respectively. The exact timing of these also slip to the tune of about a second a year, but of course, most sundials lack this sort of precision.

A "globe sundial" on the University of North Dakota at grand Forks campus. (Photo by author).
A “globe sundial” on the University of North Dakota at Grand Forks campus. (Photo by author).

So, why should we care about the Equation of Time in the modern atomic clock age? It is true that there have been calls over the past few years to “abolish the leap second” and go off of the astronomical time standard entirely… if this ever does come to pass, some future Pope Gregory will have to institute a “leap hour” circa 10,000 A.D. or so to stop the Sun from rising at 2 AM. But some modern day Sun tracking devices (think heliostats or solar panels) do in fact use mechanical timers and must take the equation of time into account to maximize effectiveness.

You can plot your very own simulated analemma using a desktop planetarium program. (Credit: Starry Night Education software).
Impatient? You can plot your very own simulated analemma using a desktop planetarium program. (Credit: Starry Night Education software).

Want to see the Equation of Time in action? You can make your own analemma simply by photographing the position of the Sun at the same time each day. Just remember to account for the shift on and off of Daylight Saving if you live in an area that observes the archaic practice, residents of Arizona need not to take heed. Otherwise, you’ll end up with a “split analemma…” Wintertime near the December Solstice is the best time to start this project, as the Sun is at its lowest noonday culmination and this will assure that your very own personal analemma won’t fall below the local horizon.

Farther afield, the effects of the Precession of the Equinoxes will also tweak the dates of the Equation of Time values a bit. Live out a full 72 year life span, and the equinoctial points will have drifted along the ecliptic by about one degree, twice the diameter of the Full Moon. Incidentally, the failure to take Precession into account is yet another spectacular fail of modern astrology: most “houses” or “signs” have drifted in the past millennia to the point where most “Leos” are in fact “Cancers!”

Such is the challenges and vagaries of modern day astronomical time-keeping. Let us know of your tales of tragedy and triumph as you hunt down the elusive analemma.

Video: Warp Into A Star Nursery 3,000 Light Years Away

Zoom! This video brings you up close to a region where a bunch of stars are being born. This new video from the European Southern Observatory shows a so-called an HII region made up of hydrogen gas, which is a common feature of nurseries. Another famous example is the Eagle Nebula’s Pillars of Creation.

Continue reading “Video: Warp Into A Star Nursery 3,000 Light Years Away”

Mapping Dark Matter 4.5 Billion Light-years Away

This image shows the galaxy MCS J0416.1–2403, one of six clusters targeted by the Hubble Frontier Fields programme. The blue in this image is a mass map created by using new Hubble observations combined with the magnifying power of a process known as gravitational lensing. In red is the hot gas detected by NASA’s Chandra X-Ray Observatory and shows the location of the gas, dust and stars in the cluster. The matter shown in blue that is separate from the red areas detected by Chandra consists of what is known as dark matter, and which can only be detected directly by gravitational lensing.Credit: ESA/Hubble, NASA, HST Frontier Fields. Acknowledgement: Mathilde Jauzac (Durham University, UK) and Jean-Paul Kneib (École Polytechnique Fédérale de Lausanne, Switzerland).

The Milky Way measures 100 to 120 thousand light-years across, a distance that defies imagination. But clusters of galaxies, which comprise hundreds to thousands of galaxies swarming under a collective gravitational pull, can span tens of millions of light-years.

These massive clusters are a complex interplay between colliding galaxies and dark matter. They seem impossible to map precisely. But now an international team of astronomers using the NASA/ESA Hubble Space Telescope has done exactly this — precisely mapping a galaxy cluster, dubbed MCS J0416.1–2403, 4.5 billion light-years away.

“Although we’ve known how to map the mass of a cluster using strong lensing for more than twenty years, it’s taken a long time to get telescopes that can make sufficiently deep and sharp observations, and for our models to become sophisticated enough for us to map, in such unprecedented detail, a system as complicated as MCS J0416.1–2403,” said coauthor Jean-Paul Kneib in a press release.

Measuring the amount and distribution of mass within distant objects can be extremely difficult. Especially when three quarters of all matter in the Universe is dark matter, which cannot be seen directly as it does not emit or reflect any light. It interacts only by gravity.

But luckily large clumps of matter warp and distort the fabric of space-time around them. Acting like lenses, they appear to magnify and bend light that travels past them from more distant objects.

This effect, known as gravitational lensing, is only visible in rare cases and can only be spotted by the largest telescopes. Even galaxy clusters, despite their massive size, produce minimal gravitational effects on their surroundings. For the most part they cause weak lensing, making even more distant sources appear as only slightly more elliptical across the sky.

However, when the alignment of the cluster and distant object is just right, the effects can be substantial. The background galaxies can be both brightened and transformed into rings and arcs of light, appearing several times in the same image. It is this effect, known as strong lensing, which helped astronomers map the mass distribution in MCS J0416.1–2403.

“The depth of the data lets us see very faint objects and has allowed us to identify more strongly lensed galaxies than ever before,” said lead author Dr Jauzac. “Even though strong lensing magnifies the background galaxies they are still very far away and very faint. The depth of these data means that we can identify incredibly distant background galaxies. We now know of more than four times as many strongly lensed galaxies in the cluster than we did before.”

Using Hubble’s Advanced Camera for Surveys, the astronomers identified 51 new multiply imaged galaxies around the cluster, quadrupling the number found in previous surveys. This effect has allowed Jauzac and her colleagues to calculate the distribution of visible and dark matter in the cluster and produce a highly constrained map of its mass.

The total mass within the cluster is 160 trillion times the mass of the Sun, with an uncertainty of 0.5%. It’s the most precise map ever produced.

But Jauzac and colleagues don’t plan on stopping here. An even more accurate picture of the galaxy cluster will have to include measurements from weak lensing as well. So the team will continue to study the cluster using ultra-deep Hubble imaging.

They will also use ground-based observatories to measure any shifts in galaxies’ spectra and therefore note the velocities of the contents of the cluster. Combining all measurements will not only further enhance the detail, but also provide a 3D model of the galaxies within the cluster, shedding light on its history and evolution.

This work has been accepted for publication in the Monthly Notices of the Royal Astronomy and is available online.

Neck Of Rosetta’s ‘Rubby Duckie’ Comet Shows A Bright Ring

Rosetta imaged its target comet, Comet 67P/Churyumov-Gerasimenko, from about 3,417 miles (5,500 kilometers) away. The "neck" of the comet appears to be brighter than the rest of the nucleus. Credit: ESA/Rosetta/MPS for OSIRIS Team MPS/UPD/LAM/IAA/SSO/INTA/UPM/DASP/IDA

Rosetta’s “rubber duckie” comet appears to be wearing a collar! New images of Comet 67P/Churyumov-Gerasimenko from the spacecraft, which is speeding towards an orbit of the comet next month, show that the “neck” region of the nucleus appears to be brighter than the rest.

Last week, images from the spacecraft revealed that the comet likely has a “contact binary” nucleus, meaning that there are two parts of the nucleus that are just barely joined together under low gravity. There are many theories for why this happened, but it will take a closer examination to begin to come up with answers. The shape of the nucleus reminds many of a rubber duckie.

As for why the “neck” region appears brighter, that’s not known right now. There could be different grains in that region of the nucleus, or it could be some feature of the surface. Or perhaps it is a different type of material there. The scientists plan to get more spectral information from this region in the coming weeks, which could reveal what elements are there.

“Even though the images taken from a distance of 5500 kilometers are still not highly resolved, the scientists feel remotely reminded of comet 103P/Hartley,” stated the Max Planck Institute for Solar System Research.

“This body was visited in a flyby by NASA’s EPOXI mission in 2010. While Hartley’s ends show a rather rough surface, its middle is much smoother. Scientists believe this waist to be a gravitational low: since it contains the body’s center of mass, emitted material that cannot leave the comet’s gravitational field is most likely to be re-deposited there.”

Rosetta is expected to arrive at the comet on August 6, and to send out its spider-like lander (Philae) in November. The spacecraft will remain with the comet through its closest approach to the sun in 2015, between the orbits of Earth and Mars.

Source: Max Planck Institute for Solar System Research

‘Weak’ New Meteor Shower Due To Fragile Comet Dust

A Camelopardalid seen frame-by-frame in a recording taken May 24, 2014 at 1:58:08 a.m. UT (9:58:08 p.m. ET). Credit: Original recording by Peter C. Slansky; compilation by Jim Albers and Peter Jenniskens.

While the Camelopardalid shower only produced a few meteors, the lack of flashy disintegrations showed astronomers something new, a new study reveals: the dust from its parent comet (Comet 209P/Linear) was much more fragile than the usual. The reasons are still being investigated, but one theory is that after a century in space, there wasn’t much left to run into.

“Some mechanism was at work that efficiently fragmented the larger meteoroids,” stated Peter Jenniskens, a meteor astronomer with the SETI Institute who, along with colleague Esko Lyytinen, first predicted the existence of the shower a decade ago.

“Our best meteor was no more luminous than the star Vega,” added Jenniskens, “but it gave us a clue as to why there were few bright ones: It was so fragile that the meteoroid suddenly dispersed into a cloud of dust at the end of its trajectory.”

This ‘weak” shower stands in contrast to two meteor showers that took place out of interactions with comet 21P/Giacobinni-Zinner. This produced meteor “storms” in 1933 and 1946 during the Draconids. That comet was more active and the dust grains that left it likely had a lot of ice in them. Comet 209P/Linear did not have that type of ejection, nor was it very active.

You can read more Universe Today observations of the new shower in this past story.

Source: SETI Institute

ESO’s La Silla Observatory Reveals Beautiful Star Cluster “Laboratory”

In this image from the Wide Field Imager on the MPG/ESO 2.2-metre telescope at ESO’s La Silla Observatory in Chile young stars huddle together against a backdrop of clouds of glowing gas and lanes of dust. The star cluster, known as NGC 3293, would have been just a cloud of gas and dust itself about ten million years ago, but as stars began to form it became the bright group we see here. Clusters like this are celestial laboratories that allow astronomers to learn more about how stars evolve. Credit: ESO/G. Beccari

Any human being knows the awe-inspiring wonder of a splash of stars against a dark backdrop. But it takes a skilled someone to truly appreciate a distant object viewed through an eyepiece. Your gut tightens as you realize that the tiny fuzzy blob is really thousands of light-years away.

That wave of amazement is encouraged by understanding and knowledge.

Stunning photographs of the cosmos further convey the beauty that arises from the simple interplay of dust, light and gas on absolutely massive and distant scales. The striking image above from ESO’s La Silla Observatory in Chile is but one example.

Stars are born in enormous clouds of gas and dust. Small pockets in these clouds collapse under the pull of gravity, eventually becoming so hot that they ignite nuclear fusion. The result is a cluster of tens to hundreds of thousands of stars bound together by their mutual gravitational attraction.

Every star in a cluster is roughly the same age and has the same chemical composition. They’re the closest thing astronomers have to a controlled laboratory environment.

This chart shows the location of the bright open star cluster NGC 3293 in the southern constellation of Carina (The Keel). All the stars visible to the naked eye on a clear and dark night are marked, along with the positions of some nebulae and clusters. The location of NGC 3293 is marked with a red circle. This cluster is bright enough to be seen without optical aid in good conditions and is a spectacular sight in a moderate-sized telescope. Credit: ESO, IAU and Sky & Telescope
This chart shows the location of the bright open star cluster NGC 3293 (marked by a red circle) in the southern constellation of Carina. Image Credit: ESO / IAU / Sky & Telescope

The star cluster, NGC 3293, is located 8000 light-years from Earth in the constellation of Carina. It was first spotted by the French astronomer Nicolas-Louis de Lacaille during his stay in South Africa in 1751. Because it stands as one of the brightest clusters in the southern sky, de Lacaille was able to site it in a tiny telescope with an aperture of just 12 millimeters.

The cluster is less than 10 million years old, as can be seen by the abundance of hot, blue stars. Despite some evidence suggesting that there is still some ongoing star formation, it is thought that most, if not all, of the nearly 50 stars were born in one single event.

But even though these stars are all the same age, they do not all have the dazzling appearance of stars in their infancy. Some look positively elderly. The reason is simple: stars of different size, evolve at different speeds. More massive stars speed through their evolution, dying quickly, while less massive stars can live tens of billions of years.

Take the bright orange star at the bottom right of the cluster. Stars initially draw their energy from burning hydrogen into helium deep within their cores. But this star ran out of hydrogen fuel faster than its neighbors, and quickly evolved into a cool and bright, giant star with a contracted core but an extended atmosphere.

It’s now a cool, red giant, in a new stage of evolution, while its neighbors remain hot, young stars.

Eventually the star will collapse under its own gravity, throwing off its outer layers in a supernova explosion, and leaving behind a neutron star or a black hole. The peppering shock waves will likely initiate further star formation in the ever-changing laboratory.

Loading player…

Source: ESO

Cosmic Fireworks: A Supernova Feast And Google+ Hangout For Chandra’s 15th Anniversary

A collection of images from the Chandra X-Ray Observatory marking its 15th anniversary in space. Top, from left: the crab Nebula, supernova remnant G292.0+1.8 and the Crab Nebula. At bottom, supernova remnant 3C58. Credit: NASA/CXC/SAO

It’s well past the Fourth of July, but you can still easily find fireworks in the sky if you look around. The Chandra X-Ray Observatory has been doing just that for the past 15 years, revealing what the universe looks like in these longer wavelengths that are invisible to human eyes.

Just in time for the birthday, NASA released four pictures that Chandra took of supernova (star explosion) remnants it has observed over the years. The pictures stand as a symbol of what the telescope has shown us so far.

“Chandra changed the way we do astronomy. It showed that precision observation of the X-rays from cosmic sources is critical to understanding what is going on,” stated Paul Hertz, NASA’s Astrophysics Division director, in a press release. “We’re fortunate we’ve had 15 years – so far – to use Chandra to advance our understanding of stars, galaxies, black holes, dark energy, and the origin of the elements necessary for life.”

The telescope launched into space in 1999 aboard the space shuttle and currently works at an altitude as high as 86,500 miles (139,000 miles). It is named after Indian-American astrophysicist Subrahmanyan Chandrasekhar; the name “Chandra” also means “moon” or “luminous” in Sanskrit.

And there’s more to come. You can learn more about Chandra’s greatest discoveries and its future in this Google+ Hangout, which will start at 3 p.m. EDT (7 p.m. EDT) at this link.

‘Lopsided’ Ghostly Galactic Halo Has Some Starry Surprises

An image of Centaurus A. The halo goes across four degrees in the sky, about eight times the apparent width of the moon seen with the naked eye. The image was taken with the Digitized Sky Survey 2 (DSS2), the MPG/ESO 2.2-metre telescope, and the NASA/ESA Hubble Space Telescope’s Advanced Camera for Surveys (ACS). Credit: ESA/Hubble, NASA, Digitized Sky Survey, MPG/ESO

Centaurus A — that popular target for astrophotographers in the southern hemisphere — has a much wider halo than expected, astronomers revealed. Turns out the galaxy’s ghostly glow is about eight times the apparent width of the full moon in the sky. Examining this halo in more detail could reveal much about how galaxies come together, astronomers said.

It’s relatively easy for scientists to spot the halo around the Milky Way since we are a part of it, but it’s much harder to observe them in other galaxies because they are so faint. Looking at Centaurus A (10 million to 16 million light-years away) required the power of two Hubble Space Telescope instruments: the Advanced Camera for Surveys and the Wide Field Camera 3.

“Tracing this much of a galaxy’s halo gives us surprising insights into a galaxy’s formation, evolution, and composition,” stated lead author Marina Rejkuba of the European Southern Observatory in Germany. “We found more stars scattered in one direction than the other, giving the halo a lopsided shape — which we hadn’t expected.”

The Centaurus A Extreme Deep Field. (Image Courtesy of Astrophotography byRolf Oslen. Used with Permision).

The astronomers examined a region that is about 295,000 light-years across — more than double the diameter of the Milky Way’s 120,000 light years. The stars inside the glow appeared to have abundant heavier elements, even in the fringes of the galaxy — a contrast to the much lighter hydrogen and helium that are found in the fringes of the Milky Way and nearby spiral galaxies.

It’s possible the heavier stars arose because Centaurus A merged with a spiral galaxy long ago, removing stars from the intruder and sticking in Centaurus A, the astronomers said.

“Even at these extreme distances, we still haven’t reached the edge of Centaurus A’s halo, nor have we detected the very oldest generation of stars,” stated co-author Laura Greggio of Italy’s INAF (Istituto Nzaionale de Astrofisica, or National Institute for Astrophysics).

“This aged generation is very important. The larger stars from it are responsible for manufacturing the heavy elements now found in the bulk of the galaxy’s stars. And even though the large stars are long dead, the smaller stars of the generation still live on and could tell us a great deal.”

The results are available in Astrophysical Journal Letters and in preprint version on Arxiv.

Source: Hubble European Space Agency Information Centre