Are you ready for some eclipse action? We’re now within 24 hours of the Moon reaching its ascending node along the ecliptic at 13:25 Universal Time (UT)/ 9:25 AM EDT on Tuesday morning and meeting the shadow of the Earth just over seven hours earlier.
We’ve written about viewing prospects for tonight’s lunar eclipse. This eclipse is the first total lunar eclipse since December 10th, 2011 and is the first in a series of four — known as an eclipse tetrad — visible from North America in 2014 and 2015. Totality lasts 1 hour and 18 minutes and falls just 29 minutes short of the theoretical maximum, which was last neared on January 21st, 2000 and won’t be topped until July 27th, 2018.
This will be an early morning event for U.S. East Coasters spanning 2:00 to 5:30 AM local (from the start of the partial umbral phases and totality), and a midnight spanning-event for the Pacific coast starting at 11:00 PM Monday night until 2:30 AM Tuesday morning on the 15th.
And as always with celestial events, the chief question on every observer’s mind is: will the skies be clear come show time? Should I stay put, or ponder going mobile?
When it comes to astronomical observing, a majority a mainstream weather resources only tell part of the story, often only listing cloud cover and precipitation percentages. Seeing, transparency, and low versus middle and high cloud decks can often mean the difference between a successful observing session and deciding to pack it in and watch Cosmos reruns online. But the good news is, you don’t need crystal clear skies to observe a total lunar eclipse, just a view of the Moon, which can easily “burn through” a high cirrus cloud deck. We’re going to share a few sites that are essential tools for planning an observing session and what they say about the prospects for seeing tonight’s eclipse.
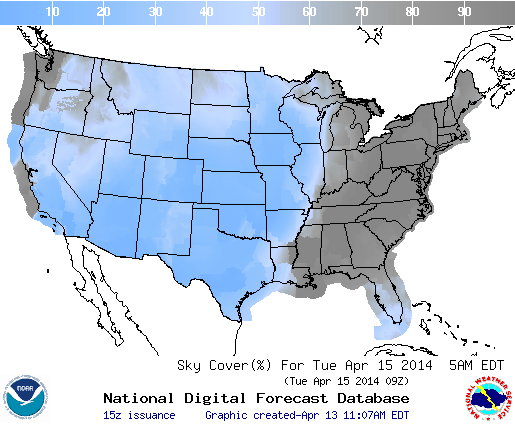
Now the bad news: things aren’t looking good for eastern North America. In fact, the dividing line between “cloudy” and “clear” runs right down through central Ontario and follows the Mississippi River at mid-eclipse, which occurs at 7:47 UT/3:47 AM EDT. There’s a high pressure front sweeping eastward, bringing rain and cloudy skies with it. The Florida peninsula and parts of New England and the Canadian Maritimes may have shots at viewing the eclipse through partly cloudy skies.
The National Oceanic and Atmospheric Administration maintains a great interactive site with graphical interactive forecasts, to include satellite maps. Another long-standing source of good info is the Weather Underground. For tailor-made astronomy forecasts, we’re checking Clear Sky Chart (formerly Clear Sky Clock) and SkippySky daily for upcoming prospects. A great feature in SkippySky is that it not only gives you cloud cover maps, but layers them with high versus middle and low clouds… again, a thin high cloud deck during the lunar eclipse could still mean game on!
Clouded out? There’s a half dozen webcasts planned for tonight’s lunar eclipse as well.
Dependable Slooh will have a live broadcast with commentary on the eclipse starting at 2AM EDT/6:00 UT:
Also, our good friends at the Virtual Telescope Project will be covering the lunar eclipse as part of their ongoing Global Astronomy Month campaign and will utilize several North American observers to cover the event:
NASA is also planning a broadcast out of the Marshall Space Flight Center of the eclipse along with a discussion on Reddit with NASA planetary scientist Renee Weber also starting at 2:00 AM EDT:
The Coca-Cola Space Science Center and Columbus State University also plans host a webcast of the lunar eclipse starting at 3:00 UT/11:00 PM EDT.
Also, the PBS Star Gazers project is planning on hosting a broadcast of the eclipse starting at 1:30 AM EDT/5:30 UT:
And finally, we hope to launch our very own initiation into the world of eclipse webcasting with an hour-long broadcast of the crucial phase transition from partial to total eclipse starting at 2:30 AM EDT/6:30 UT, weather willing:
Live streaming video by Ustream
And hey, word is that doomsday purveyor John Hagee is planning a broadcast of a more “End of the World” bent tonight as well. We didn’t know he was an astronomy fan…
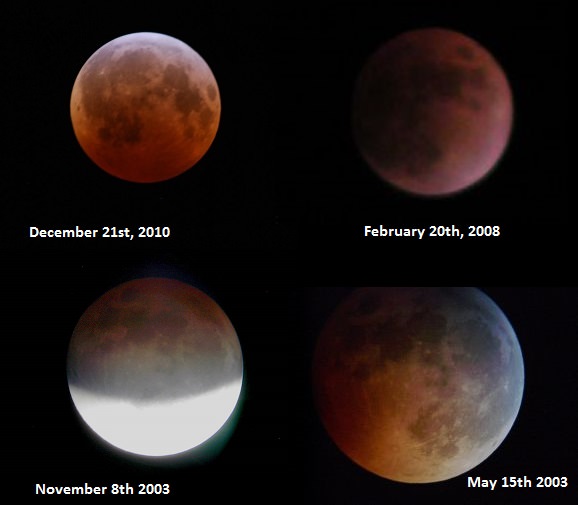
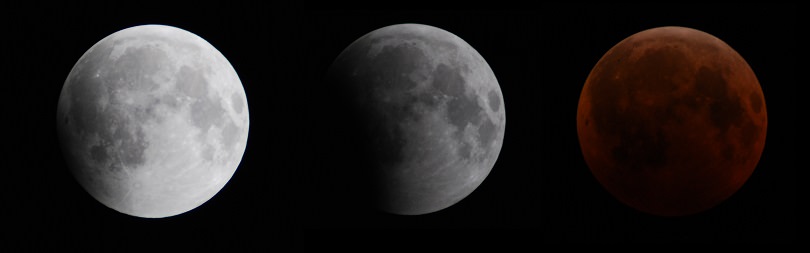
Prospects call for a brighter than normal eclipse, as atmospheric sciences professor at the University of Colorado Richard Keen notes that the Earth’s stratosphere is currently relatively clear of dust and volcanic ash. Still, we’ve been surprised before. The darkness and color of the eclipsed Moon is expressed on what’s known as the Danjon scale. As during eclipses previous, we’ll be data-mining Twitter for estimates and averages to see how they stack up… tweet those observations to #DanjonNumber.
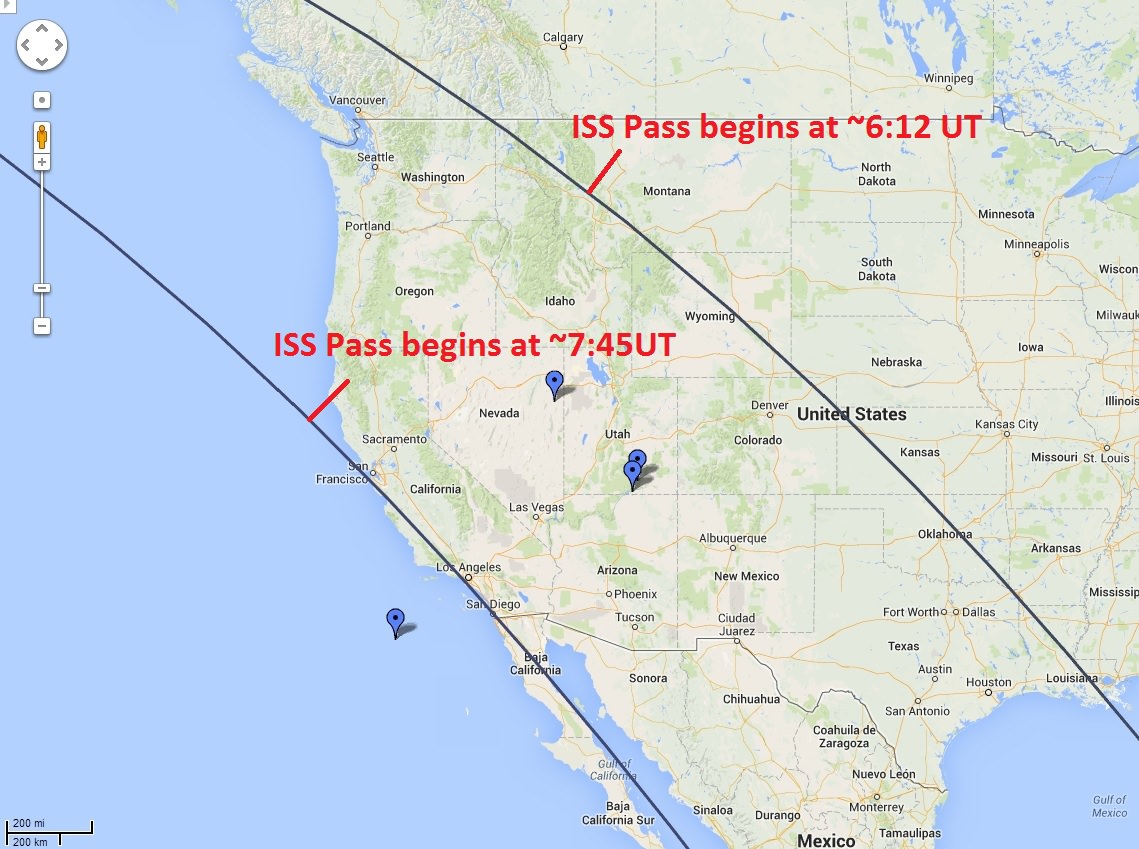
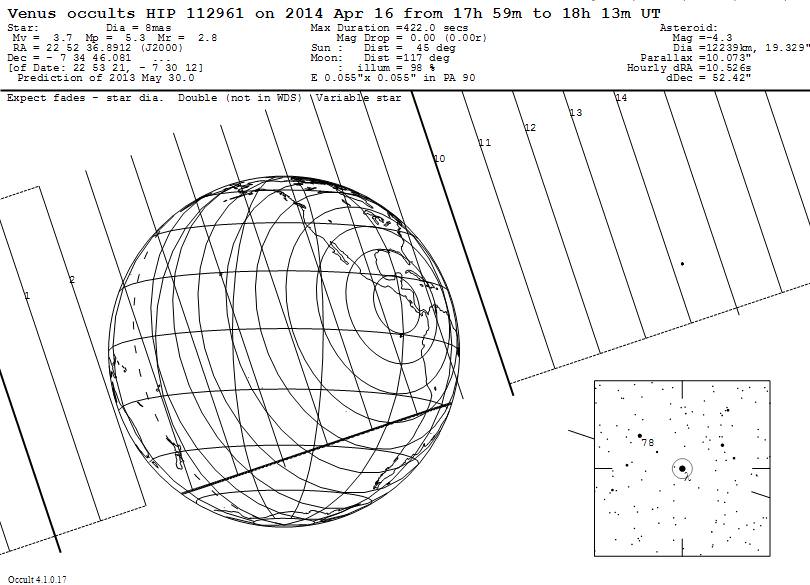
We also ran the possibilities for catching a shadow transit of the International Space Station in front of the eclipsed Moon for North American observers. To our knowledge, this has never been done before. Live near one of the two paths depicted above? You may be the first to accomplish this unusual feat. Check in with CALSky for specifics.
Finally, ever wonder when the next eclipse will occur during the Sunday night Virtual Star Party? If you’re like us, you consider and ponder such astronomical occurrences… and it turns out, the very last lunar eclipse in the current tetrad next year on September 28th, 2015 does just that. And stick around until July 13th, 2037 and we’ll have the first ever total solar eclipse occurring during the show… we just need someone in Australia to stream it!
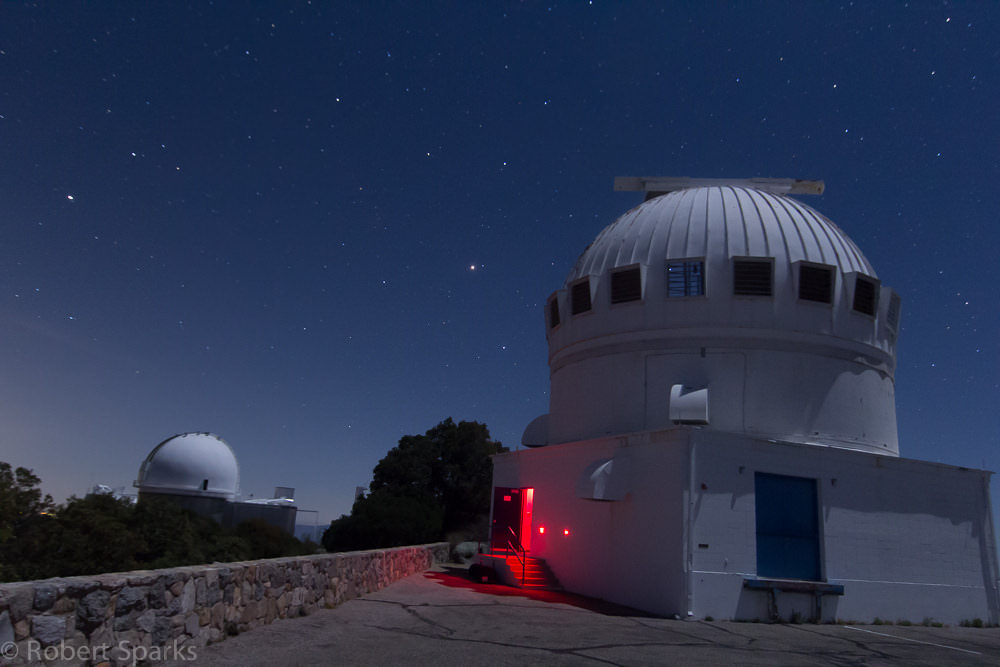
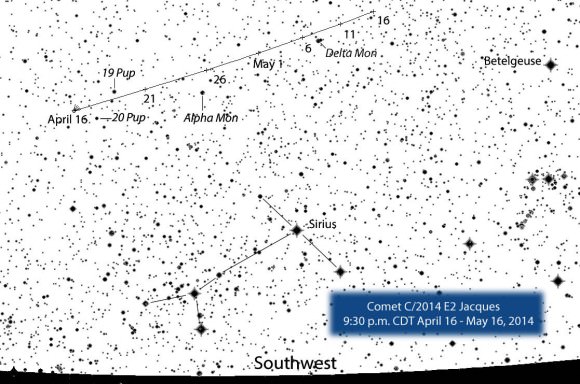
Tonight’s eclipse is number 56 of saros 122. Reader Rob Sparks notes that the last eclipse (55) in this series occurred on April 4th 1996 and also hosted an extra-special celestial treat, as Comet Hyakutake was just beginning to put on its memorable performance.
In short, don’t fear the “Blood Moon,” but do get out and catch tonight’s fine lunar eclipse… we’ll be doing a post-eclipse photo roundup tomorrow, so be sure to send those pics in to Universe Today!