Growing up, my sister played video games and I read books. Now that she has a one-year-old daughter we constantly argue over how her little girl should spend her time. Should she read books in order to increase her vocabulary and stretch her imagination? Or should she play video games in order to strengthen her hand-eye coordination and train her mind to find patterns?
I like to believe that I did so well in school because of my initial unadorned love for books. But I might be about to lose that argument as gamers prove their value in science and more specifically astronomy.
Take a quick look through Zooniverse and you’ll be amazed by the number of Citizen Science projects. You can explore the surface of the moon in Moon Zoo, determine how galaxies form in Galaxy Zoo and search for Earth-like planets in Planet Hunters.
In 2011 two citizen scientists made big news when they discovered two exoplanet candidates — demonstrating that human pattern recognition can easily compliment the powerful computer algorithms created by the Kepler team.
But now we’re introducing yet another Citizen Science project: Disk Detective.
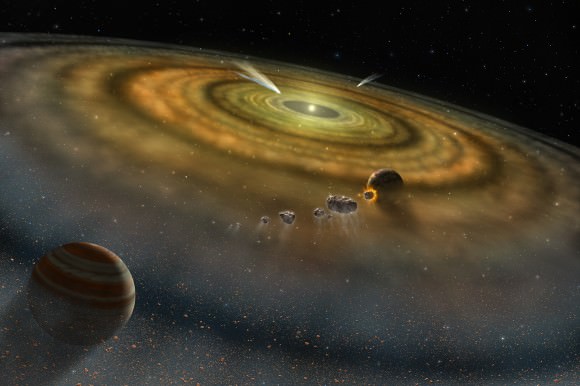
Planets form and grow within dusty circling planes of gas that surround young stars. However, there are many outstanding questions and details within this process that still elude us. The best way to better understand how planets form is to directly image nearby planetary nurseries. But first we have to find them.
“Through Disk Detective, volunteers will help the astronomical community discover new planetary nurseries that will become future targets for NASA’s Hubble Space Telescope and its successor, the James Webb Space Telescope,” said the chief scientist for NASA Goddard’s Sciences and Exploration Directorate, James Garvin, in a press release.
NASA’s Wide-field Infrared Survey Explorer (WISE) scanned the entire sky at infrared wavelengths for a year. It took detailed measurements of more than 745 million objects.
Astronomers have used complex computer algorithms to search this vast amount of data for objects that glow bright in the infrared. But now they’re calling on your help. Not only do planetary nurseries glow in the infrared but so do galaxies, interstellar dust clouds and asteroids.
While there’s likely to be thousands of planetary nurseries glowing bright in the data, we have to separate them from everything else. And the only way to do this is to inspect every single image by eye — a monumental challenge for any astronomer — hence the invention of Disk Detective.
Brief animations allow the user to help classify the object based on relatively simple criteria, such as whether or not the object is round or if there are multiple objects.
“Disk Detective’s simple and engaging interface allows volunteers from all over the world to participate in cutting-edge astronomy research that wouldn’t even be possible without their efforts,” said Laura Whyte, director of Citizen Science at the Adler Planetarium in Chicago, Ill.
The project is hoping to find two types of developing planetary environments, distinguished by their age. The first, known as a young stellar object disk is, well, young. It’s less than 5 million years old and contains large quantities of gas. The second, known as a debris disk, is older than 5 million years. It contains no gas but instead belts of rocky or icy debris similar to our very own asteroid and Kupier belts.
So what are you waiting for? Head to Disk Detective and help astronomers understand how complex worlds form in dusty disks of gas. The book will be there when you get back.
Call it the eclipse nobody saw. NASA’s Solar Dynamics Observatory (SDO) got its own private solar eclipse showing from its geosynchronous orbital perch today. Twice a year during new phase, the moon glides in front of the sun from the observatory’s perspective. Although we can’t be there in person to see it, the remote view isn’t too shabby. The events are called lunar transits rather than eclipses since they’re seen from outer space. Transits typically last about a half hour, but at 2.5 hours, today’s was one of the longest ever recorded. The next one occurs on July 26, 2014.
Today’s lunar transit of the sun followed by a strong solar flare
When an eclipse ends, the fun is usually over, but not this time. Just as the moon slid off the sun’s fiery disk, a strong M6.6 solar flare exploded from within a new, very active sunspot group rounding the eastern limb and blasted a CME (coronal mass ejection) into space. What a show!
SDO circles Earth in a geosynchronous orbit about 22,000 miles high and photographs the sun continuously day and night from a vantage point high above Mexico and the Pacific Ocean. About 1.5 terabytes of solar data or the equivalent of half a million songs from iTunes are downloaded to antennas in White Sands, New Mexico every day.
For comparison, the space station, which orbits much closer to Earth, would make a poor solar observatory, since Earth blocks the sun for half of every 90 minute orbit.
When you look at the still pictures and video, notice how distinct the edge of the moon appears. With virtually no atmosphere, the moon takes a “sharp” bite out of the sun.
SDO amazes with its spectacular pictures of the sun taken in 10 different wavelengths of light every 10 seconds; additional instruments study vibrations on the sun’s surface, magnetic fields and how much UV radiation the sun pours into space.
Compared to all the hard science, the twice a year transits are a sweet side benefit much like the cherries topping a sundae.
You can make your own movie of today’s partial eclipse by visiting the SDO websiteand following these easy steps:
* Click on the Data tab and select AIA/HMI Browse Data
* Click on the Enter Start Date window, select a start date and time and click Done
* Click on Enter End Date and click Done
* Under Telescopes, pick the color (wavelength) sun you want
* Select View in the display box
* Click Submit at the bottom and watch a video of your selected pictures
By now, you will probably have heard that astronomers have produced the first global weather map for a brown dwarf. (If you haven’t, you can find the story here.) May be you’ve even built the cube model or the origami balloon model of the surface of the brown dwarf Luhman 16B the researchers provided (here).
Since one of my hats is that of public information officer at the Max Planck Institute for Astronomy, where most of the map-making took place, I was involved in writing a press release about the result. But one aspect that I found particularly interesting didn’t get much coverage there. It’s that this particular bit of research is a good example of how fast-paced astronomy can be these days, and, more generally, it shows how astronomical research works. So here’s a behind-the-scenes look – a making-of, if you will – for the first brown dwarf surface map (see image on the right).
As in other sciences, if you want to be a successful astronomer, you need to do something new, and go beyond what’s been done before. That, after all, is what publishable new results are all about. Sometimes, such progress is driven by larger telescopes and more sensitive instruments becoming available. Sometimes, it’s about effort and patience, such as surveying a large number of objects and drawing conclusion from the data you’ve won.
Ingenuity plays a significant role. Think of the telescopes, instruments and analytical methods developed by astronomers as the tools in a constantly growing tool box. One way of obtaining new results is to combine these tools in new ways, or to apply them to new objects.
That’s why our opening scene is nothing special in astronomy: It shows Ian Crossfield, a post-doctoral researcher at the Max Planck Institute for Astronomy, and a number of colleagues (including institute director Thomas Henning) in early March 2013, discussing the possibility of applying one particular method of mapping stellar surfaces to a class of objects that had never been mapped in this way before.
The method is called Doppler imaging. It makes use of the fact that light from a rotating star is slightly shifted in frequency as the star rotates. As different parts of the stellar surfaces go by, whisked around by the star’s rotation, the frequency shifts vary slightly different depending on where the light-emitting region is located on the star. From these systematic variations, an approximate map of the stellar surface can be reconstructed, showing darker and brighter areas. Stars are much too distant for even the largest current telescopes to discern surface details, but in this way, a surface map can be reconstructed indirectly.
The method itself isn’t new. The basic concept was invented in the late 1950s, and the 1980s saw several applications to bright, slowly rotating stars, with astronomers using Doppler imaging to map those stars’ spots (dark patches on a stellar surface; the stellar analogue to Sun spots).
Crossfield and his colleagues were wondering: Could this method be applied to a brown dwarf – an intermediary between planet and star, more massive than a planet, but with insufficient mass for nuclear fusion to ignite in the object’s core, turning it into a star? Sadly, some quick calculations, taking into account what current telescopes and instruments can and cannot do as well as the properties of known brown dwarfs, showed that it wouldn’t work.
The available targets were too faint, and Doppler imaging needs lots of light: for one because you need to split the available light into the myriad colors of a spectrum, and also because you need to take many different rather short measurements – after all, you need to monitor how the subtle frequency shifts caused by the Doppler effect change over time.
So far, so ordinary. Most discussions of how to make observations of a completely new type probably come to the conclusion that it cannot be done – or cannot be done yet. But in this case, another driver of astronomical progress made an appearance: The discovery of new objects.
On March 11, Kevin Luhman, an astronomer at Penn State University, announced a momentous discovery: Using data from NASA’s Wide-field Infrared Survey Explorer (WISE), he had identified a system of two brown dwarfs orbiting each other. Remarkably, this system was at a distance of a mere 6.5 light-years from Earth. Only the Alpha Centauri star system and Barnard’s star are closer to Earth than that. In fact, Barnard’s star was the last time an object was discovered to be that close to our Solar system – and that discovery was made in 1916.
Modern astronomers are not known for coming up with snappy names, and the new object, which was designated WISE J104915.57-531906.1, was no exception. To be fair, this is not meant to be a real name; it’s a combination of the discovery instrument WISE with the system’s coordinates in the sky. Later, the alternative designation “Luhman 16AB” for the system was proposed, as this was the 16th binary system discovered by Kevin Luhman, with A and B denoting the binary system’s two components.
These days, the Internet gives the astronomical community immediate access to new discoveries as soon as they are announced. Many, probably most astronomers begin their working day by browsing recent submissions to astro-ph, the astrophysical section of the arXiv, an international repository of scientific papers. With a few exceptions – some journals insist on exclusive publication rights for at least a while –, this is where, in most cases, astronomers will get their first glimpse of their colleagues’ latest research papers.
Luhman posted his paper “Discovery of a Binary Brown Dwarf at 2 Parsecs from the Sun” on astro-ph on March 11. For Crossfield and his colleagues at MPIA, this was a game-changer. Suddenly, here was a brown dwarf for which Doppler imaging could conceivably work, and yield the first ever surface map of a brown dwarf.
However, it would still take the light-gathering power of one of the largest telescopes in the world to make this happen, and observation time on such telescopes is in high demand. Crossfield and his colleagues decided they needed to apply one more test before they would apply. Any object suitable for Doppler imaging will flicker ever so slightly, growing slightly brighter and darker in turn as brighter or darker surface areas rotate into view. Did Luhman 16A or 16B flicker – in astronomer-speak: did one of them, or perhaps both, show high variability?
Astronomy comes with its own time scales. Communication via the Internet is fast. But if you have a new idea, then ordinarily, you can’t just wait for night to fall and point your telescope accordingly. You need to get an observation proposal accepted, and this process takes time – typically between half a year and a year between your proposal and the actual observations. Also, applying is anything but a formality. Large facilities, like the European Southern Observatory’s Very Large Telescopes, or space telescopes like the Hubble, typically receive applications for more than 5 times the amount of observing time that is actually available.
But there’s a short-cut – a way for particularly promising or time-critical observing projects to be completed much faster. It’s known as “Director’s Discretionary Time”, as the observatory director – or a deputy – are entitled to distribute this chunk of observing time at their discretion.
On April 2, Beth Biller, another MPIA post-doc (she is now at the University of Edinburgh), applied for Director’s Discretionary Time on the MPG/ESO 2.2 m telescope at ESO’s La Silla observatory in Chile. The proposal was approved the same day.
Biller’s proposal was to study Luhman 16A and 16B with an instrument called GROND. The instrument had been developed to study the afterglows of powerful, distant explosions known as gamma ray bursts. With ordinary astronomical objects, astronomers can take their time. These objects will not change much over the few hours an astronomer makes observations, first using one filter to capture one range of wavelengths (think “light of one color”), then another filter for another wavelength range. (Astronomical images usually capture one range of wavelengths – one color – at a time. If you look at a color image, it’s usually the result of a series of observations, one color filter at a time.)
Gamma ray bursts and other transient phenomena are different. Their properties can change on a time scale of minutes, leaving no time for consecutive observations. That is why GROND allows for simultaneous observations of seven different colors.
Biller had proposed to use GROND’s unique capability for recording brightness variations for Luhman 16A and 16B in seven different colors simultaneously – a kind of measurement that had never been done before at this scale. The most simultaneous information researchers had gotten from a brown dwarf had been at two different wavelengths (work by Esther Buenzli, then at the University of Arizona’s Steward Observatory, and colleagues). Biller was going for seven. As slightly different wavelength regimes contain information about gas at slightly different colors, such measurements promised insight into the layer structure of these brown dwarfs – with different temperatures corresponding to different atmospheric layers at different heights.
For Crossfield and his colleagues – Biller among them –, such a measurement of brightness variations should also show whether or not one of the brown dwarfs was a good candidate for Doppler imaging.
As it turned out, they didn’t even have to wait that long. A group of astronomers around Michaël Gillon had pointed the small robotic telescope TRAPPIST, designed for detecting exoplanets by the brightness variations they cause when passing between their host star and an observer on Earth, to Luhman 16AB. The same day that Biller had applied for observing time, and her application been approved, the TRAPPIST group published a paper “Fast-evolving weather for the coolest of our two new substellar neighbours”, charting brightness variations for Luhman 16B.
This news caught Crossfield thousands of miles from home. Some astronomical observations do not require astronomers to leave their cozy offices – the proposal is sent to staff astronomers at one of the large telescopes, who make the observations once the conditions are right and send the data back via Internet. But other types of observations do require astronomers to travel to whatever telescope is being used – to Chile, say, to or to Hawaii.
When the brightness variations for Luhman 16B were announced, Crossfield was observing in Hawaii. He and his colleagues realized right away that, given the new results, Luhman 16B had moved from being a possible candidate for the Doppler imaging technique to being a promising one. On the flight from Hawaii back to Frankfurt, Crossfield quickly wrote an urgent observing proposal for Director’s Discretionary Time on CRIRES, a spectrograph installed on one of the 8 meter Very Large Telescopes (VLT) at ESO’s Paranal observatory in Chile, submitting his application on April 5. Five days later, the proposal was accepted.
On May 5, the giant 8 meter mirror of Antu, one of the four Unit Telescopes of the Very Large Telescope, turned towards the Southern constellation Vela (the “Sail of the Ship”). The light it collected was funneled into CRIRES, a high-resolution infrared spectrograph that is cooled down to about -200 degrees Celsius (-330 Fahrenheit) for better sensitivity.
Three and two weeks earlier, respectively, Biller’s observations had yielded rich data about the variability of both the brown dwarfs in the intended seven different wavelength bands.
At this point, no more than two months had passed between the original idea and the observations. But paraphrasing Edison’s famous quip, observational astronomy is 1% observation and 99% evaluation, as the raw data are analyzed, corrected, compared with models and inferences made about the properties of the observed objects.
For Beth Biller’s multi-wavelength monitoring of brightness variations, this took about five months. In early September, Biller and 17 coauthors, Crossfield and numerous other MPIA colleagues among them, submitted their article to the Astrophysical Journal Letters (ApJL) after some revisions, it was accepted on October 17. From October 18 onward, the results were accessible online at astro-ph, and a month later they were published on the ApJL website.
In late September, Crossfield and his colleagues had finished their Doppler imaging analysis of the CRIRES data. Results of such an analysis are never 100% certain, but the astronomers had found the most probable structure of the surface of Luhman 16B: a pattern of brighter and darker spots; clouds made of iron and other minerals drifting on hydrogen gas.
As is usual in the field, the text they submitted to the journal Nature was sent out to a referee – a scientist, who remains anonymous, and who gives recommendations to the journal’s editors whether or not a particular article should be published. Most of the time, even for an article the referee thinks should be published, he or she has some recommendations for improvement. After some revisions, Nature accepted the Crossfield et al. article in late December 2013.
With Nature, you are only allowed to publish the final, revised version on astro-ph or similar servers no less than 6 month after the publication in the journal. So while a number of colleagues will have heard about the brown dwarf map on January 9 at a session at the 223rd Meeting of the American Astronomical Society, in Washington, D.C., for the wider astronomical community, the online publication, on January 29, 2014, will have been the first glimpse of this new result. And you can bet that, seeing the brown dwarf map, a number of them will have started thinking about what else one could do. Stay tuned for the next generation of results.
And there you have it: 10 months of astronomical research, from idea to publication, resulting in the first surface map of a brown dwarf (Crossfield et al.) and the first seven-wavelength-bands-study of brightness variations of two brown dwarfs (Biller et al.). Taken together, the studies provide fascinating image of complex weather patterns on an object somewhere between a planet and a star the beginning of a new era for brown dwarf study, and an important step towards another goal: detailed surface maps of giant gas planets around other stars.
On a more personal note, this was my first ever press release to be picked up by the Weather Channel.
Think the weather is nasty this winter here on Earth? Try vacationing on the brown dwarf Luhman 16B sometime.
Two studies out this week from the Max Planck Institute for Astronomy based at Heidelberg, Germany offer the first look at the atmospheric features of a brown dwarf.
A brown dwarf is a substellar object which bridges the gap between at high mass planet at over 13 Jupiter masses, and a low mass red dwarf star at above 75 Jupiter masses. To date, few brown dwarfs have been directly imaged. For the study, researchers used the recently discovered brown dwarf pair Luhman 16A & B. At about 45(A) and 40(B) Jupiter masses, the pair is 6.5 light years distant and located in the constellation Vela. Only Alpha Centauri and Barnard’s Star are closer to Earth. Luhman A is an L-type brown dwarf, while the B component is a T-type substellar object.
“Previous observations have inferred that brown dwarfs have mottled surfaces, but now we can start to directly map them.” Ian Crossfield of the Max Planck Institute for Astronomy said in this week’s press release. “What we see is presumably patchy cloud cover, somewhat like we see on Jupiter.”
To construct these images, astronomers used an indirect technique known as Doppler imaging. This method takes advantage of the minute shifts observed as the rotating features on brown dwarf approach and recede from the observer. Doppler speeds of features can also hint at the latitudes being observed as well as the body’s inclination or tilt to our line of sight.
But you won’t need a jacket, as researchers gauge the weather on Luhman 16B be in the 1100 degrees Celsius range, with a rain of molten iron in a predominately hydrogen atmosphere.
The study was carried out using the CRyogenic InfraRed Echelle Spectrograph (CRIRES) mounted on the 8-metre Very Large Telescope based at the European Southern Observatory’s (ESO) Paranal observatory complex in Chile. CRIRES obtained the spectra necessary to re-construct the brown dwarf map, while backup brightness measurements were accomplished using the GROND (Gamma-Ray Burst Optical/Near-Infrared Detector) astronomical camera affixed to the 2.2 metre telescope at the ESO La Silla Observatory.
The next phase of observations will involve imaging brown dwarfs using the Spectro-Polarimetric High-contrast Exoplanet Research (SPHERE) instrument, set to go online at the Very Large Telescope facility later this year.
And that may just usher in a new era of directly imaging features on objects beyond our solar system, including exoplanets.
“The exciting bit is that this is just the start. With the next generations of telescopes, and in particular the 39-metre European Large Telescope, we will likely see surface maps of more distant brown dwarfs — and eventually, a surface map for a young giant planet,” said Beth Biller, a researcher previously based at the Max Planck Institute and now based at the University of Edinburgh. Biller’s study of the pair went even more in-depth, analyzing changes in brightness at different wavelengths to peer into the atmospheric structure of the brown dwarfs at varying depths.
“We’ve learned that the weather pattern on these brown dwarfs are quite complex,” Biller said. “The cloud structure of the brown dwarf varies quite strongly as a function of atmospheric depth and cannot be explained with single layer clouds.”
The paper on brown dwarf weather pattern map comes out today in the January 30th, 2014 edition of Nature under the title Mapping Patchy Clouds on a Nearby Brown Dwarf.
The brown dwarf pair targeted in the study was designated Luhman 16A & B after Pennsylvania State University researcher Kevin Luhman, who discovered the pair in mid-March, 2013. Luhman has discovered 16 binary systems to date. The WISE catalog designation for the system has the much more cumbersome and phone number-esque designation of WISE J104915.57-531906.1.
We caught up with the researchers to ask them some specifics on the orientation and rotation of the pair.
“The rotation period of Luhman 16B was previously measured watching the brown dwarf’s globally-averaged brightness changes over many days. Luhman 16A seems to have a uniformly thick layer of clouds, so it exhibits no such variation and we don’t yet know its period,” Crossfield told Universe Today. “We can estimate the inclination of the rotation axis because we know the rotation period, we know how big brown dwarfs are, and in our study, we measured the “projected” rotational velocity. From this, we know we must be seeing the brown dwarf near equator-on.”
The maps constructed correspond with an amazingly fast rotation period of just under 6 hours for Luhman 16B. For context, the planet Jupiter – one of the fastest rotators in our solar system – spins once every 9.9 hours.
“The rotational period of Luhman 16B is known from 12 nights of variability monitoring,” Biller told Universe Today. “The variability in the B component is consistent with the results from 2013, but the A component has a lower amplitude of variability and a somewhat different rotational period of maybe 3-4 hours, but that is still a very tentative result.”
This first mapping of the cloud patterns on a brown dwarf is a landmark, and promises to provide a much better understanding of this transitional class of objects.
Couple this announcement with the recent nearby brown dwarf captured in a direct image, and its apparent that a new era of exoplanet science is upon us, one where we’ll not only be able to confirm the existence of distant worlds and substellar objects, but characterize what they’re actually like.
Who knows what the future holds for our Sun? Dr. Mark Morris, a professor of astronomy at UCLA sure knows. Professor Morris sat down with us to let us know what we’re in for over the next few billions years.
“Hi, I’m Professor Mark Morris. I’m teaching at UCLA where I also carry out my research. I work on the center of the galaxy and what’s going on there – in this fabulous arena there, and on dying stars – stars that have reached the end of their lifetime and are putting on a display for us as they do so.”
What is the future of our sun?
“Well, there’s every expectation that in about 5 billion more years, that our sun will swell up to become a red giant. And then, as it gets larger and larger, it will eventually become what’s called an asymptotic giant branch star – a star whose radius is just under the distance between the sun and the Earth – one astronomical unit in size. So the Earth will be literally skimming the surface of the red giant sun when it’s an asymptotic giant branch star.”
“A star that big is also cool because they’re cold – red hot versus blue hot or yellow hot like our sun. Because it’s cold, a red giant star at its surface layers can keep all of its elements in the gas phase. So some of the heavier elements – the metals and the silicates – condense out as small dust grains, and when these elements condense out as solids, then radiation pressure from this very luminous giant star pushes the dust grains out. That may seem like a minor issue, but in fact these dust grains carry the gas with them. And so the star literally expels its atmosphere, and goes from a red giant star to a white dwarf, when finally the core of the star is exposed. Now, as it’s doing this, that hot core of the star is still very luminous and lights up through a fluorescent process, this out-flowing envelope, this atmosphere that was once a star, and that’s what produces these beautiful displays that are called planetary nebulae.”
“Now, planetary nebulae can be these beautiful round, spherical objects, or they can be bipolar, which is one of the mysteries that we’re working here is trying to understand why, at some stage, a star suddenly becomes axisymmetric – in other words, is sending out is’s atmosphere in two diametrically opposed directions predominantly, rather than continuing to lose mass spherically.”
“We can’t invoke rotation of the star – that would be one way to get a preferred axis, but stars don’t rotate fast enough. If you take the sun and let it expand to become a red giant, then by the conservation of angular momentum, it literally won’t be spinning at all. It’ll be spinning so slowly that it’ll literally have no effect. So we can’t invoke spin, so there must be something going on deep down inside the star, that when you finally expose some rapidly spinning core, it can have an effect.”
“Or, all of the stars that we see as planetary nebula can have binary companions, that could be massive planets or relatively low mass stars that themselves can impose an angular momentum orientation on the system. This is in fact an idea that I’ve been championing for decades now, and it has some traction. There’s a lot of planetary nebula nuclei, the white dwarves, that seem to have companions near them that are suspect for having been responsible for helping strip the atmosphere of the mass-losing red giant star but also providing a preferred axis along which the ejected matter can flow.”
Like millionaires that burn through their cash too quickly, astronomers have found one factor behind why compact elliptical galaxies stopped growing stars about 11 billion years ago: they ate through their gas reserves.
The revelation comes as researchers released a new evolutionary track for compact elliptical galaxies that stopped their star formation when the universe was just three billion years old. When these galaxies ran out of gas, some of them cannibalized smaller galaxies to create giant elliptical galaxies. The “burned-out”galaxies have stars crowding 10 to 100 times more densely than elliptical galaxies formed more recently through a different evolutionary track.
“We at last show how these compact galaxies can form, how it happened, and when it happened. This basically is the missing piece in the understanding of how the most massive galaxies formed, and how they evolved into the giant ellipticals of today,” stated Sune Toft, who led the study and is a researcher at the Dark Cosmology Center at the Niels Bohr Institute in Copenhagen.
“This had been a great mystery for many years, because just three billion years after the Big Bang we see that half of the most massive galaxies have already completed their star formation.”
The team got a snapshot of these galaxies’ evolution by looking at a representative sample with the Hubble Space Telescope, specifically through the Cosmic Assembly Near-Infrared Deep Extragalactic Legacy Survey (CANDELS) and a spectroscopic survey called 3D-HST. To find out how old the stars were, they combined the Hubble work with data gathered from the Spitzer Space Telescope and the Subaru Telescope in Hawaii.
Next, they examined ancient, fast-star-forming submillimeter galaxies with data gathered from a range of space and ground-based telescopes.
“This multi-spectral information, stretching from optical light through submillimeter wavelengths, yielded a full suite of information about the sizes, stellar masses, star-formation rates, dust content, and precise distances of the dust-enshrouded galaxies that were present early in the universe,” Hubble’s news center stated.
The group found that that the submillimeter galaxies were likely “progenitors” of compact elliptical galaxies, as they share predicted characteristics of the ancestors. Further, researchers calculated that starbursts in submillimeter galaxies only went on for about 40 million years before the galaxies ran out of gas.
One of the big ticket astronomical events of 2014 will be the close passage of Comet C/2013 A1 Siding Spring past the planet Mars in October 2014. Discovered just over a year ago from the Australian-based Siding Spring Observatory, this comet generated a surge of excitement in the astronomical community when it was discovered that it was going to pass very close to the planet Mars in late 2014.
Now, a fleet of spacecraft are poised to study the comet in unprecedented detail. Some of the first space-based observations of the comet have been conducted by NASA’s Hubble Space Telescope and the recently reactivated NEOWISE mission. And although the comet may not look like much yet in the infrared eyes of NEOWISE, its estimated 4 kilometre in diameter nucleus is already active and shedding about 100 kilograms of dust per second.
And although an impact has been since ruled out, it’s that dust that may present a hazard for Mars orbiting spacecraft, as well as a unique scientific observing opportunity.
“Our plans for using spacecraft at Mars to observe Comet A1 Siding Spring will be coordinated with plans for how the orbiters will duck and cover, if we need to do so that,” said NASA/JPL Mars Exploration Program chief scientist Rich Zurek.
Comet A1 Siding Spring is projected to pass within just 138,000 kilometres of Mars on October 19th, 2014. This is one-third the Earth-Moon distance, and 10 times closer than the closest recorded passage of a comet by the Earth, which was Comet D/1770 Lexell in the late 18th century. The comet will also miss the Martian moons of Phobos and Deimos, which have the closest orbits of any moons in the solar system at just 5,989 and 20,063 kilometres above the surface of Mars, respectively.
Assets in orbit around the Red Planet are also slated to observe the close approach and passage of Comet A1 Siding Spring, as well as any extraterrestrial meteor shower that its dust may generate.
“We could learn about the nucleus – its shape, its rotation, whether some areas on its surface are darker than others,” Zurek said in a recent NASA/JPL press release.
The rovers Curiosity and Opportunity are currently active on the surface of Mars. Above in orbit, we’ve got the European Space Agency’s Mars Express, and NASA’s Mars Odyssey and the Mars Reconnaissance Orbiter (MRO). These will be joined by India’s Mars Orbiter Mission and NASA’s Mars Atmosphere and Volatile Evolution (MAVEN) spacecraft just weeks prior to the comet’s passage.
“A third aspect for investigation could be what effect the infalling particles have on the upper atmosphere of Mars,” Zurek said. “They might heat it and expand it, not unlike the effect of a global dust storm.”
Just last year, Mars based spacecraft caught sight of the ill-fated sungrazer Comet C/2012 S1 ISON as it passed Mars. But that dim passage yielded a scant pixel-sized view in the eyes of MRO’s HiRISE camera; Comet A1 Siding Spring will pass 80 times closer than Comet ISON and could yield a view of its nucleus dozens of pixels across.
Though the tenuous Martian atmosphere will shield to surface rovers from any micro-meteoroid impacts, they may also be witness to a surreptitious meteor shower from the debris shed by the comet, a first seen from the surface of another world.
But engineers will also be assessing the potential hazards that said particles may posed to spacecraft orbiting Mars as well.
“It’s way too early for us to know how much of a threat Siding Spring will be to our orbiters,” said JPL’s Mars Exploration Program chief engineer Soren Madsen recently. “It could go either way. It could be a huge deal or it could be nothing – or anything in between.”
In a worst case scenario, Mars orbiting spacecraft would be shuttered and oriented to “shelter in place” as the dust from the comet passes. There’s precedent for this in Earth orbit, as precious assets such as the Hubble Space Telescope were closed for business during the Leonid meteor storm of 1998.
“How active will Siding Spring be in April and May? We’ll be watching that,” Madsen continued. “But if the red alarm starts sounding in May, it would be too late to start planning how to respond. That’s why we’re doing what we’re doing right now.”
Comet A1 Siding Spring was the first comet discovered in 2013 at 7.2 Astronomical Units (AUs) distant. From our Earth based perspective, the comet will reach opposition on August 25th at 0.96 AU from the Earth, and approach 7’ from Mars on October 19th in the constellation Ophiuchus in evening skies. The comet reaches perihelion just 4 days later, and is slated to be a binocular comet around that time shining at magnitude +8.
The comet nucleus itself is moving in a retrograde orbit relative to Mars. Particles from A1 Siding Spring will slam into the atmosphere of Mars — and any spacecraft that happens to be in their way — at a velocity of 56 kilometres per second. For context, the recent January Quadrantids have a more sedate atmospheric impact velocity of 41 kilometres a second.
The unfolding 2014 drama of “Mars versus the Comet” will definitely be worth keeping an eye on… more to come!
If you could get a good look at the environment around a supermassive black hole — which is a black hole often found in the center of the galaxy — what factors would make that black hole keep going?
A Japanese study revealed that at least one of these black holes stay “active and luminous” by gobbling up nearby material, but notes that only a few of the observed galaxies that are merging have these types of black holes. This must mean something unique arises in the environment near the black hole to get it going, the researchers say. What that is, though, is still poorly understood.
Supermassive black holes, defined as black holes that have a million times the mass of the sun or more, reside in galaxy centers. “The merger of gas-rich galaxies with SMBHs [supermassive black holes] in their centers not only causes active star formation, but also stimulates mass accretion onto the existing SMBHs,” stated a press release from the Subaru Telescope.
“When material accretes onto a SMBH, the accretion disk surrounding the black hole becomes very hot from the release of gravitational energy, and it becomes very luminous. This process is referred to as active galactic nucleus (AGN) activity; it is different from the energy generation activity by nuclear fusion reactions within stars.”
Figuring out how these types of activity vary would give a clue as to how galaxies come together, the researchers said, but it’s hard to see anything in action because of dust and gas blocking the view of optical telescopes. That’s why infrared observations come in so handy, because it makes it easier to peer through the debris. (You can see some examples from this research below.)
The team (led by the National Astronomical Observatory of Japan’s Masatoshi Imanishi) used NAOJ’s Subaru’s Infrared Camera and Spectrograph (IRCS) and the telescope’s adaptive optics system in two bands of infrared. Researchers looked at 29 luminous gas-rich merging galaxies in the infrared and found “at least” one active supermassive black hole in all but one of the ones studied. However, only four of these galaxies merging had multiple, active black holes.
“The team’s results mean that not all SMBHs in gas-rich merging galaxies are actively mass accreting, and that multiple SMBHs may have considerably different mass accretion rates onto SMBHs,” Subaru stated.
The implication is more about the environment around a supermassive black hole must be understood to figure out how mass accretes. Knowing more about this will improve computer simulations of galaxy mergers, the researchers said.
There’s an often told anecdote that astronomer Nicolaus Copernicus never spied Mercury. And while this tale is almost certainly apocryphal, it does speak to just how elusive the innermost planet of our solar system really is.
Never seen Mercury for yourself? This final week of January offers a good time to try, as Mercury reaches greatest elongation east of the Sun on Friday, January 31st.
This will offer northern hemisphere viewers one on the best chances to spot the fleeting world low to the west immediately after local sunset. And although we get on average six apparitions of Mercury per year – three each in the dawn and dusk – all apparitions aren’t created equal.
The approximate moment of greatest elongation occurs on January 31st at 10:00 UT / 5:00 AM EST, when Mercury is 18.4 degrees east of the Sun. This is only 0.5 degrees shy of the smallest elongation for Mercury that can occur, as the planet reaches perihelion just three days later on February 3rd at 0.3075 Astronomical Units (AUs) from the Sun. The last time this was surpassed was the evening elongation of February 16th, 2013th, and the next time it’ll be topped is October 16th, 2015 at just 18.1 degrees from the Sun.
And though this elongation is closer than usual, this also works in the Mercury-spotter’s favor. At greatest elongation, Mercury will present a 50% illuminated 7 arc second disk, readily apparent in a small telescope. But a also means that Mercury will appear almost a full magnitude brighter than it does when it reaches greatest elongation near aphelion, as it last did on March 31st of last year, and will do again on March 14th of this year.
Mercury will shine at magnitude -0.4 low towards the west into this coming weekend. We managed to pick up Mercury with binoculars on January 16th and have since managed to start tracking the planet unaided since January 18th.
Mercury also has another factor going for it, in terms of the angle of the evening ecliptic. Following ahead of the Sun, Mercury occupies a space that the Sun will trace up its apparent path along the ecliptic as it begins its long slow crawl northward towards the Vernal Equinox on March 20th. This means that Mercury is almost perpendicular above the western horizon at dusk and is currently getting a maximum boost above the atmospheric murk.
Mercury also gets joined by a razor thin waxing crescent Moon just over 24 hours past New sliding by it on the evening of Friday, January 31st. Look for the Moon five degrees to the right of Mercury on the 31st. The Moon will be a much easier catch on the February 1st when its 10 degrees above Mercury. And can you spy the +1 magnitude star Fomalhaut in the constellation Piscis Austrinus just 20 degrees to the south of Mercury?
And speaking of the Moon, this week’s New Moon is the second of the month, a feat that repeats in March 2014 and leaves the month of February “New Moon-less…” such an occurrence in either instance is informally known as a Black Moon.
Orbiting the Sun once every 88 days, Mercury completes about 4.15 circuits of the Sun for every Earth year. From our Earthbound vantage point, however, Mercury seems to only orbit the Sun 3.15 times a year. Thus 6 elongations (3 in the dusk and 3 in the dawn) will occur every year, through 7 can occur, as last happened in 2011 and will occur again next year in 2015.
After this weekend, Mercury will resume its plunge towards the horizon through early February. Mercury will begin retrograde (westward) apparent motion against the starry background on February 6th before resuming direct (eastward motion) on February 27th. And although astrologers may find that “Mercury in retrograde” is a convenient “blame magnet,” they’re also falling prey to a logical fallacy known as retrofitting, as Mercury spends a longer fraction of time than any other planet “in retrograde” at about 20%!
From there, Mercury heads towards inferior conjunction between the Earth and the Sun on Saturday, February 15th, passing just 3.7 degrees north of the solar disk. You can catch Mercury entering into the field of view of the Solar Heliospheric Observatory’s (SOHO) LASCO C3 camera from February 12th to February 18th.
And although Mercury misses this time, we’re not that far away from the next transit of Mercury across the face of the Sun on May 9th, 2016.
Up for more? An even tougher challenge is to attempt to spot Mercury… in the daytime. We’ve noted this possibility before as Mercury reaches maximum elongation from the Sun while still in the negative magnitude range. Of course, you want to physically block the Sun out of view, and don’t even try sweeping the sky near the Sun visually with binoculars or a telescope! You’ll need a clear, blue sky for maximum contrast and a polarizing filter may help in your quest… but this should be possible under exceptional conditions.
Good luck, and be sure to send those Mercury pics in to Universe Today!
Bitter cold lies ahead for many skywatchers in the U.S. and Canada in the coming week as the polar vortex swoops down from Santa’s village for round two this season. Will that stop you from going out to enjoy the winter wonders of Jupiter, the M82 supernova and Orion? It needn’t if you take the proper precautions.
In all honesty, you’ll probably still get cold if you attempt to observe on windy, subzero nights, but if you follow these helpful hints, you won’t get as cold. That said, there are two key ingredients to a successful and happy night under the winter sky: dressing well and planning in advance what you want to see.
Dressing well means having to accept the fact that even though you still feel warm walking out the door, 10 minutes later you won’t be. Always layer to the hilt. Insulated pack boots like those made by Sorrel or LaCrosse will keep your feet toasty for at least an hour of standing in place at the telescope.
I still wear blue jeans during winter, but when out getting a winter star tan, I pull on a pair of insulated snow pants. To keep heat from escaping the rest of the body, a flannel shirt, thick sweater and some kind of down or insulated coat will provide protection right up to your neck. Some folks like the all-in-one approach and don a snowmobile suit. Add a scarf, a bomber cap with furry ear flaps for the head region and lined mittens or gloves for your digits, and you’re almost ready to do battle. Assuming you still have energy left after building a fortress around your person.
About gloves. I use lined deerskin gloves with chemical hand-warmers nestled in each palm. It’s so nice to have something warm to push your fingers into when they get chilled. Others prefer the wiser dual-glove approach – wearing a pair of thin gloves inside mittens that Velcro open across the palm. That way you use your fingers to adjust focus or check a chart and then safely tuck your hands back into the mittens.
On super-cold nights I’ll set the telescope up right outside the house so I can bail when necessary, but on exceptional nights when it might be well below zero but not windy, I’ll make the drive to the country for darker skies and set up on the proverbial road in the middle of nowhere.
I limit my observing to two hours maximum. Not because I have any control over time; that’s as much as this body can take when it’s -20 F. One little trick I’ve employed over the years to survive astronomical cold is to keep moving. I check charts constantly, set eyepieces down in the trunk of the car, then return to pick up a different eyepiece, take a short walk and even run in place. Hey, only the wolves are watching, so who cares? All this to keep the body moving to generate heat.
If I do freeze, the car provides some solace. A typical drive home will find me steering with my inner arms, my crabbed hands straining to absorb every molecules of hot air blasting from the vents
The second key ingredient to a successful, soulful, subzero night is planning. If you prepare a short list either on paper or mentally of winter sky gems before you walk out the door, you’ll spend your stellar minutes more efficiently and return indoors a happy camper.
I keep it simple. If there’s a bright planet out, that’s always on my list. With Jupiter shining so enticingly these nights, how can you not go out to see what the weather’s doing on the solar system’s biggest planet? Relish the thought that the cloud tops you’re seeing are cold enough at -230 F (-145 C) to snow ammonia flakes. Makes 20 below almost seem like shirtsleeve weather.
Add in a few variable stars, a supernova, maybe a comet and two or three deep sky objects and I feel a sense of connection and accomplishment by the time I return inside to what now feels like a Hawaiian vacation in my living room. Total time elapsed: maybe an hour. Too much? 15 minutes for a pretty double star and a current planet will do. Astronomy photos, articles and book are great, but we all need the real thing from time to time; there’s no substitute for a direct connection to the cosmic wilderness.
One crucial tip on doing astronomy in winter. Make sure your telescope is COLD. A spare meat locker for storage would be ideal. Barring that, place the scope outside and let it cool down before you begin your observing session. If it comes directly from the house, 45 minutes to an hour should be enough, depending on the temperature and aperture size. If you store it in a garage or shed, 20 minutes should do the trick.
Ready to zip up? Go for it! I ran into a woman a couple weeks back who told me she loved winter because the cold made her feel alive. Man, she hit it right on the head. I’ll leave you with a quote from one of my favorite old-time authors, Joseph Elgie, an English amateur astronomer who wrote about the pleasures of the sky no matter the season in a book titled The Night Skies of a Year. This entry is from February about the year 1907:
“Shortly after nine o’clock Procyon could be seen through the openings in the flying clouds, not far from the meridian. The sky resembled a vast snow-field in swift motion – a snow field showing fleeting patches of blue, which were studded with sparklets of silver, and Procyon was one of those sparklets. In the sou’west too, I could discern a coppery gleam on the pale blue background of the sky. It was Betelgeuse. What pictures of tender loveliness were these!”