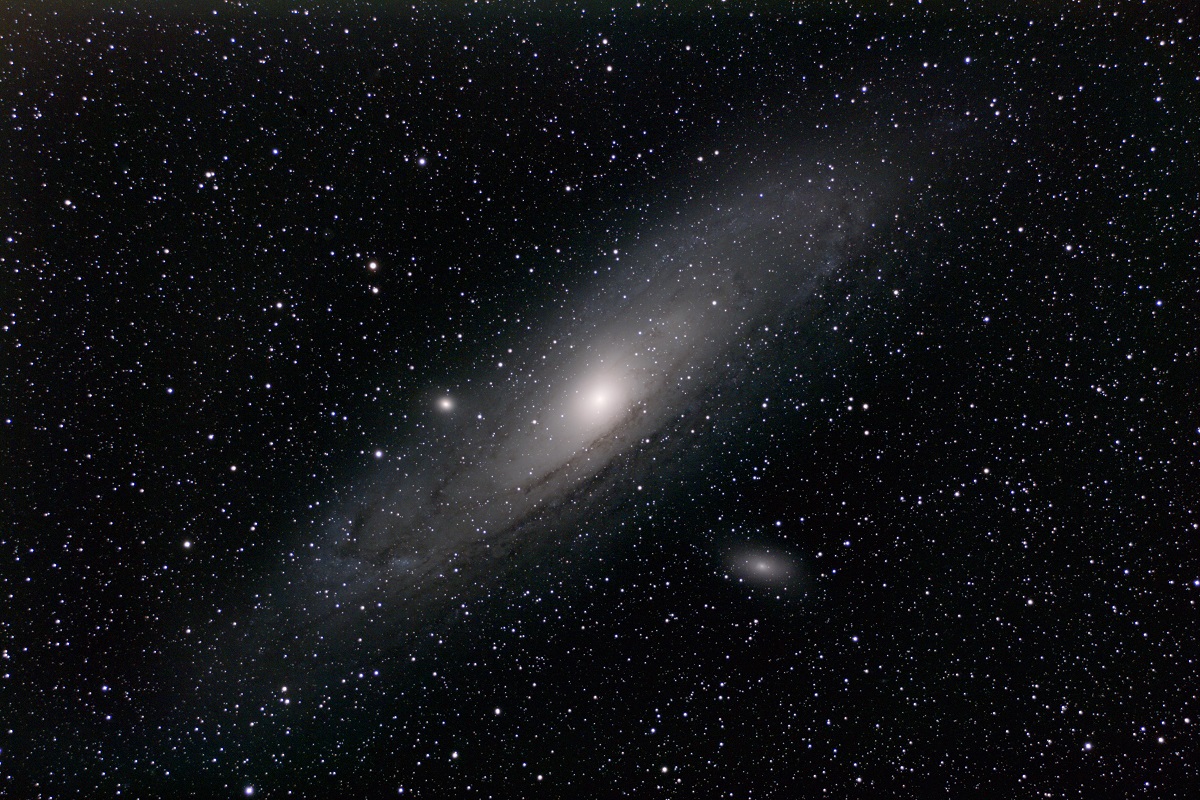
Image of the Andromeda Galaxy, showing Messier 32 to the lower left, which is currently merging with Andromeda. Credit: Wikipedia Commons/Torben Hansen
In a Universe that’s expanding apart, isn’t it strange that Andromeda is actually drifting towards us? Dr. Thad Szabo from Cerritos College explains why this is happening.
“I’m Thad Szabo, and I teach astronomy and physics at Cerritos College.”
Is Andromeda drifting towards us?
“The reason that we see Andromeda moving toward us is because it’s nearby enough, and the Milky Way is massive enough and Andromeda is massive enough that they’re gravity is strong enough that there is not enough space between them that the space was able to expand and push them apart against the force of gravity. So if you take the Milky Way, all of its stars and all of its gas and dust, all of its dark matter, you’re looking at something that’s a trillion times the mass of the sun. You have the same for Andromeda, and they’re less than a mega parsec apart – to Andromeda, its about 2.2 billion light years. And so with that distance and that much mass, that’s close enough that gravity is drawing them together. Most galaxies, because they’re so distant, you do see them moving away due to the expansion of the universe.”
“But actually M81, which is about 12 million light years away, is also moving towards the Milky Way. It’s the most distant galaxy that doesn’t show red shift. So there’s enough gravity in this local group – I guess the local group is typically the Milky Way galaxy, the Andromeda galaxy, the Triangulum galaxy, and however many tens of dwarf galaxies that we’ve either discovered or haven’t discovered yet. But there’s also a bubble of about ten to twenty major size galaxies extending out to about fifteen million light years or so, and that’s kind of right on the border between where the expansion of the universe would drive things apart and where the gravity is strong enough to hold things together.”
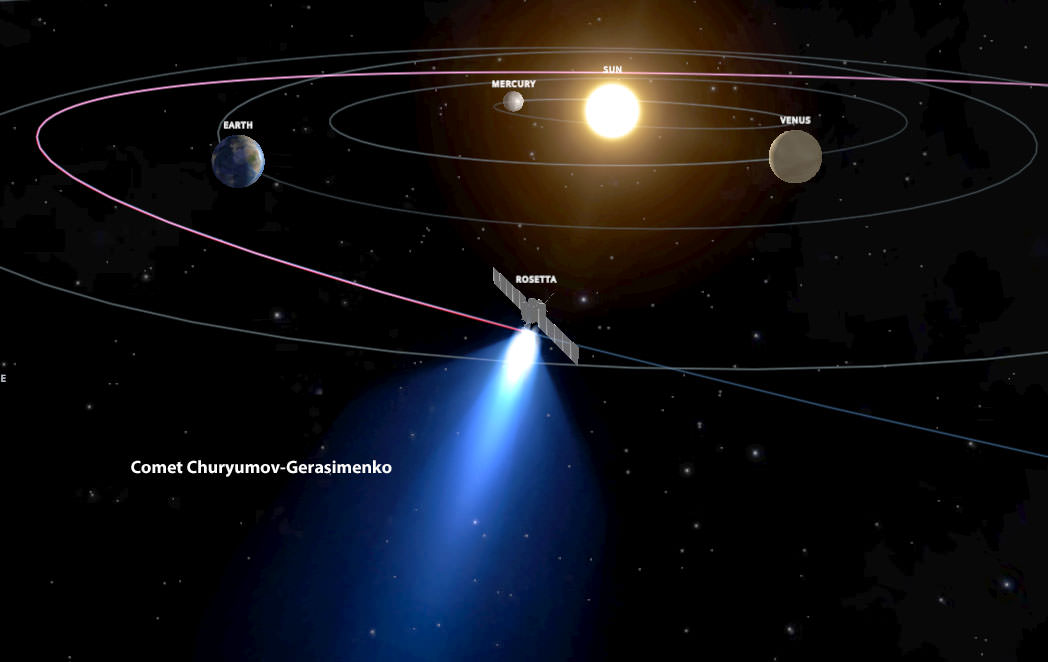
Frame from the Rosetta Mission simulation shows the probe and comet when closest to the sun in late 2015. Credit: INOVE
Hang onto your space helmets. With a few moves of the mouse, you can now follow the European Rosetta mission to its target comet with this interactive 3-D simulator. Go ahead and give it a click – it’s live! The new simulator was created by INOVE Space Models, the same group that gave us the 3-D solar system and Comet ISON interactive models.
The embedded version gives you a taste, so be sure to also check out the full-screen version. You can either click play to watch the mission from start to finish or you can drop it at key points by selecting from list of 11 highlights on the left side of your screen. A tick-tock at the bottom of the screen helps reference the time and what the spacecraft is doing at that moment in the video.
To interact with the model, simply click the screen. The action stops, allowing you to zoom in and out by scrolling; to change orbital viewpoints hold down the mouse button and drag. So easy!
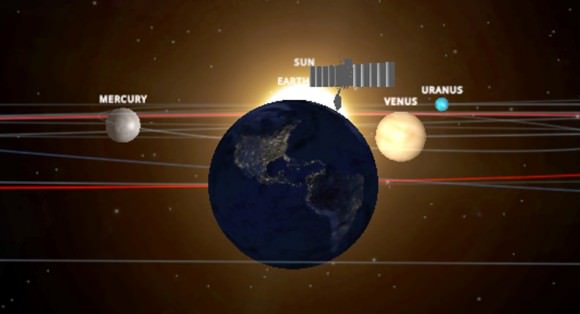
Simulator view of Rosetta’s first Earth flyby / gravity assist in March 2005. The probe flew by Earth three times and Mars once to conserve fuel and send it beyond the asteroid belt to rendezvous with Comet Churyumov-Gerasimenko. Credit: INOVE
I like the realism of the simulation, the attention paid to the planets’ variable spin rates and orbital periods and how well model illustrates the complicated maneuvers required to “fling” the probe to Comet Churyumov-Gerasimenko. And I do mean fling. Watching the video from a face-on solar system perspective I was struck by how Rosetta’s flight path resembled a spiral after repeated gravity assists by Mars and Earth.
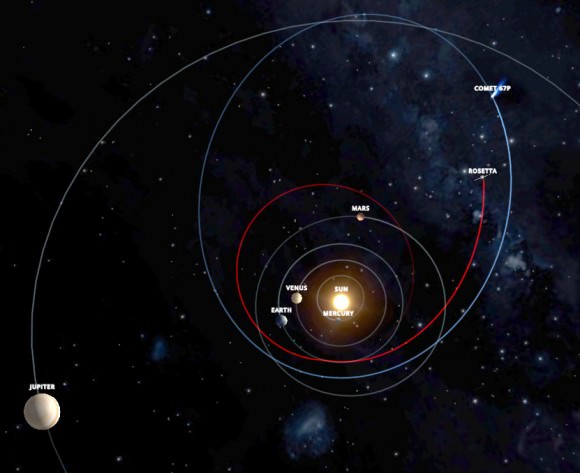
Rosetta heads toward Comet C-G after its final Earth flyby in this face-on view. Credit: INOVE
Whether you’re a teacher or an armchair space enthusiast looking for an easy-to-understand, graphic way to find out how Rosetta will meet its target, I doubt you’ll find a more effective tool.
A grouping of galaxies, known as J0717 (center) is visible in this Spitzer Space Telescope image. Credit: NASA/JPL-Caltech/P. Capak (Caltech)
Talk about turning back time. Three NASA observatories — the Hubble Space Telescope, the Chandra X-Ray Observatory and the Spitzer Space Telescope — are all working together to look for the universe’s first galaxies. The project is called “Frontier Fields” and aims to examine these galaxies through a technique called gravitational lensing, which allows astronomers to peer at more distant objects when massive objects in front bend their light.
“Our overall science goal with the Frontier Fields is to understand how the first galaxies in the universe assembled,” stated Peter Capak, a research scientist with the NASA/JPL Spitzer Science Center at the California Institute of Technology and the Spitzer lead for the Frontier Fields.
“This pursuit is made possible by how massive galaxy clusters warp space around them, kind of like when you look through the bottom of a wine glass.”
Using the three observatories allows investigators to peer at the galaxies in different light wavelengths (namely, infrared for Spitzer, shorter infrared and optical for Hubble, and X-rays for Chandra). The teams also plan to learn more about how the foreground clusters influence the “warping” of the galaxies behind.
The Hubble and Spitzer telescopes are designed to locate where the galaxies are (and if they are indeed early galaxies) while Chandra can map out the X-ray emissions to better determine the galaxies’ masses. An early example of this project at work was examination of Abell 2744, which yielded a distant find: Abell2744 Y1, one of the earliest known galaxies, which was born about 650 million years after the Big Bang.
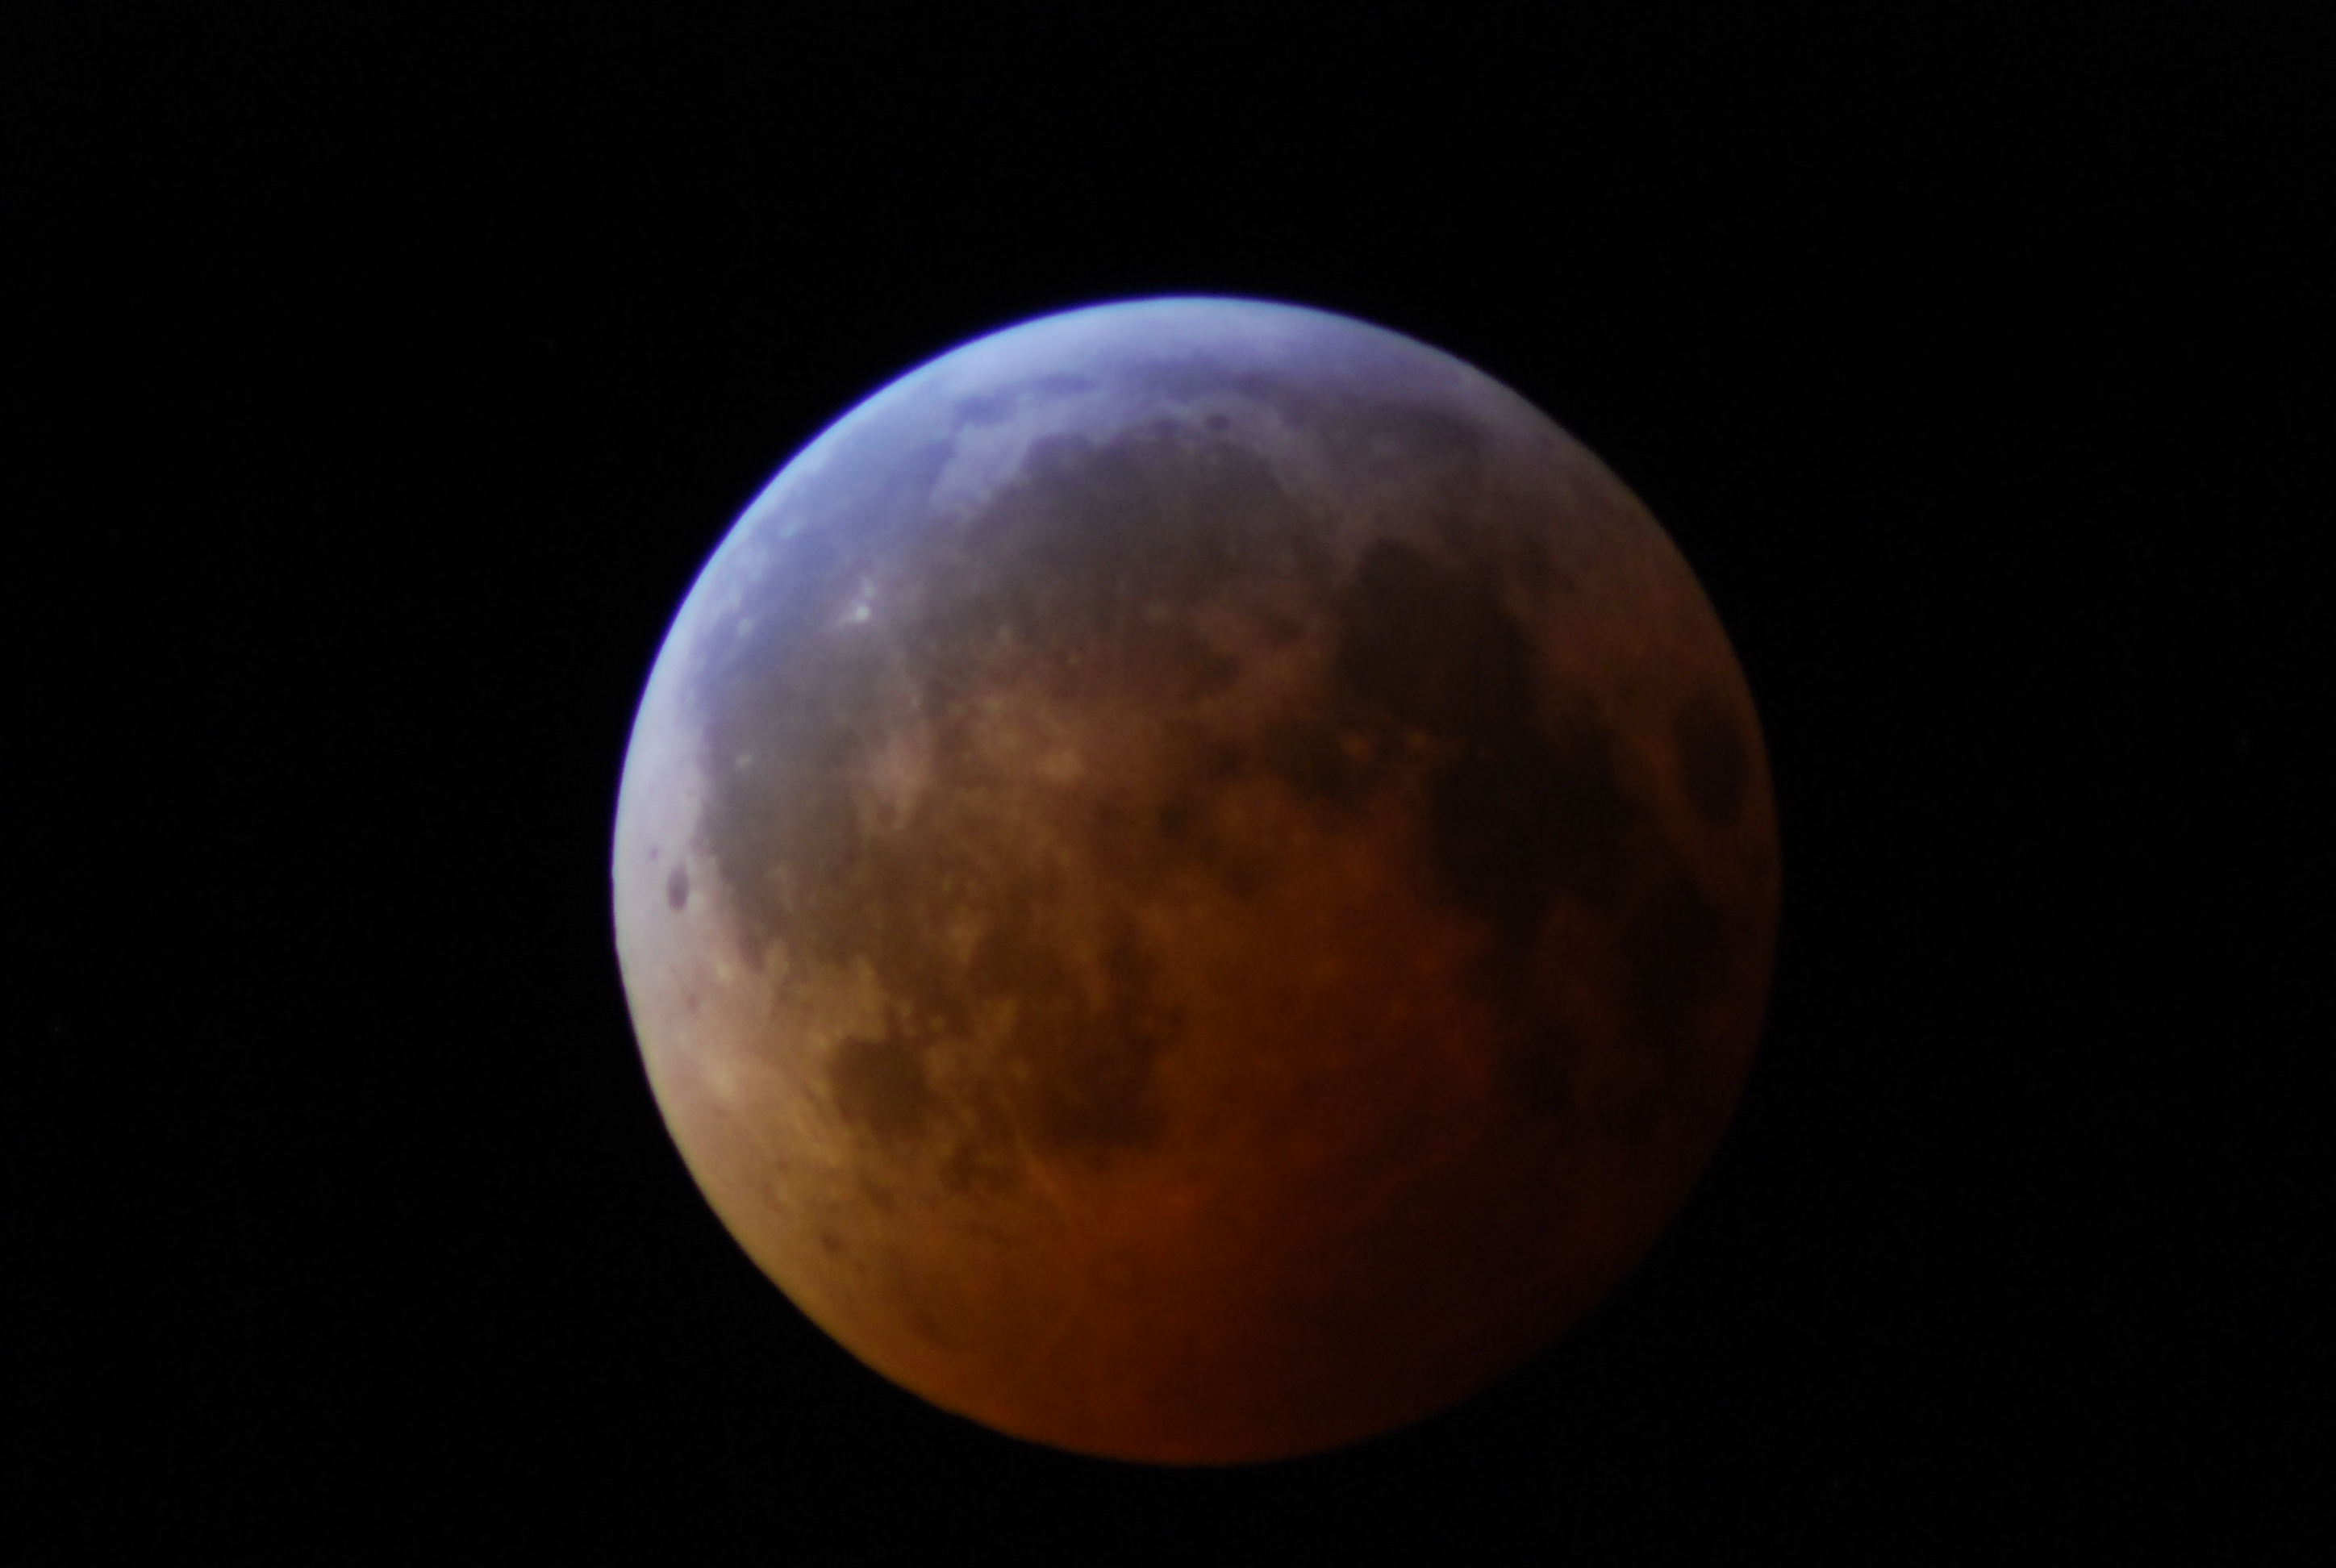
Totality! A seen during the "December solstice eclipse" of 2010. Photo by author.
April the 15th: In the United States, it’s a date dreaded by many, as the date to file taxes – or beg for an extension – looms large. But this year, Tax Day gives lovers of the sky something to look forward to, as the first of four total lunar eclipses for 2014 and 2015 occurs on the night of April 14th/15th favoring North and South America.
The circumstances for the April 15th, 2014 eclipse. The top chart shows the path of the Moon through the umbra, and the bottom chart shows the visibility region (light to shaded areas) Click here for a technical description. Credit: Eclipse Predictions by Fred Espenak, NASA/GSFC.
This marks the first total lunar eclipse visible from since December 10th 2011, which was visible at moonset from North America, and marks the start of the first of two eclipse seasons for 2014. Totality will last 1 hour, 17 minutes and 48 seconds, and will be visible in its entirety from the central Atlantic westward to eastern Australia. Unlike a total solar eclipse, which occurs along a narrow track, a total lunar eclipse can be viewed by the entire moonward facing hemisphere of the Earth.
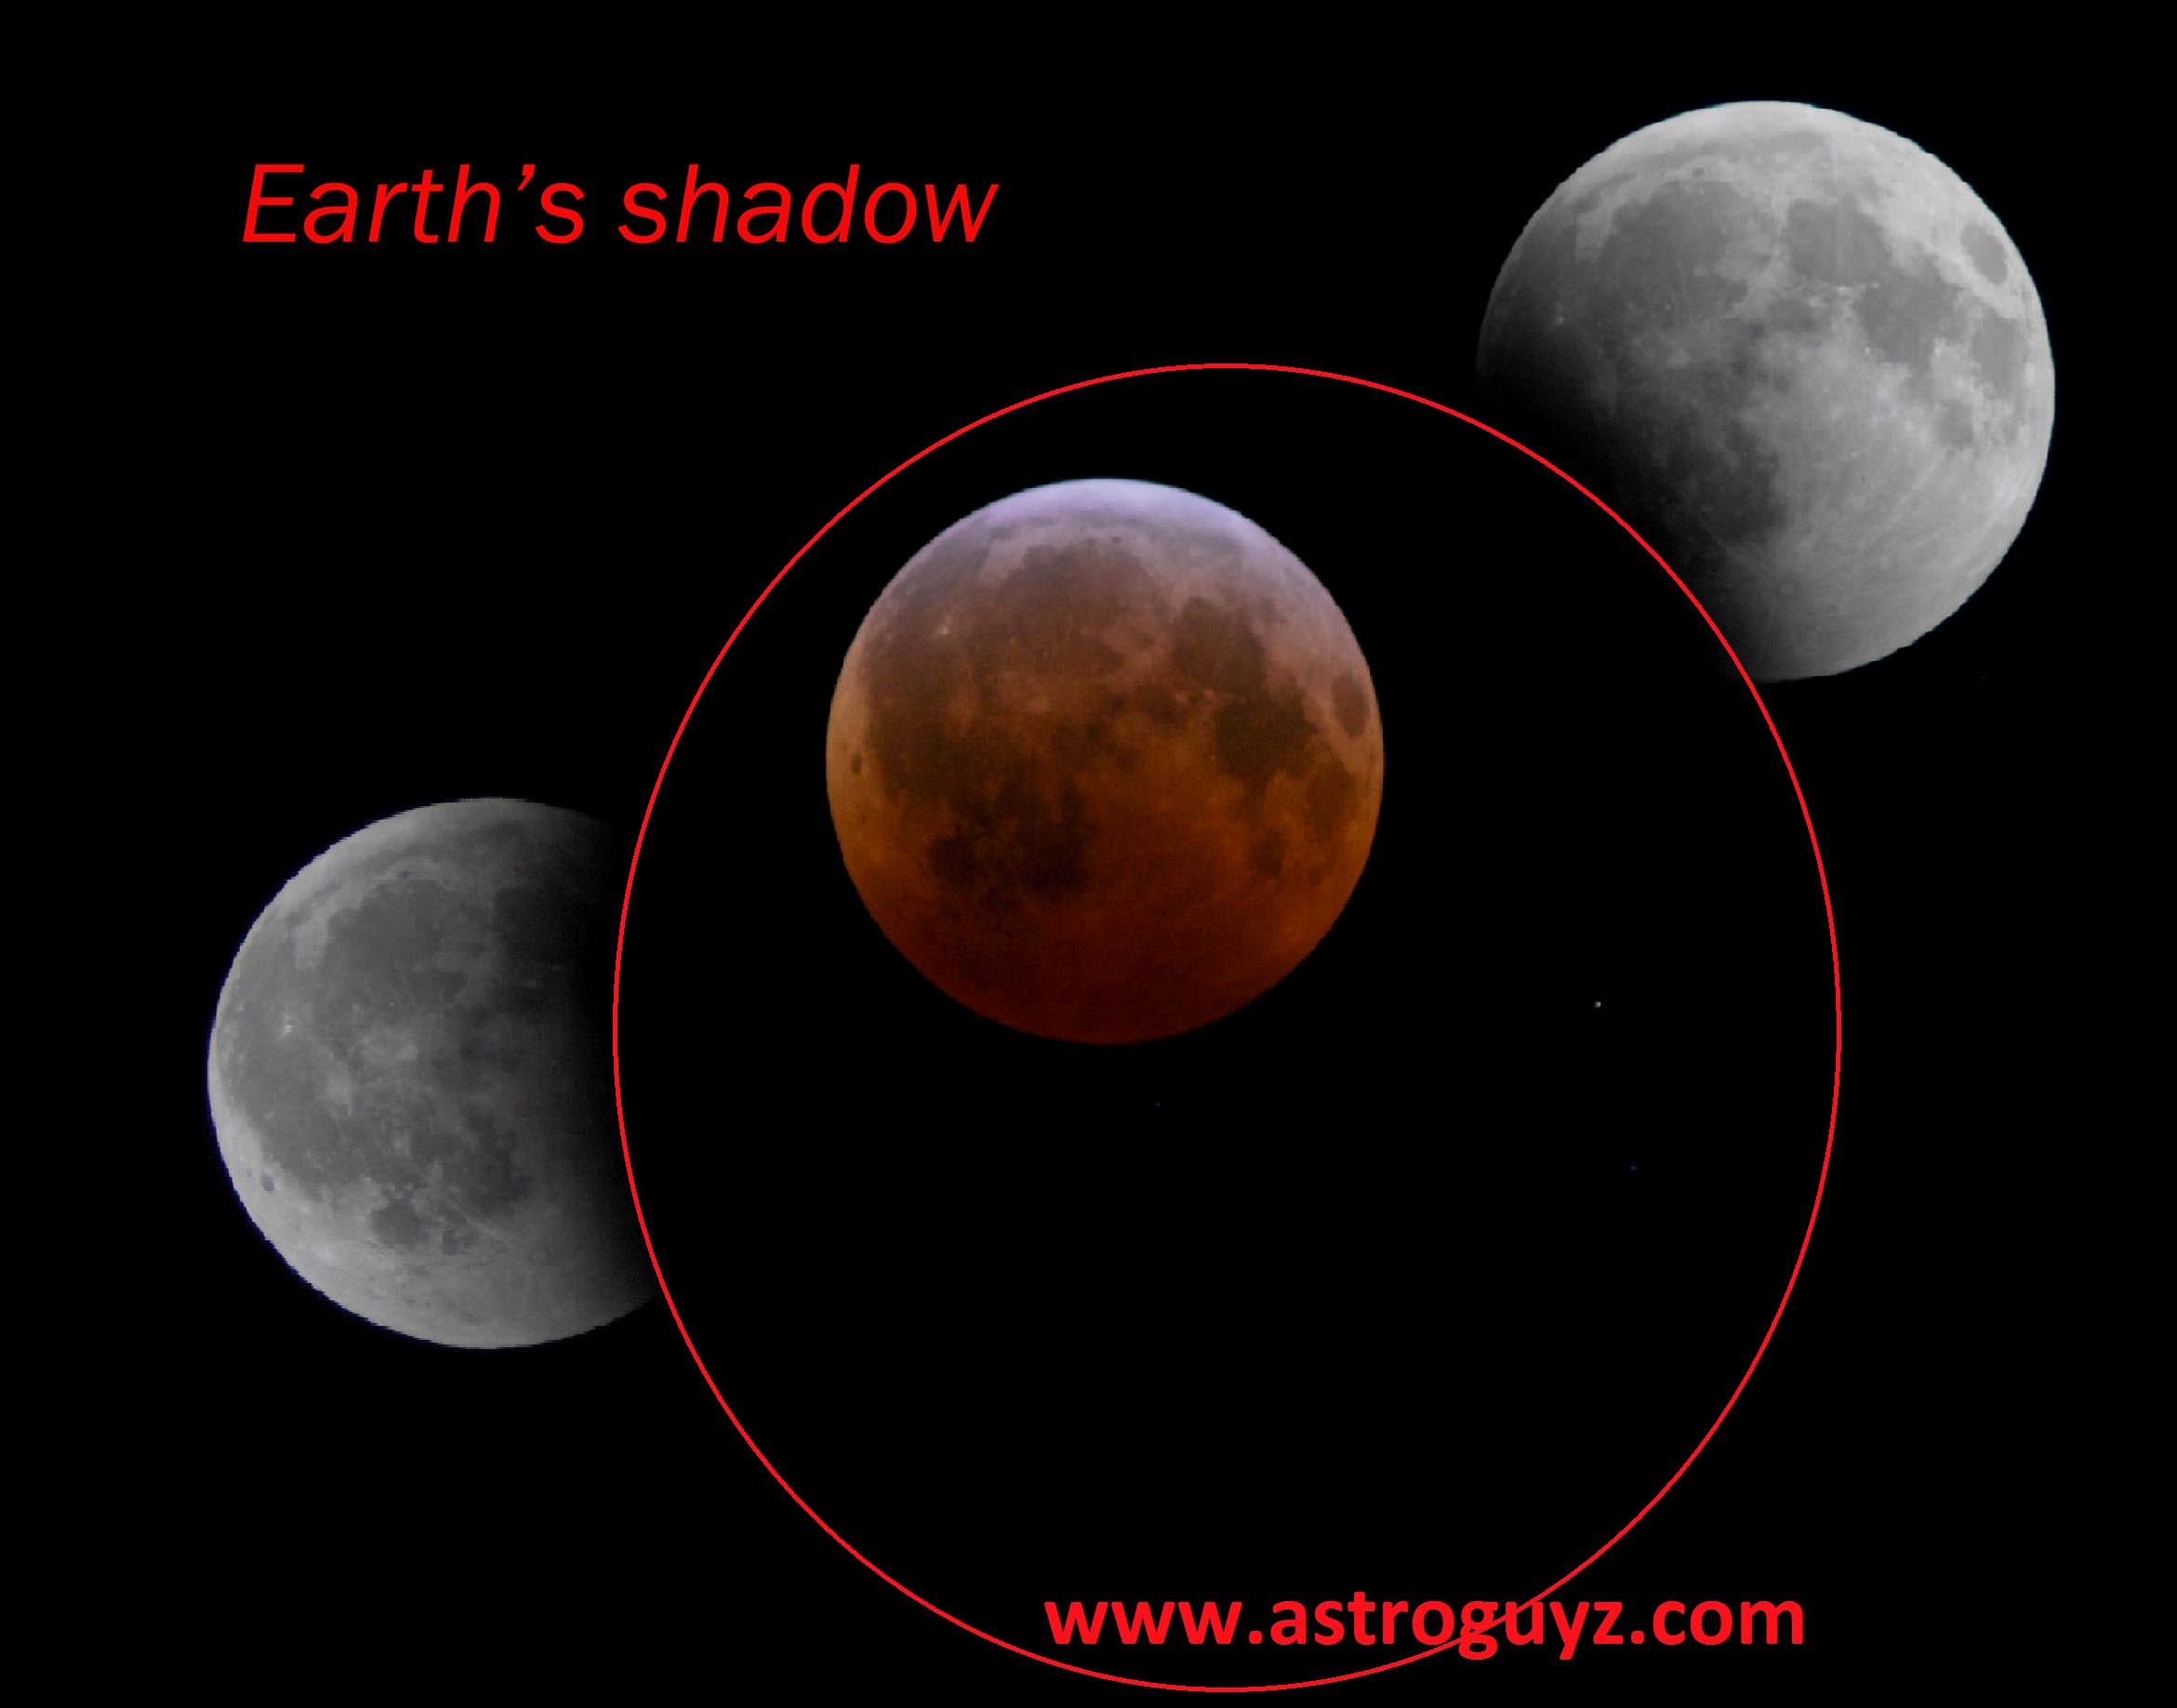
Tracing the umbra: a mosaic of the December 2010 eclipse. Photos by author.
The action begins at 4:37 Universal Time (UT)/12:37 AM EDT, when the Moon enters the western edge of the Earth’s shadow known as the penumbra. The Moon will be completely immersed in the penumbra by 5:58 UT/1:58 AM EDT, but don’t expect to see anything more than a faint tan shading that’s slightly darker on the Moon’s northeastern edge.
The real action begins moments later, as the Moon encounters the ragged edge of the umbra, or the inner core of the Earth’s shadow. When does the umbra first become apparent to you? Totality then begins at 7:06 UT/3:06 AM EDT and lasts until 8:24 UT/4:24 AM EDT, with mid-eclipse occurring just south of the center of the Earth’s shadow at 7:46 UT/3:46 AM EDT.
Finally, the eclipse ends as the Moon slides out of the penumbra at 10:37 UT/ 6:37 AM EDT. Michael Zeiler (@EclipseMaps) has complied a fine video guide to the eclipse:
This eclipse is also notable for being part of a series of four lunar eclipses in 2014 & 2015, known as a “tetrad.” NASA eclipse expert Fred Espenak notes that this series of eclipses is also notable in that all four are visible in part or in their entirety from the United States. We’re in a cycle of 9 sets of tetrads for the 21st century, which began with the first set in 2003. Before that, you have to go all the way back to the 16th century for the last set of eclipse tetrads!
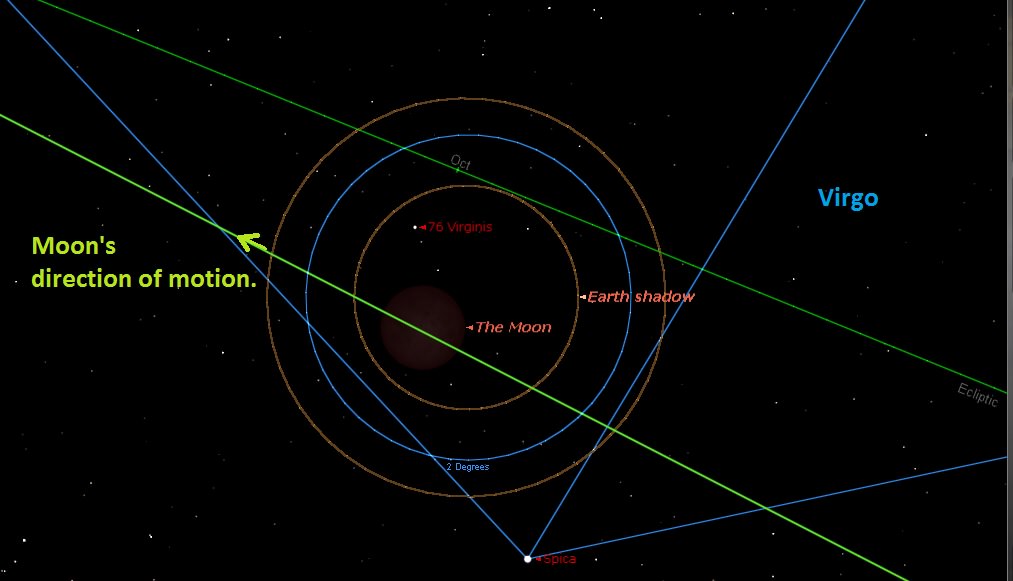
The position of the Moon within the Earth’s umbra on the morning of April 15th at 4AM EDT/8UT. Credit: Starry Night Education software.
For saros buffs, the April 15th eclipse is Member 56 of 75 of saros 122, which began on August 14th 1022 A.D. and runs out until a final penumbral eclipse of the series on October 29th, 2338. There are only two total eclipses left in this particular saros, one in 2032 and 2050. If you caught the total lunar eclipse of April 4th, 1996, you saw the last lunar eclipse in this same saros series.
Lunar eclipses have turned up at some curious junctures in history. For example, a lunar eclipse preceded the fall of Constantinople in 1453. A 2004 lunar eclipse also fell on the night that the Red Sox won the World Series after an 86 year losing streak, though of course, lunar eclipses kept on occurring during those losing years as well. Christopher Columbus was known to evoke an eclipse on occasion to get him and his crew out of a jam, and also attempted to use a lunar eclipse to gauge his position at sea using a method first described by Ptolemy while studying the lunar eclipse of September 20th, 331 B.C.
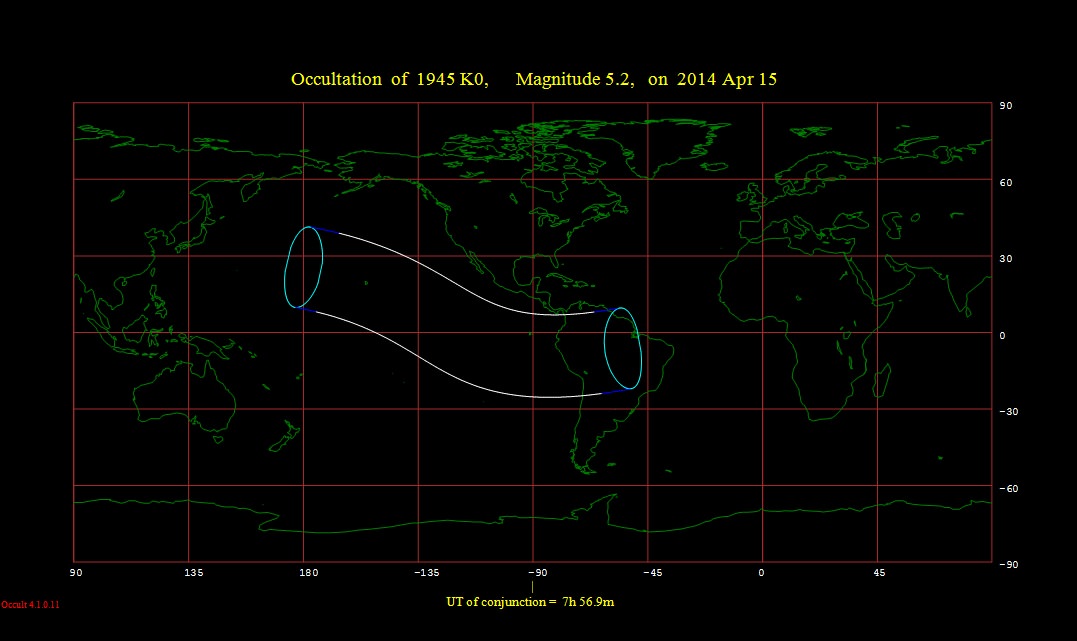
A handful of stars in the +8th to +12th magnitude range will be occulted by the eclipsed Moon as well. Brad Timerson of the International Occultation Timing Association (IOTA) has put together a list, along with graze line prospects across the United States. The brightest star to be occulted by the eclipsed Moon is +5th magnitude 76 Virginis across western South America and Hawaii:
The occultation footprint of 76 Virginis during the April 15th lunar eclipse. Credit: Occult 4.0
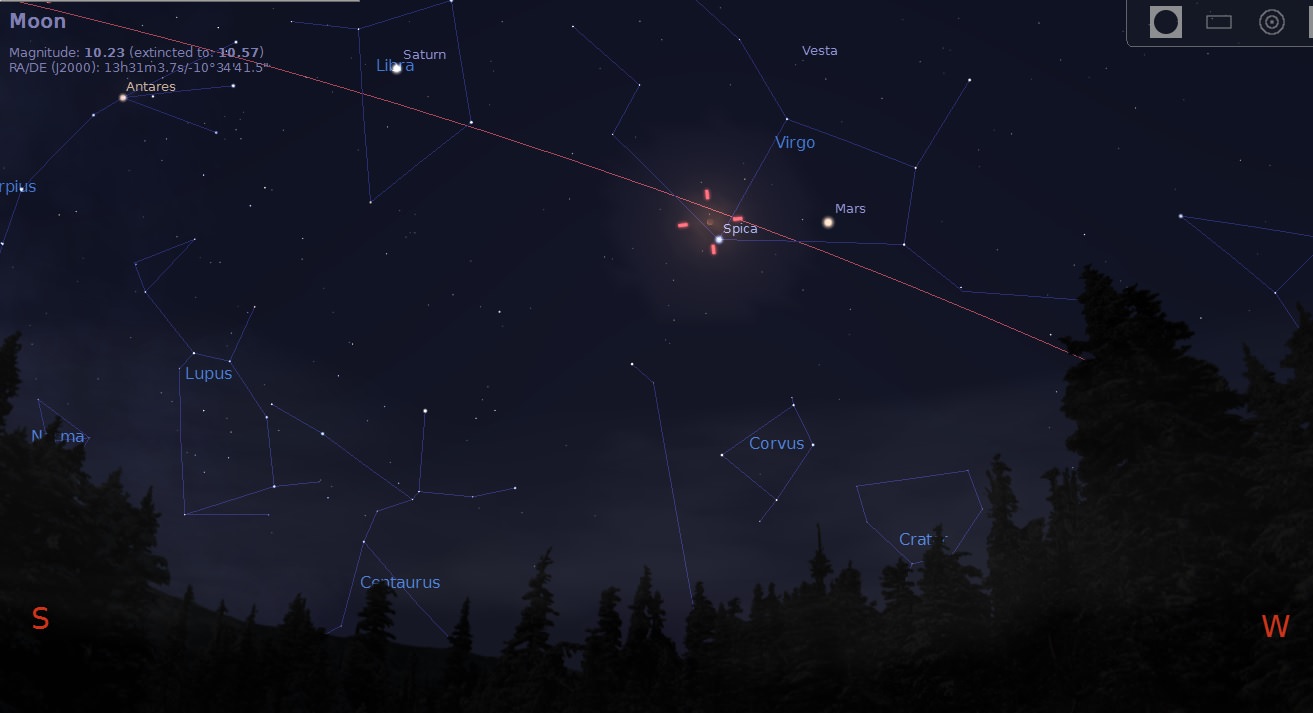
Note that the bright star Spica will be only just over a degree from the eclipsed Moon, and Mars will also be nearby, just a week past its 2014 opposition. And to top it off, Saturn is just one constellation to the east in Libra!
During the partial phases of the eclipse, watch for the Moon to take on a “Pacman-like” appearance. The Earth’s umbra is just under three times the size of the Moon, and the Greek astronomer Aristarchus of Samos used this fact and a little geometry to gauge the distance to our natural satellite in the 3rd century B.C.
As totality approaches, expect the innermost rim of the Moon to take on a ruddy hue. This is the famous “combination of all the sunrises and sunsets” currently underway worldwide as light is bent through the Earth’s atmosphere into its shadow. It’s happening every night, and during the totality of a lunar eclipse is the only chance that we get to see it.
Looking to the southwest at 4 AM EDT from latitude 30 degrees north on the morning of April 15th. Credit: Stellarium.
You don’t need anything more sophisticated than the naked eye or “Mark 1 eyeball” to enjoy a lunar eclipse, though it’s fun to watch through binoculars or a low-power telescope field of view. One interesting project that has been ongoing is to conduct timings for the moment when the umbra contacts various craters on the Moon. It’s a curious mystery that the Earth’s shadow varies by a small (1%) but perceptible amount from one eclipse to the next, and efforts by amateur observers may go a long way towards solving this riddle.
Said color of the fully eclipsed Moon can vary considerably as well: the Danjon scale describes the appearance of the eclipsed Moon, from bright and coppery red (Danjon 4) to so dark as to almost be invisible (Danjon 0). This is a product of the amount of dust, volcanic ash and aerosols currently aloft in the Earth’s atmosphere. During the lunar eclipse of December 9th, 1992 the Moon nearly disappeared all together, due largely to the eruption of Mount Pinatubo the year prior.
A lunar eclipse also presents a chance to nab what’s known as a Selenelion. This occurs when the Sun and the totally eclipsed Moon appear above the local horizon at the same time. This is possible mainly because the Earth’s shadow is larger than the Moon, allowing it to linger a bit inside the umbra after sunrise or before sunset. Gaining some altitude is key to making this unusual observation. During the April 15th eclipse, selenelion sightings favor the Mid-Atlantic and Greenland where totality is underway at sunrise and eastern Australia, where the reverse is true at sunset.
Want to have a go at measuring the brightness or magnitude of the eclipsed Moon? Here’s a bizarre but fun way to do it: take a pair of binoculars and compare the pinpoint Moon during totality to the magnitude of a known star, such as Antares or Spica.
Note that to do this, you’ll first need to gauge the magnitude extinction of your particular binoculars: NASA’s got a table for that, or you could field test the method days prior on Venus, currently shining at a brilliant -4.2 in the dawn. Hey, what’s a $1,000 pair of image-stabilized binocs for?
And of course, weather prospects are the big question mark for the event. Mid-April weather for North America is notoriously fickle. We’ll be watching the Clear Sky Chart and Skippy Sky for prospects days before the eclipse.
Photography during an eclipse is fun and easy to do, and you’ll have the waxing gibbous Moon available to practice on days prior to event. Keep in mind, you’ll need to slow down those shutter speeds as the Moon enters into totality, we’re talking going down from 1/60th of a second down to ¼” pretty quickly. In the event of a truly dark eclipse, the Moon may vanish in the view finder all together. Don’t be afraid to step exposures up to the 1 to 4 second range in this instance, as you’ve got over an hour to experiment.
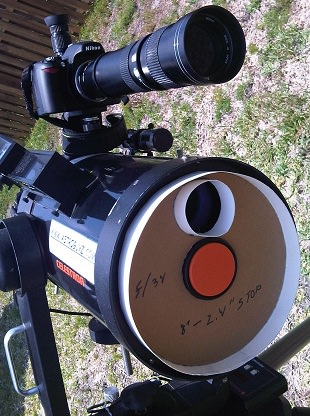
Our “eclipse hunting rig…” the DSLR is piggy-backed to shoot stills on the main scope, which will shoot video. Note that the “f/34 field stop” will most likely be removed! Photo by author
Thus far, only one webcast for the eclipse has surfaced, courtesy of the venerable Slooh. We’ll most likely be doing a follow up roundup of eclipse webcasts as they present themselves, as well as a look at prospects for things like a transit of the ISS in front of the eclipsed Moon and weather forecasts closer to show time.
And speaking of spacecraft, China’s Chang’e 3 lander and Yutu rover will have a fine view of a solar eclipse overhead from their Mare Imbrium vantage point, as will NASA’s LRO and LADEE orbiters overhead. In fact, NASA hinted last year that the April 15th eclipse might spell the end of LADEE entirely…
And thus marks the start of eclipse season one of two for 2014. Next up will be a curious non-central annular solar eclipse over Antarctica on April 29th, followed by another total lunar eclipse on October 8th, and a fourth and final partial solar eclipse of the year for North America of October 23rd.
Watch this space and follow us on Twitter as @Astroguyz, as we’ll be “all eclipses, all the time,” for April… no new taxes guaranteed!
Next up: Heard the one about the Blood Moon? Yeah, us too… join us as we debunk the latest lunacy surrounding the eclipse tetrad!
– Got pics of the lunar eclipse? Send ‘em in to Universe Today, as a post-eclipse photo round up is a very real possibility!
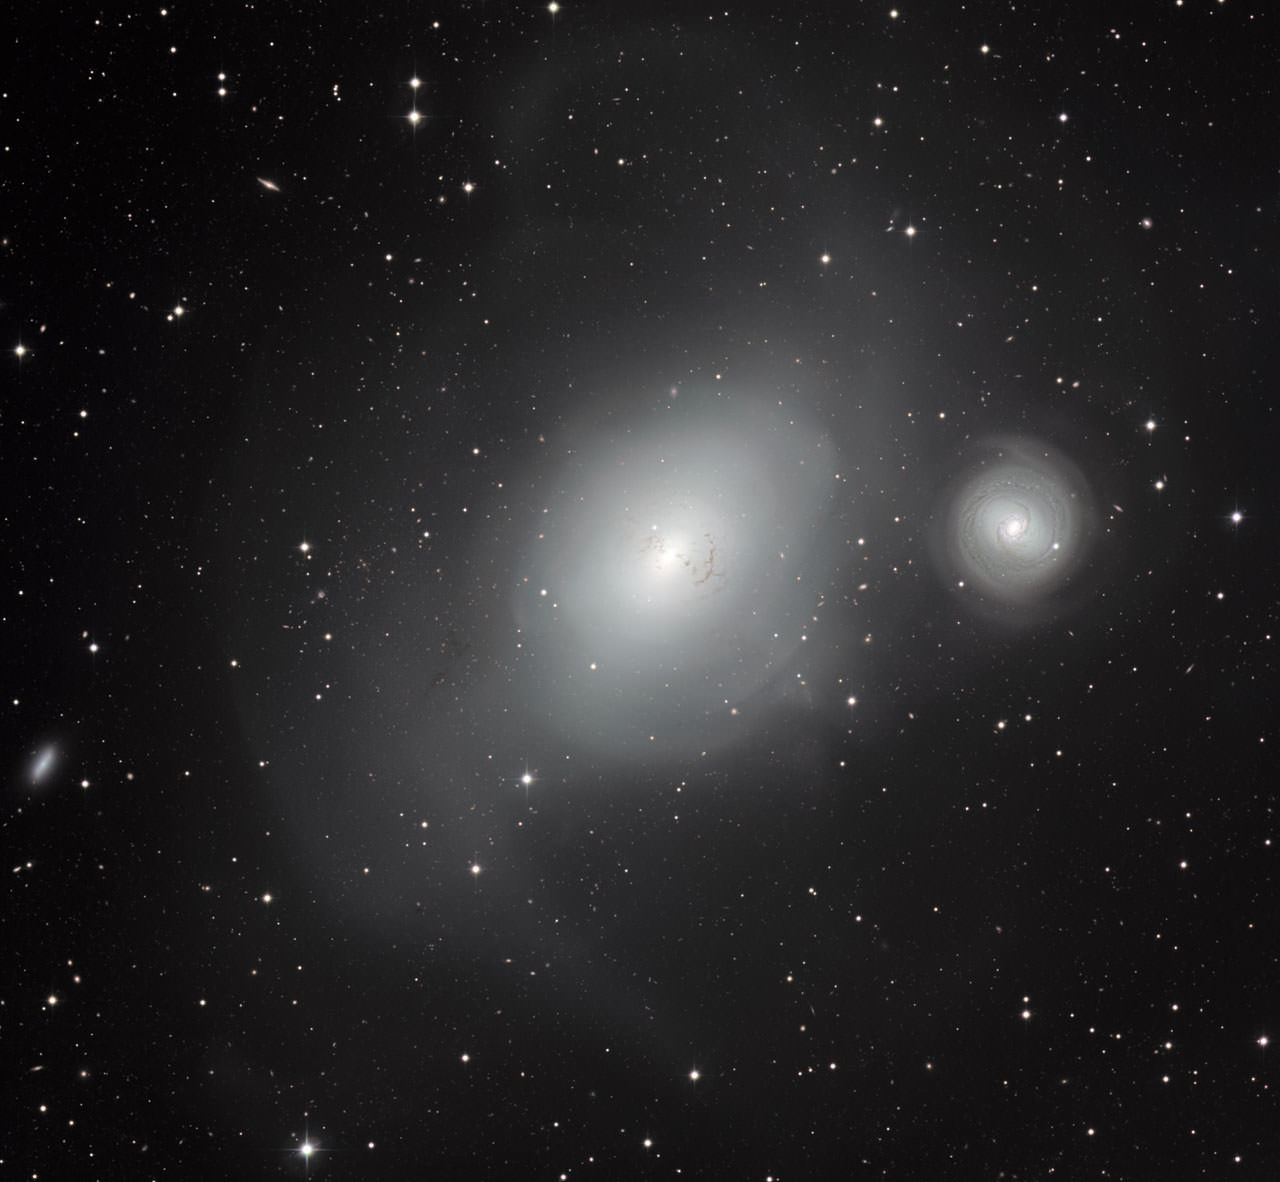
NGC 1316 (left) and its smaller companion galaxy NGC 1317. Image taken with the MPG/ESO 2.2-metre telescope at ESO’s La Silla Observatory in Chile. Credit: ESO
Shining 60 million light-years away all serene-looking is NGC 1316 (left) and a smaller galaxy NGC 1317. This new picture from the European Southern Observatory’s La Silla Observatory in Chile, however, reveals “battle scars” of ancient fights, the observatory stated.
“Several clues in the structure of NGC 1316 reveal that its past was turbulent. For instance, it has some unusual dust lanes embedded within a much larger envelope of stars, and a population of unusually small globular star clusters. These suggest that it may have already swallowed a dust-rich spiral galaxy about three billion years ago,” the European Southern Observatory stated.
“Also seen around the galaxy are very faint tidal tails — wisps and shells of stars that have been torn from their original locations and flung into intergalactic space. These features are produced by complex gravitational effects on the orbits of stars when another galaxy comes too close. All of these signs point to a violent past during which NGC 1316 annexed other galaxies and suggest that the disruptive behavior is continuing.”
You might better known NGC 1316 as Fornax A, the brightest radio source in the constellation Fornax and the fourth-brightest source in the sky. This is due to its supermassive black hole sucking up material in the area — and could actually be stronger because of the close encounters with other galaxies.
This image is a composite of archival pictures from the telescope. If you look closely, you can spot some fainter galaxies in the background, too.
Artist's conception of a starquake cracking the surface of a neutron star. Credit: Darlene McElroy of LANL
Much like how an earthquake can teach us about the interior of the Earth, a starquake shows off certain properties about the inside of a star. Studying the closest star we have (the sun) has yielded information about rotation, radius, mass and other properties of stars that are similar to our own. But how do we apply that information to other types of stars?
A team of astronomers attempted to model the inside of a delta-Scuti, a star like Caleum that is about 1.5 to 2.5 times the mass of the sun and spins rapidly, so much more that it tends to flatten out. The model reveals there is likely a correlation between how these types of stars oscillate, and what their average density is. The theory likely holds for stars as massive as four times the mass of our sun, the team said.
“Thanks to asteroseismology we know precisely the internal structure, mass, radius, rotation and evolution of solar type stars, but we had never been able to apply this tool efficiently to the study of hotter and more massive stars,” stated Juan Carlos Suárez, a researcher at the Institute of Astrophysics of Andalusia who led the investigation.
Model of an oscillation within the sun. Credit: David Guenther, Saint Mary´s University
What’s more, knowing how dense a star is leads to other understandings: what its mass is, its diameter and also the age of any exoplanets that happen to be hovering nearby. The astronomers added that the models could be of use for the newly selected Planetary Transits and Oscillations (PLATO) telescope that is expected to launch in 2024.
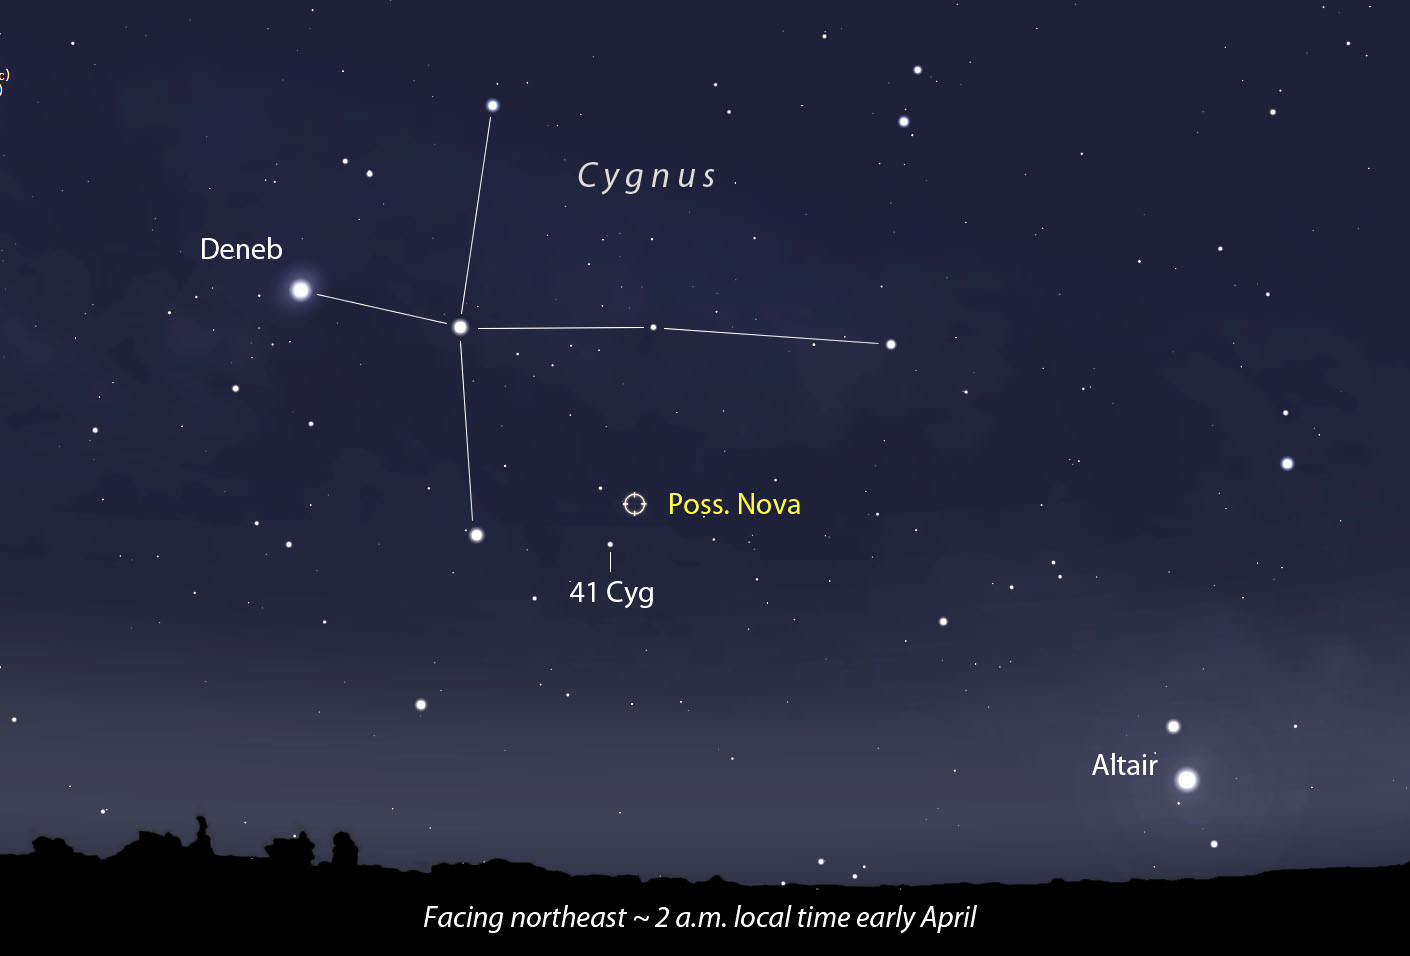
A newly-discovered star of magnitude +10.9 has flared to life in the constellation Cygnus the Swan. Koichi Nishiyama and Fujio Kabashima, both of Japan, made their discovery yesterday March 31 with a 105mm f/4 camera lens and electronic camera. They quickly confirmed the observation with additional photos taken with a 0.40-m (16-inch) reflector. Nothing was seen down to magnitude +13.4 in photos taken the on the 27th, but when they checked through images made on March 30 the star present at +12.4. Good news – it’s getting brighter!
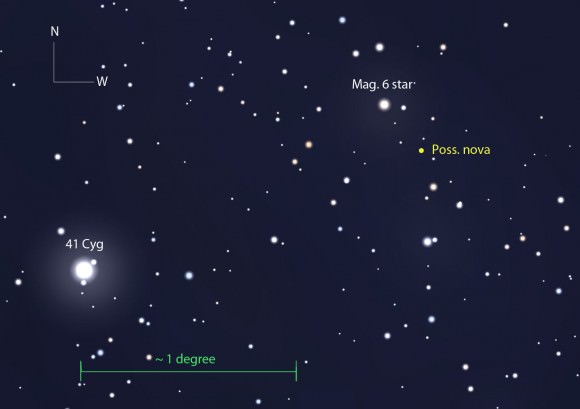
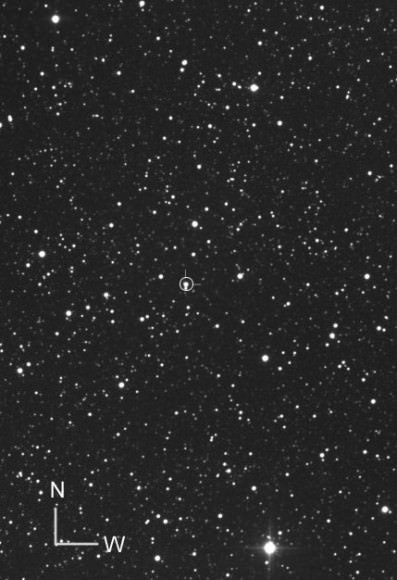
This more detailed map, showing stars to mag. 10.5, will help you pinpoint the star. Its coordinates are R.A. 20h 21m 42, declination +31 o3′. Stellarium
While the possible nova will need confirmation, nova lovers may want to begin observing the star as soon as possible. Novae can brighten quickly, sometimes by several magnitudes in just a day. These maps should help you hone in on the star which rises around midnight and becomes well placed for viewing around 1:30-2 a.m. local time in the eastern sky. At the moment, it will require a 4-inch or larger telescope to see, but I’m crossing my fingers we’ll see it brighten further.
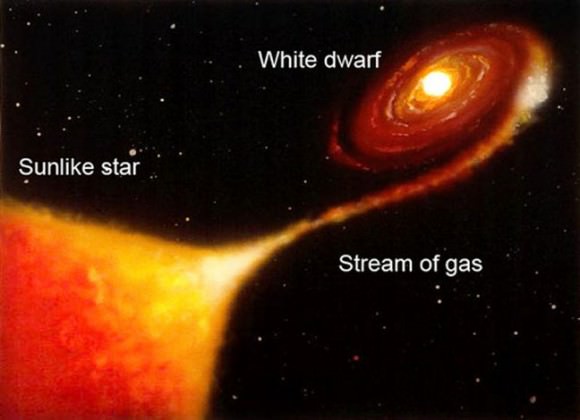
Novae occur in close binary systems where one star is a tiny but extremely compact white dwarf star. The dwarf pulls material into a disk around itself, some of which is funneled to the surface and ignites in a nova explosion. Credit: NASA
To see a nova is to witness a cataclysm. Astronomers – mostly amateurs – discover about 10 a year in our Milky Way galaxy. Many more would be seen were it not for dust clouds and distance. All involve close binary stars where a tiny but extremely dense white dwarfstar steals gas from its companion. The gas ultimately funnels down to the 150,000 degree surface of the dwarf where it’s compacted by gravity and heated to high temperature until it ignites in an explosive fireball. If you’ve ever wondered what a million nuclear warheads would look like detonated all at once, cast your gaze at a nova.
Novae can rise in brightness from 7 to 16 magnitudes, the equivalent of 50,000 to 100,000 times brighter than the sun, in just a few days. Meanwhile the gas they expel in the blast travels away from the binary at up to 2,000 miles per second.
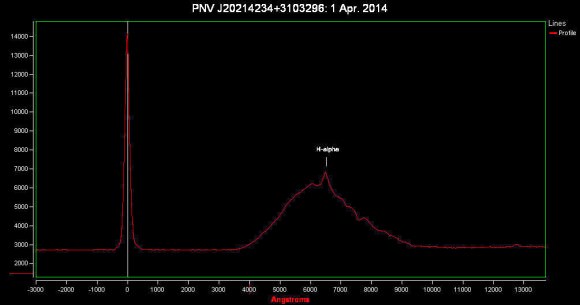
Emission of deep red light called hydrogen alpha or H-alpha is often diagnostic of a nova. When in the fireball phase, the star is hidden by a fiery cloud of rosy hydrogen gas and expanding debris cloud. Italian astronomer obtained this spectrum of the possible nova on April 1 showing H-alpha emission. Credit: Gianluca Masi
Nishiyama and Kabashima are on something of a hot streak. If confirmed, this would be their third nova discovery in a month! On March 8, they discovered Nova Cephei 2014 at magnitude 11.7 (it’s currently around 12th magnitude) and 10th magnitude Nova Scorpii 2014 (now at around 12.5) on March 26. Impressive.
Photo showing the possible nova in Cygnus. The star is described as being tinted red. Credit: Gianluca Masi
Charts for the two older discoveries are available on the AAVSO website. Type in either Nova Cep 2014 or TCP J17154683-3128303 (for Nova Scorpii) in the Star finder box and click Create a finder chart. I’ll update this article as soon as a chart for the new object is posted.
** UPDATE April 2, 2014: This star has been confirmed as a nova. You can print out a chart by going to the AAVSO website and following the instructions above using Nova Cyg 2014 for the star name. On April 2.4 UT, I observed the nova at magnitude 11.o.
A photogenic grouping greets evening sky watchers this week providing a fine teaser leading up to a spectacular eclipse.
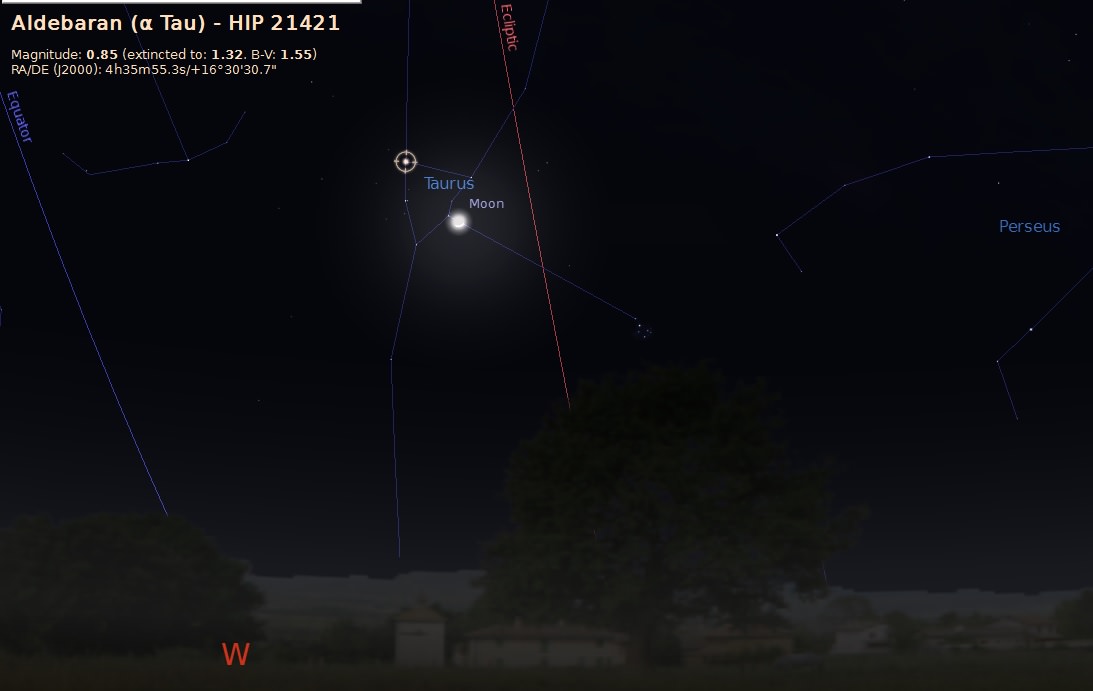
On the evening of Thursday, April 3rd headed into the morning of the 4th, the waxing crescent Moon crosses in front of the Hyades open star cluster. This is the V-shaped asterism that marks the head on Taurus the Bull, highlighted by the brilliant foreground star Aldebaran as the bull’s “eye”. Viewers across North America will have a ring-side seat to this “bull-fight” as the 20% illuminated Moon stampedes over several members of the Hyades in its path.
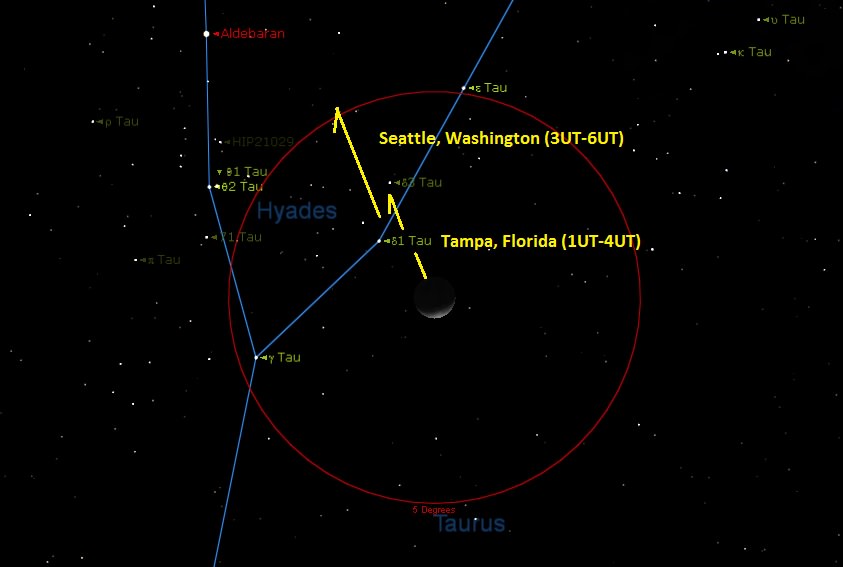
The passage of the Moon through the Hyades over a three hour span on the night of April 3rd (April 4th in Universal Time) comparing the North American locales of Tampa, Florida and Seattle, Washington. (Credit: Starry Night Education Software).
The brightest stars to be occulted are the Delta Tauri trio of stars ranging in magnitudes from +3.8 (Delta Tauri^1) to +4.8(2) and +4.3(3). Such occlusions – known in astronomy as occultations – are fun to watch, and can reveal the existence of close binary companions as they wink out behind the lunar limb. Several dozen occultations of stars brighter than +5th magnitude by the Moon happen each year, and the best events occur when the Moon is waxing and the stars disappear against its dark leading edge. We recently caught one such event last month when the Moon occulted the bright star Lambda Geminorum:
We are currently seeing the Moon cross the Hyades during every lunation until the year 2020, though it’s a particularly favorable time to catch the event in April 2014 as the Moon is a slender crescent. Notice that you can just make out the dark limb of the Moon with the naked eye? What you’re seeing is termed Earthshine, and that’s just what it is: the nighttime side of the Moon being illuminated by sunlight that is reflected off of the Earth. Standing on the Earthward side of the Moon, an observer would see a waning gibbous Earth about two degrees across. Yutu has a great view!
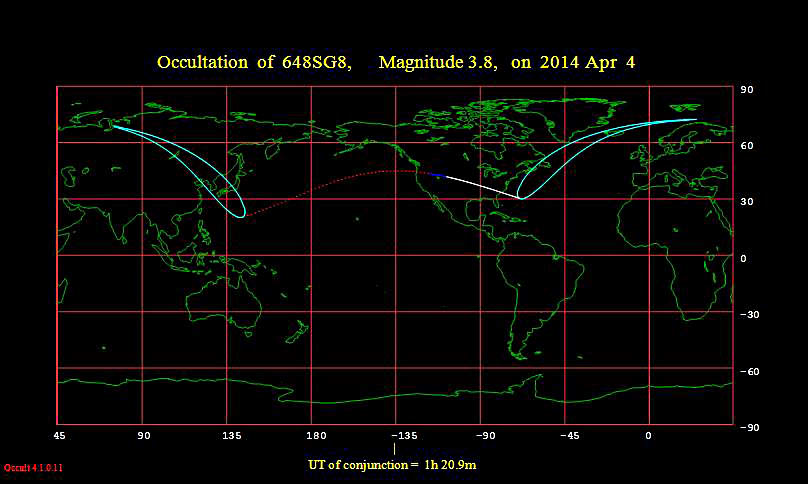
The occultation footprint for Delta Tauri^1. Credit: Occult 4.0
The Moon will cross its descending node where its apparent path intersects the ecliptic on April 1st (no joke, we swear) at 2:30 Universal Time or 10:30 PM EDT on March 31st. The next nodal crossing now occurs in just two weeks, and the Earth’s shadow will be there to greet the Moon on the morning of April 15th in the first of four total lunar eclipses that span 2014 and 2015. The month of April also sees the Moon’s orbit at its least eccentric, a time at which perigee – the Moon’s closest point to Earth – is at its most distant and apogee – its farthest point – is at its closest. This currently happens near the equinoxes, through the nodes slowly travel across the ecliptic completing one revolution every 18.6 years. Perigee can vary from 356,400 to 370,400 kilometres, and apogee can span a distance from 404,000 to 406,700 kilometres.
Looking west from the US SE at about 10PM local on the evening of April 3rd. Credit: Stellarium.
We’re also headed towards a “shallow year” in 2015 when the Moon has the least variability in respect to its declination. This trend will then reverse, climaxing with a “Long Nights Moon” riding high in the sky in 2025, which last occurred in 2006. The Moon will inch ever closer to Aldebaran on every successive lunation now, and begins a series of occultations of Aldebaran on January 29th, 2015 through the end of 2018. Occultations of Aldebaran always occur near these shallow years, and will be followed by a cycle of occultations of Regulus starting in 2017. We caught an excellent daytime occultation of Aldebaran by the Moon from North Pole, Alaska during the last cycle in the late 1990s.
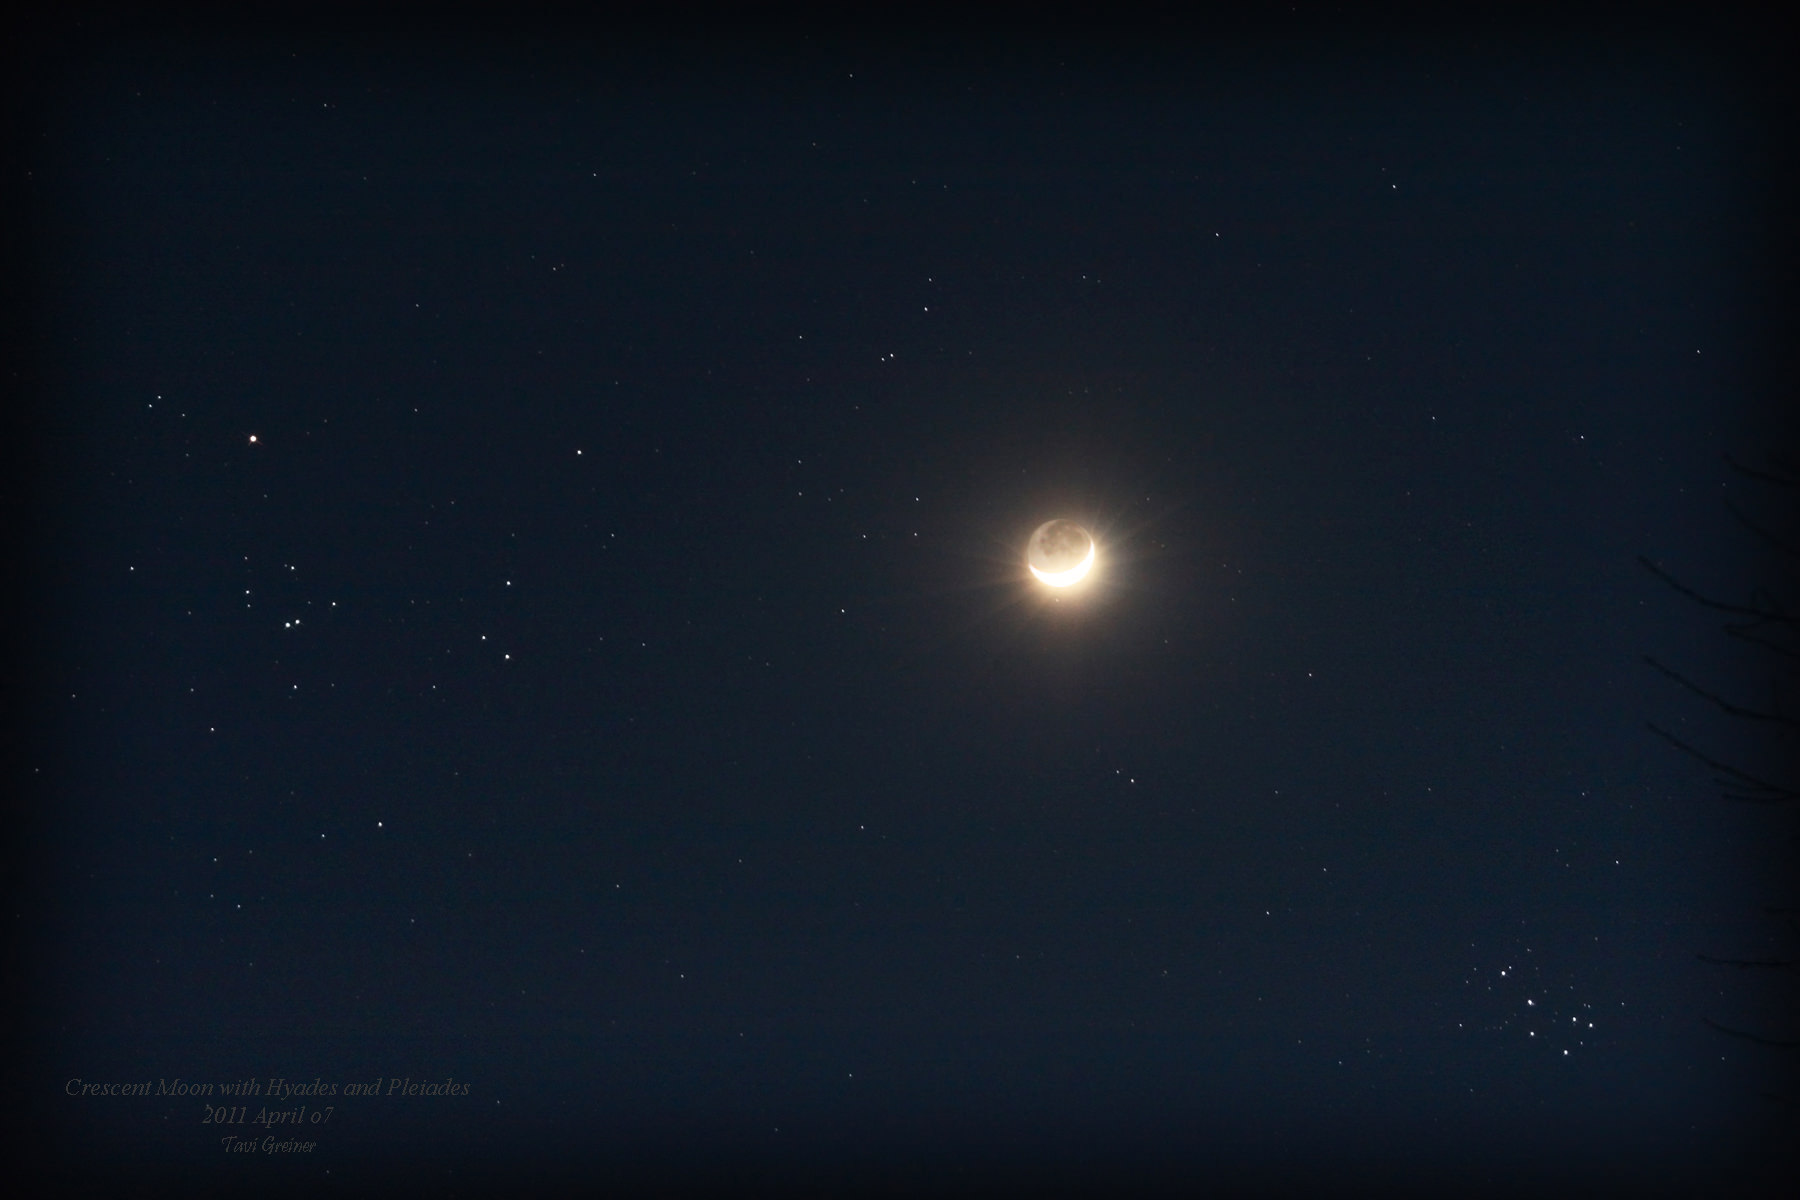
The Moon passing between the Hyades and Pleiades in 2011 with Earthshine highlighted. Photos by author.
Now for the wow factor. Our Moon is 3,474 kilometres across and located just over one light second away. The Hyades star cluster covers about 6 ½ degrees of sky – about 7 times the size of the Full Moon – but is the closest open cluster to the Earth at 153 light years distant and has a core diameter of about 18 light years across. As mentioned previous, Aldebaran isn’t physically associated with the Hyades, but is merely located in the same direction at 65 light years distant.
The Hyades star cluster also provided early 20th astronomers with an excellent study in galactic motion. At an estimated 625 million years in age, the Hyades are slowly getting disbanded and strewn about the Milky Way galaxy in a process known as evaporation. The Hyades are also part of a larger stellar incorporation known as the Taurus Moving Cluster. Moving at an average of about 43 kilometres a second, the members of the Hyades are receding from us towards a divergent point near the bright star Betelgeuse in the shoulder of Orion. 50 million years hence, the Hyades will be invisible to the naked eye as seen from Earth, looking like a non-descript open cluster and providing a much smaller target for the Moon to occult at 20’ across. Astronomer Lewis Boss was the first to plot the motion of the Hyades through space in 1908, and the cluster stands as an essential rung on the cosmic distance ladder, with agreeing measurements independently made by both Hubble and Hipparcos and soon to be refined by Gaia.
Photographing and documenting this week’s passage of our Moon across the Hyades is easy with a DSLR camera: don’t be afraid to vary those ISO and shutter speeds to get the mix of the brilliant crescent Moon, the fainter earthshine, and background stars just right. The more adventurous might want to try actually catching the numerous occultations of bright stars on video. And U.S. and Canadian west coast observers are well placed to catch the Moon cross right though the core of the Hyades… a video animation of the event is not out of the question!
And from there, the Moon heads on to its date with destiny and a fine total lunar eclipse on April 15th which favors North American longitudes. We’ll be back later this week with our complete and comprehensive eclipse guide!
When you look into the night sky, you’re seeing tremendous distances away, even with your bare eyeball. But what’s the most distant object you can see with the unaided eye? And what if you get help with a pair of binoculars, a telescope, or even with the Hubble Space Telescope.
Standing at sea level, your head is at an altitude of 2 meters, and the horizon appears to be about 3 miles, or 5 km away. We’re able to see more distant objects if they’re taller, like buildings or mountains, or when we’re higher up in the air. If you get to an altitude of 20 meters, the horizon stretches out to about 11 km. But we can see objects in space which are even more distant with the naked eye. The Moon is 385,000 km away and the Sun is a whopping 150 million km. Visible all the way down here on Earth, the most distant object in the solar system we can see, without a telescope, is Saturn at 1.5 billion km away.
In the very darkest conditions, the human eye can see stars at magnitude 6.5 or greater. Which works about to about 9,000 individual stars. Sirius, the brightest star in the sky, is 8.6 light years. The most distant bright star, Deneb, is about 1500 light years away from Earth. If someone was looking back at us, right now, they could be seeing the election of the 52nd pope, St. Hormidas, in the 6th Century.
There are even a couple of really bright stars in the 8000 light year range, that we might just barely be able to see without a telescope. If a star detonates, we can see it much further away. The famous 1006 supernova was the brightest in history, recorded in China, Japan and the Middle East.
It was a total of 7,200 light years away and was visible in the daytime. There’s even large structures we can see. Outside the galaxy, the Large Magellanic Cloud is 160,000 light years and the Small Magellanic Cloud is almost 200,000 light years away. Unfortunately for us up North, these are only visible from Southern Hemisphere.The most distant thing we can see with our bare eyeballs is Andromeda at 2.6 million light years, which in dark skies looks like a fuzzy blob.
If we cheat and get a little help, say with binoculars – you can see magnitude 10 – fainter stars and galaxies at more than 10 million light-years away. With a telescope you can see much, much further. A regular 8-inch telescope would let you see the brightest quasars, more than 2 billion light years away. Using gravitational lensing the amazing Hubble space telescope can see galaxies, incredibly far out, where the light had left them just hundreds of millions of years after the Big Bang.
If you could see in other wavelengths, you could see different distances. Fortunately for our precious radiation sensitive organs, Gamma and X rays are blocked by our atmosphere. But if you could see in that spectrum, you could see objects exploding billions of light years away. And if you could see in the radio spectrum, you’d be able to see the cosmic microwave background radiation, surrounding us in all directions and marking the edge of the observable universe.
Wouldn’t that be cool? Well, maybe we can… just a little. Turn on your television, some of the static on the screen is this very background radiation, the afterglow of the Big Bang.
What do you think? If you could see far out in the Universe what would you like a close up view of? Tell us in the comments below.
Is there truly anything new under the Sun? Well, when it comes to amateur astronomy, many observers are branching out beyond the optical. And while it’s true that you can’t carry out infrared or X-ray astronomy from your backyard — or at least, not until amateurs begin launching their own space telescopes — you can join in the exciting world of amateur radio astronomy.
We’ll admit right out the gate that we’re a relative neophyte when it comes to the realm of radio astronomy. We have done radio observations of meteor showers in tandem with optical observations, and have delved into the trove of information on constructing radio telescopes over the years. Consider this post a primer of sorts, an intro into the world of radio amateur astronomy. If there’s enough interest, we’ll follow up with a multi-part saga, constructing and utilizing our own ad-hoc “redneck array” in our very own backyard with which to alarm the neighbors and probe the radio cosmos.
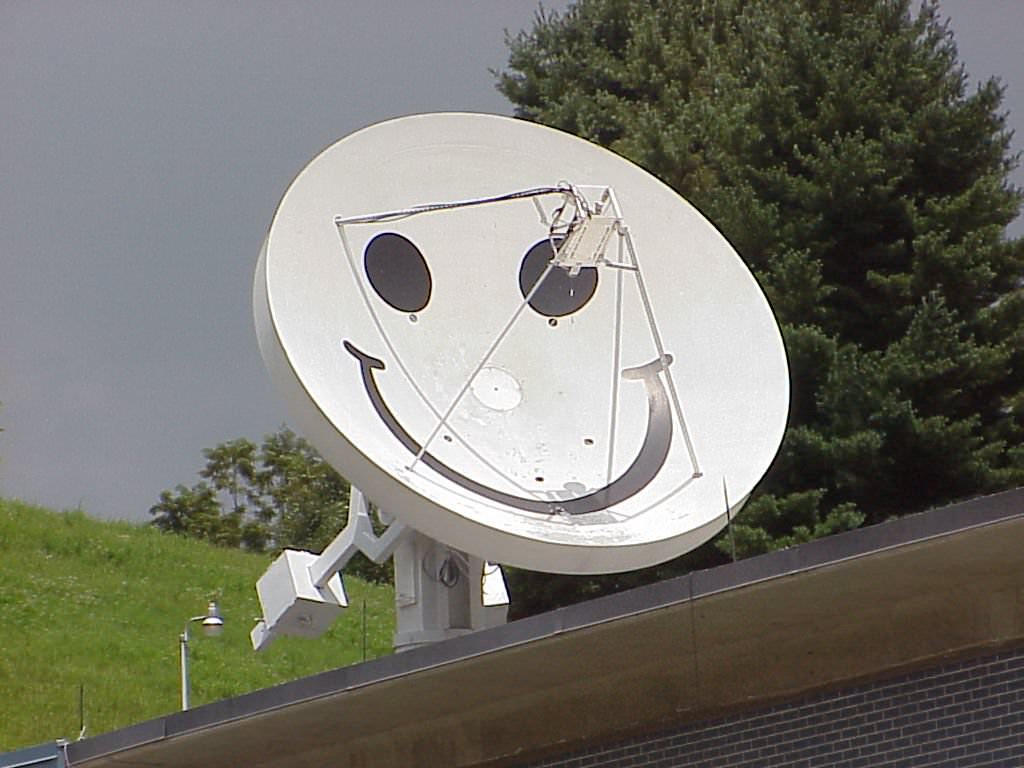
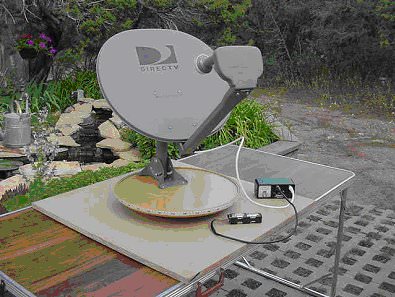
The “Itty-Bitty Array”- Re-purposing a TV Dish for amateur astronomy. Credit: NSF/NRAO/Assoc. Universities, Inc.
…And much like our exploits in planetary webcam imaging, we’ve discovered that you may have gear kicking around in the form of an old TV dish – remember satellite TV? – in your very own backyard. A simple radio telescope setup need not consist of anything more sophisticated than a dish (receiver), a signal strength detector (often standard for pointing a dish at a satellite during traditional installation) and a recorder. As you get into radio astronomy, you’ll want to include such essentials as mixers, oscillators, and amplifiers to boost your signal.
Frequency is the name of the game in amateur radio astronomy, and most scopes are geared towards the 18 megahertz to 10,000 megahertz range. A program known as Radio-SkyPipe makes a good graphic interface to turn your laptop into a recorder.
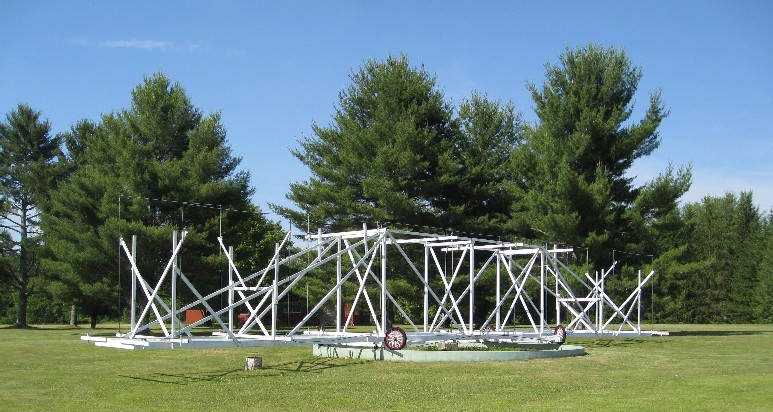
Radio astronomy was born in 1931, when Karl Jansky began researching the source of a faint background radio hiss with his dipole array while working for Bell Telephone. Jansky noticed the signal strength corresponded to the passage of the sidereal day, and correctly deduced that it was coming from the core of our Milky Way Galaxy located in the constellation Sagittarius. Just over a decade later, Australian radio astronomer Ruby Payne-Scott pioneered solar radio astronomy at the end of World War II, making the first ever observations of Type I and III solar bursts as well as conducting the first radio interferometry observations.
A replica of Jansky’s first steerable antenna at Green Bank, West Virginia. (Public Domain image)
What possible targets exist for the radio amateur astronomer? Well, just like those astronomers of yore, you’ll be able to detect the Sun, the Milky Way Galaxy, Geostationary and geosynchronous communication satellites and more. The simple dish system described above can also detect temperature changes on the surface of the Moon as it passes through its phases. Jupiter is also a fairly bright radio target for amateurs as well.
Radio meteors are also within the reach of your FM dial. If you’ve ever had your car radio on during a thunderstorm, you’ve probably heard the crackle across the radio spectrum caused by a nearby stroke of lightning. A directional antenna is preferred, but even a decent portable FM radio will pick up meteors on vacant bands outdoors. These are often heard as ‘pings’ or temporary reflections of distant radio stations off of the trail of ionized gas left in the wake of a meteor. Like with visual observing, radio meteors peak in activity towards local sunrise as the observer is being rotated forward into the Earth’s orbit.
Amateur SETI is also taking off, and no, we’re not talking about your crazy uncle who sits out at the end of runways watching for UFOs. BAMBI is a serious amateur-led project. Robert Gray chronicled his hunt for the elusive Wow! signal in his book by the same name, and continues an ad hoc SETI campaign. With increasingly more complex rigs and lots of time on their hands, it’s not out of the question that an amateur SETI detection could be achieved.
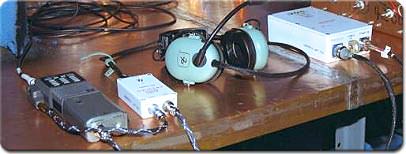
Another exciting possibility in radio astronomy is tracking satellites. HAM radio operators are able to listen in on the ISS on FM frequencies (click here for a list of uplink and downlink frequencies), and have even communicated with the ISS on occasion. AMSAT-UK maintains a great site that chronicles the world of amateur radio satellite tracking.
Amateur radio equipment that eventually made its way to to ISS aboard STS-106. (Credit: NASA).
Old TV dishes are being procured for professional use as well. One team in South Africa did just that back in 2011, scouring the continent for old defunct telecommunications dished to turn them into a low cost but effective radio array.
Several student projects exist out there as well. One fine example is NASA’s Radio JOVE project, which seeks student amateur radio observations of Jupiter and the Sun. A complete Radio Jove Kit, to include receiver and Radio-SkyPipe and Radio-Jupiter Pro software can be had for just under 300$ USD. You’d have a tough time putting together a high quality radio telescope for less than that! And that’s just in time for prime Jupiter observing as the giant planet approaches quadrature on April 1st (no fooling, we swear) and is favorably placed for evening observing, both radio and optical.
Fearing what the local homeowner’s association will say when you deploy your very own version of Jodrell Bank in your backyard? There are several online radio astronomy projects to engage in as well. SETI@Home is the original crowd sourced search for ET online. The Zooniverse now hosts Radio Galaxy Zoo, hunting for erupting black holes in data provided by the Karl Jansky Very Large Array and the Australia Telescope Compact Array. PULSE@Parkes is another exciting student opportunity that lets users control an actual professional telescope. Or you can just listen for meteor pings online via NASA’s forward scatter meteor radar based out of the Marshall Space Flight Center in Huntsville, Alabama. Adrian West also hosts live radio meteor tracking on his outstanding Meteorwatch website during times of peak activity.
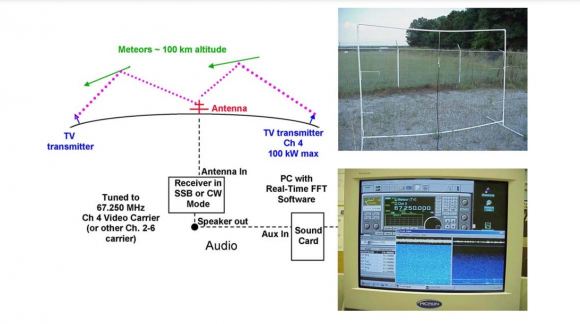
A diagram of a basic forward scatter radar system for meteor observing. Credit: NASA
Interested? Other possibilities exist for the advanced user, including monitoring radio aurorae, interferometry, catching the hiss of the cosmic microwave background and even receiving signals from more distant spacecraft, such as China’s Yutu rover on the Moon.
Think of this post as a primer to the exciting world of amateur radio astronomy. If there’s enough interest, we’ll do a follow up “how-to” article as we assemble and operate a functional amateur radio telescope. Or perhaps you’re an accomplished amateur radio astronomer, with some tips and tricks to share. There’s more to the universe than meets the eye!