What Is The Big Rip?

What Is The Big Rip?

Dr. Thad Szabo is a professor of physics and astronomy at Cerritos College. He’s also a regular contributor to many of our projects, like the Virtual Star Party and the Weekly Space Hangout. Thad has an encyclopedic knowledge of all things space, so we got him to explain a few fascinating concepts.

In this video, Thad explains the strange mystery of dark energy, and the even stranger idea of the Big Rip.

What is the ‘Big Rip?’

If we look at the expansion of the universe, at first it was thought that, as things are expanding while objects have mass, the mass is going to be attracted to other mass, and that should slow the expansion. Then, in the late 1990’s, you have the supernova surveys that are looking deeper into space than we’ve ever looked before, and measuring distances accurately to greater distances than we’ve ever seen before. Something really surprising came out, and that was what we’ll now use “dark energy” now to explain, and that is that the acceleration is not actually slowing down – it’s not even stopped. It’s actually getting faster, and if you look at the most distant objects, they’re actually moving away from us and the acceleration is increasing the acceleration of expansion. This is actually a huge result.

One of the ideas of trying to explain it is to use the “cosmological constant,” which is something that Einstein actually introduced to his field equations to try to keep the universe the same size. He didn’t like the idea of a universe changing, so he just kind of cooked up this term and threw it into the equations to say, alright, well if it isn’t supposed to expand or contract, if I make this little mathematical adjustment, it stays the same size.

Hubble comes along about ten years later, and is observing galaxies and measuring their red shifts and their distances, and says wait a minute – no the universe is expanding. And actually we should really credit that to Georges Lemaître, who was able to interpret Hubble’s data to come up with the idea of what we now call the Big Bang.

So, the expansion’s happening – wait, it’s getting faster. And now the attempt is to try to understand how dark energy works. Right now, most of the evidence points to this idea that the expansion will continue in the space between galaxies. That the forces of gravity, and especially magnetism and the strong nuclear force that holds protons and neutrons together in the center of an atom, would be strong enough that dark energy is never going to be able to pull those objects apart.

However, there’s a possibility that it doesn’t work like that. There’s actually a little bit of experimental evidence right now that, although it’s not well-established, that there’s a little bit of a bias with certain experiments that dark energy may get stronger over time. And, if it does so, the distances won’t matter – that any object will be pulled apart. So first, you will see all galaxies recede from each other, as space starts to grow bigger and bigger, faster and faster. Then the galaxies will start to be pulled apart. Then star systems, then planets from their stars, then stars themselves, and then other objects that would typically be held together by the much stronger forces, the electromagnetic force objects held by that will be pulled apart, and then eventually, nuclei in atoms.

So if dark energy behaves so that it gets stronger and stronger over time, it will eventually overcome everything, and you’ll have a universe with nothing left. That’s the ‘Big Rip’ – if dark energy gets stronger and stronger over time, it will eventually overcome any forces of attraction, and then everything is torn apart.

You can find more information from Dr. Thad Szabo at his YouTube channel.

‘You Cannot Press Pause While You’re Flying A Jet’: Why Planes Help Astronauts Prepare For Space

Astronauts use planes to prepare psychologically for the rigors of spaceflight, since they must constantly filter out information to proceed safely. Credit: Canadian Space Agency/Youtube (screenshot)

In between these sweet, sweet video shots of jets in the video above, you’ll find some wisdom about why it’s so important that astronauts climb into these planes for training. Turns out that flying has a lot to do with preparing for very quick-changing situations in spaceflight — whether it’s in a cockpit or in a spacesuit.

“Psychologically, being in an aircraft is very similar to being in a rocket because you are dependent on this machinery,” says astronaut David Saint-Jacques in this new Canadian Space Agency video.

“You are in an uncomfortable cockpit. You’re wearing a helmet, oxygen mask. There’s tens of dials in front of you. You have to monitor all that data; the radio, on many channels talking at the same time. You have to constantly filter out what is important and to make decisions that could have big impacts. You cannot press pause while you’re flying a jet.”

Saint-Jacques and fellow Canadian Jeremy Hansen took part in this video to mark the 110th anniversary of the Wright brothers’ first powered flight, which took place Dec. 17, 1903.

And there’s more to this video than jets — you can see astronauts participating in spacewalks and also the ongoing European Space Agency CAVES expedition series in Sardinia, Italy. There’s even a quick glimpse of the Snowbirds, a famous military flying demonstration team in Canada (which Hansen flew with earlier this year).

For more information on the T-38s used for astronaut training, check out this NASA link.

A T-38 plane parked in front of space shuttle Discovery in this undated photo taken by NASA astronaut Story Musgrave, who flew six times in space in the 1980s and 1990s.

When Science is Art: a New Map of Wind Patterns

Blah.

A new map of wind patterns is so visually stunning it’s easily mistaken for art.

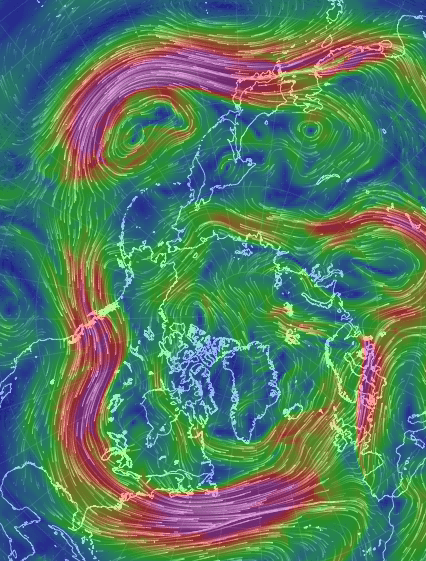
This interactive visualization of wind patterns — modeled from the U.S. National Weather Service’s Global Forecast System database — provides nearly current weather conditions on the global scale. And it’s beautiful.

In an interactive form, this data set allows the user to move the globe around (simply drag with your mouse) and zoom in and out (use your scroll wheel). After a few seconds the colors appear in snaking lines, depicting wind patterns at varying speeds. Gentle breezes are thin lines of green, strong winds are light streaks of yellow, and the strongest current are thick lines of red and purple.

A screenshot of the Earth's north pole at 5,500 meters.
A screen capture of the Earth’s north pole at 5,500 meters. The thick purple line is the polar jet stream.

Adjustable parameters also allow the user to view the wind patterns at various heights in the atmosphere, from 100 meters (noted as 1000 hPa in the program) to 26,500 meters (10 hPa) above the Earth’s surface. Simply click on the word “earth” in the lower left-hand corner of the web browser.

At the surface the map is a mirage of blue and green — with fairly gentle wind patterns in green. Circling patterns over the oceans are cyclones. They rotate clockwise over the southern Indian ocean and counter-clockwise over the northern Pacific ocean. If you turn your eyes toward land, you can compare the light summer winds across Australia with the swirling gusts off the northeast coast of Japan.

But you can also graze the jet streams, where thick bands of purple and red dance among the less violent green and yellow streaks. The wavy polar jet stream is entering the U.S. near Seattle, dropping southward near the Rocky Mountains, and then turning northward again just beyond the Great Lakes.  It creates a temperature boundary, where south of the jet stream is warm and north of the jet stream is cold.

Users can view seven different altitudes using eight different map projections. This surprising new look at our own world is stunning in its artistic and educative beauty.

Comet Tourism Flight Trades ISON For Lovejoy

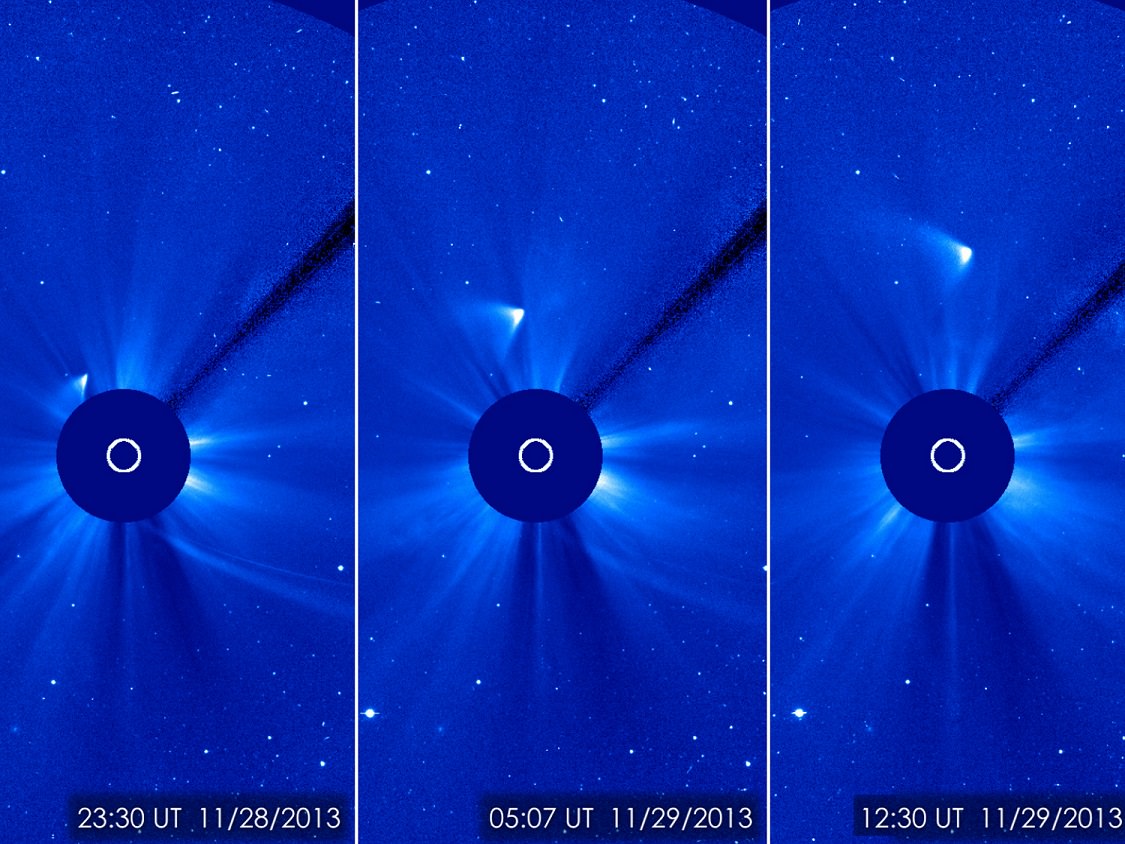
Bright, brighter, brightest: these views of Comet ISON after its closest approach to the sun Nov. 28 show that a small part of the nucleus may have survived the comet's close encounter with the sun. Images from the Solar and Heliospheric Observatory. Credit: ESA/NASA/SOHO/GSFC

When Comet ISON entered its zombie stage a few weeks ago, the effects were not only felt in the astronomical community, but also on astronomy tourists as the comet faded from the view of amateurs.

German company “Eclipse-Reisen” (Eclipse Travel) had to make a last-minute change in plans for a Dec. 8 flight for some 75 tourists planning to observe ISON, which morphed into a travelling dust blob after skimming too close to the sun in late November. Fortunately, Comet Lovejoy is still a strong astronomical object, providing an alternate thing to watch.

“Most of the passengers weren’t disappointed. They were more excited to see something new. Only a few journalists cancelled the flight. All photographers and experts fully understood the situation,” a statement from Air Partner to Universe Today said. (The spokespeople were German-speaking, requiring a translation by another party.)

Negative image taken Nov. 14 of Lovejoy's nucleus and dust fan. Credit: Dr. P. Clay Sherrod
Negative image taken Nov. 14 of Lovejoy’s nucleus and dust fan. Credit: Dr. P. Clay Sherrod

“Comet Lovejoy is no less spectacular and still very exciting like ISON and they were pleased to see it, actually. Although Lovejoy is less bright than ISON, it is weaker by four size classes, its tail is smaller and pale and Lovejoy flies farther past the Earth and the Sun.”

The company had to ask for permission to alter its flight path, and inform the passengers of the last-minute change, all in a few days, but officials added that the flight went off without a hitch.

You can read more information about the company (in German) on its website. In 2014, it plans to run a flight to observe auroras over Iceland, among others.

How Scientists Confirmed The Mass Of An Invisible Exoplanet

Artist's conception of Kepler-88. Credit: Center for Astrophysics of the University of Porto

Planets are so very tiny next to stars outside of the solar system, making it really hard to spot exoplanets unless they transit across the face of their star (or if they are very, very big). Often, astronomers can only infer the existence of planets by their effect on the host star or other stars.

That’s especially true of the curious case of Kepler-88 c, which researchers using the Kepler space telescope said was a possible planet due to its effects on the orbit of Kepler-88 b, a planet that goes across the host of its host star. European astronomers just confirmed the Kepler data using the SOPHIE spectrograph  at France’s Haute-Provence Observatory.

It’s the first time scientists have successfully used a technique to independently verify a planet’s mass based on what was found from the transit timing variation, or how a planet’s orbit varies from what is expected as it goes across the face of its sun. That means TTV can likely be used as a strong method on its own, advocates say.

Illustration of the Kepler spacecraft (NASA/Kepler mission/Wendy Stenzel)

SOPHIE’s technique relies on measuring star velocity, which also can reveal a planet’s mass by seeing its effect on the star.

“This independent confirmation is a very important contribution to the statistical analyzes of the Kepler multiple planet systems,” stated Magali Deleuil, an exoplanet researcher at Aix-Marseille University who participated in the research. “It helps to better understand the dynamical interactions and the formation of planetary systems.”

Actually, the two planets behave similarly to Earth and Mars in our own solar system in terms of orbits, according to work from a previous team (led by David Nesvorny of the Southwest Research Institute). They predicted the planets have a two-to-one resonance, which is approximately true of our own solar system since Mars takes about two Earth years to orbit the sun.

The new research was led by S.C.C. Barros at Aix-Marseille University in France. You can read the study in the Dec. 17 edition of Astronomy & Astrophysics, or in preprint version on Arxiv.

Source: Center for Astrophysics at the University of Porto

Lithopanspermia: How Earth May Have Seeded Life on Other Solar System Bodies

The theory of Lithopanspermia states that life can be shared between planets within a planetary system. Credit: NASA

With the recent discovery that Europa has geysers, and therefore definitive proof of a liquid ocean, there’s a lot of talk about the possibility of life in the outer solar system.

According to a new study, there is a high probably that life spread from Earth to other planets and moons during the period of the late heavy bombardment — an era about 4.1 billion to 3.8 billion years ago — when untold numbers of asteroids and comets pummeled the Earth. Rock fragments from the Earth would have been ejected after a large meteoroid impact, and may have carried the basic ingredients for life to other solar system bodies.

These findings, from Pennsylvania State University, strongly support lithopanspermia: the idea that basic life forms can be distributed throughout the solar system via rock fragments cast forth by meteoroid impacts.

Strong evidence for lithopanspermia is found within the rocks themselves. Of the over 53,000 meteorites found on Earth, 105 have been identified as Martian in origin. In other words an impact on Mars ejected rock fragments that then hit the Earth.

The researchers simulated a large number of rock fragments ejected from the Earth and Mars with random velocities. They then tracked each rock fragment in n-body simulations — models of how objects gravitationally interact with one another over time — in order to determine how the rock fragments move among the planets.

“We ran the simulations for 10 million years after the ejection, and then counted up how many rocks hit each planet,” said doctoral student Rachel Worth, lead author on the study.

Their simulations mainly showed a large number of rock fragments falling into the Sun or exiting the solar system entirely, but a small fraction hit planets. These estimations allowed them to calculate the likelihood that a rock fragment might hit a planet or a moon. They then projected this probability to 3.5 billion years, instead of 10 million years.

In general the number of impacts decreased with the distance away from the planet of origin. Over the course of 3.5 billion years, tens of thousands of rock fragments from the Earth and Mars could have been transferred to Jupiter and several thousand rock fragments could have reached Saturn.

“Fragments from the Earth can reach the moons of Jupiter and Saturn, and thus could potentially carry life there,” Worth told Universe Today.

The researchers looked at Jupiter’s Galilean satellites: Io, Europa, Ganymede and Callisto and Saturn’s largest moons: Titan and Enceladus. Over the course of 3.5 billion years, each of these moons received between one and 10 meteoroid impacts from the Earth and Mars.

It’s statistically possible that life was carried from the Earth or Mars to one of the moons of Jupiter or Saturn. During the period of late bombardment the solar system was much warmer and the now icy moons of Saturn and Jupiter didn’t have those protective shells to prevent meteorites from reaching their liquid interiors. Even if they did have a thin layer of ice, there’s a large chance that a meteorite would fall though, depositing life in the ocean beneath.

In the case of Europa, six rock fragments from the Earth would have hit it over the last 3.5 billion years.

It has previously been thought that finding life in Europa’s oceans would be proof of an independent origin of life. “But our results suggest we can’t assume that,” Worth said. “We would need to test any life found and try to figure out whether it descended from Earth life, or is something really new.”

The paper has been accepted for publication in the journal Astrobiology and is available for download here.


Tonight: The Rise of the 2013 “Mini-Moon”

The December 2010 Solstice Moon.

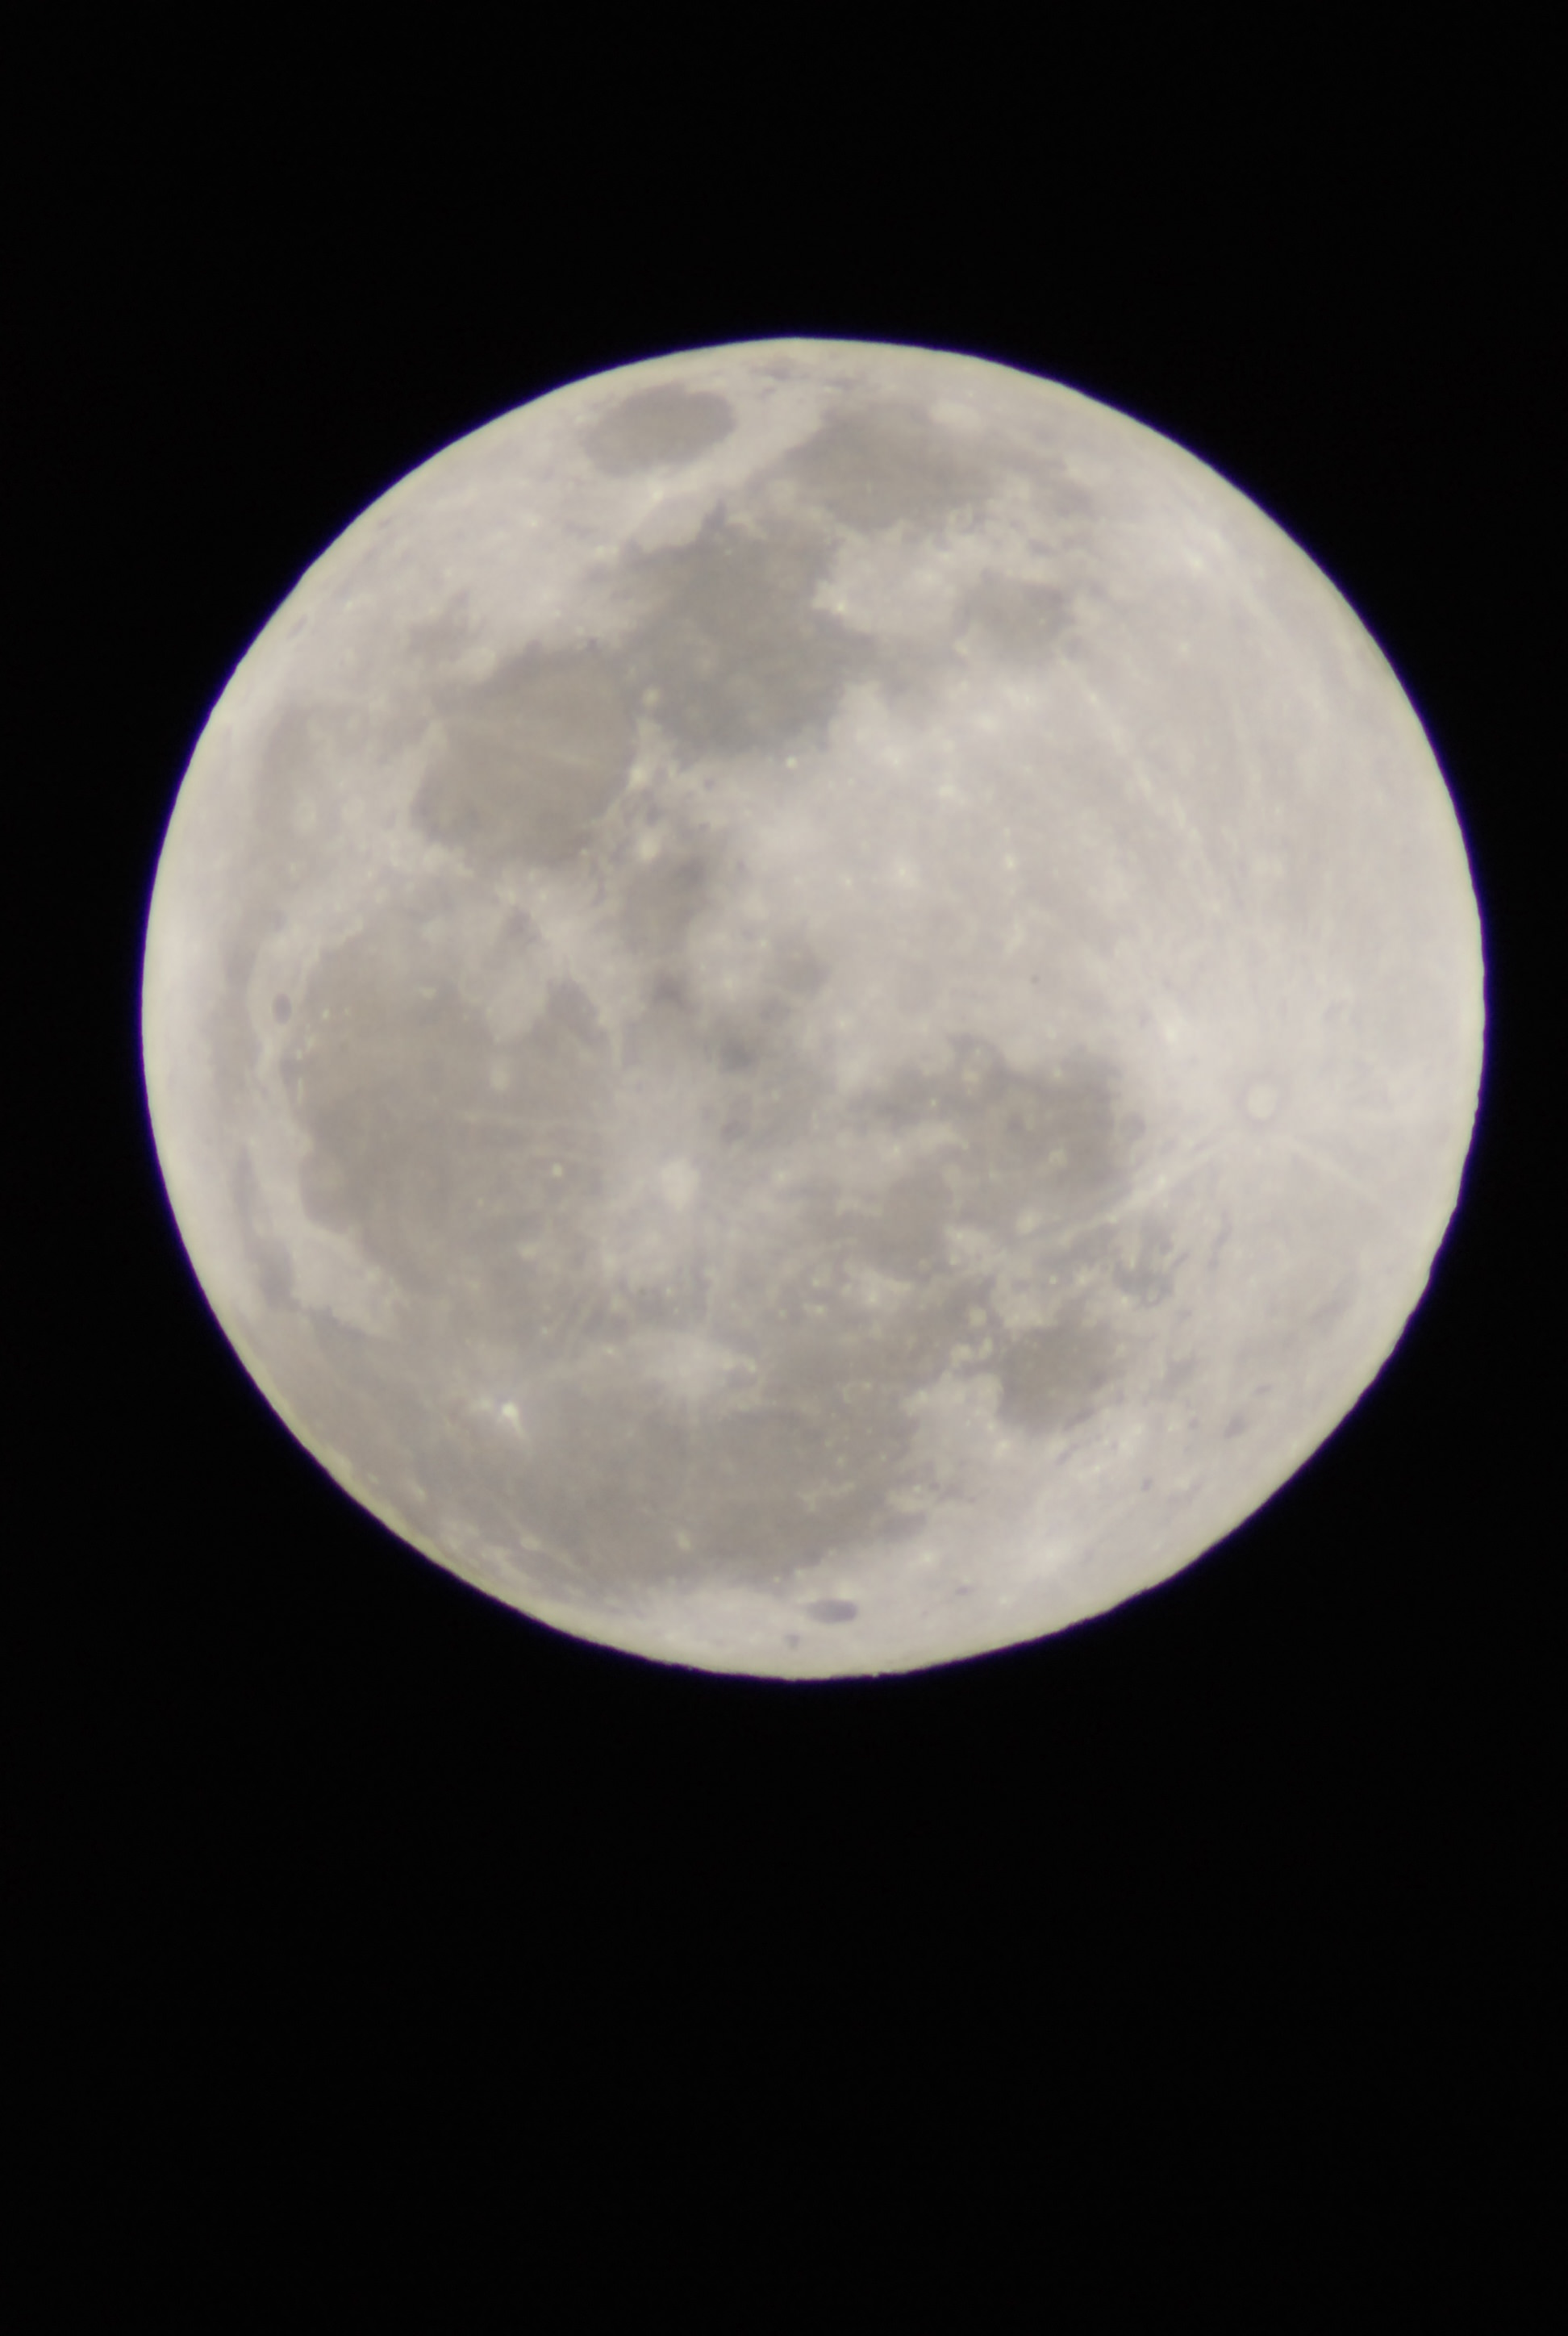
  The final Full Moon of 2013 occurs tonight, and along with it comes something special: the most distant and visually smallest Full Moon of 2013.

Why doesn’t the annual “mini-moon” receive the same fanfare and hype that the yearly perigee – or do you say Proxigean to be uber-obscure – “supermoon” does? The smallest Full Moon of the year does appear to have a public relations problem in this regard. But as you’ll see, the circumstances for this week’s Full Moon are no less fascinating.

The exact timing of tonight’s Full Moon occurs at 4:28 AM EST/9:28 Universal Time (UT) on Tuesday, December 17th. This occurs just two days and 14 hours prior to the Moon reaching apogee on December 19th at 6:50PM EST/23:50 UT at 406,267 kilometres distant. This is one of the three most distant apogees of 2013, and the closest to Full for the year. It’s also with 500 kilometres of the most distant apogee than can occur, as the Moon’s apogee can vary between ~404,000 and 406,700 kilometres distant.

Tonight’s Full Moon will have an apparent angular diameter of around 29.8’ arc minutes, just a shade lower than the usual value quoted of around half a degree or 30’. The visual size of the Moon as seen from the Earth varies about 12% from 34.1’ to 29.3’. Also, the Moon is also about half an Earth radius more distant when it’s on the local horizon versus at the zenith overhead!

This is also the closest Full Moon to the December solstice, which occurs four days later on Saturday, December 21st at 12:11 PM EST/17:11 UT. This marks the start of astronomical summer in the southern hemisphere and the beginning of the winter season in the north. Think of tonight’s Full Moon as a sort of “placeholder,” marking the point at which the Sun will occupy during the June solstice on the Gemini-Taurus border.

This all means that tonight’s Full Moon rides high for northern hemisphere residents towards local midnight. But the “Long Night’s Moon” of 2013 is rather lackluster in terms of declination. While it’s the northernmost Full Moon of 2013 at a declination of +18.7 degrees, it’s a far cry from the maximum declination of +28.72 degrees (the angle of the ecliptic plus the tilt of the Moon’s orbit) that it can achieve. This only occurs every 18.6 years and last occurred in 2006 and will happen again around 2025. We’re currently headed towards a shallow minimum for the Moon’s orbit in 2015. Ancient European and Native American cultures both knew of this cycle of high-flying moons.

Not weird enough? The next “most distant Full Moon of the Year” happens only one lunation later on January 16th… within just 2 hours of apogee! Perhaps January’s Full Moon is due notoriety as a “Super-Mini Moon?” Such a pairing of “mini-moons” last occurred on 2004-2005 and will next occur on 2021-2022.

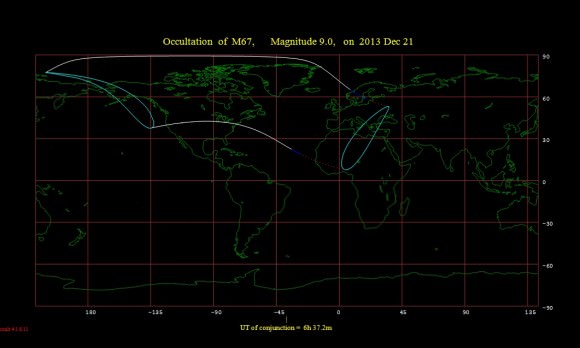
The footprint for the lunar occultation of M67. (Created by the author using Occult 4.0)
The footprint for the lunar occultation of M67. (Created by the author using Occult 4.1)

The Moon also visits some other celestial sights this week. After passing five degrees north of Jupiter on December 19th, the Moon heads towards an occultation of the open cluster M67 in the constellation Cancer on December 21st for northern North America. Though the Moon will be waning gibbous, it might just be possible to note the reappearance of the cluster on the Moon’s dark limb. Other occultations for the remainder of December by the Moon include an occultation of Spica on December 27th for northern Asia, Saturn on December 29th for Antarctica, and +3.6th magnitude star Lambda Geminorum for Canada on December 18th.

The passing of the Full Moon also means it will be entering into the morning sky, which also means bad news for viewers of the Ursid meteor shower which peaks on December 22nd and hunters of Comet C/2013 R1 Lovejoy, currently shining at +5th magnitude in the constellation Hercules low in the dawn.

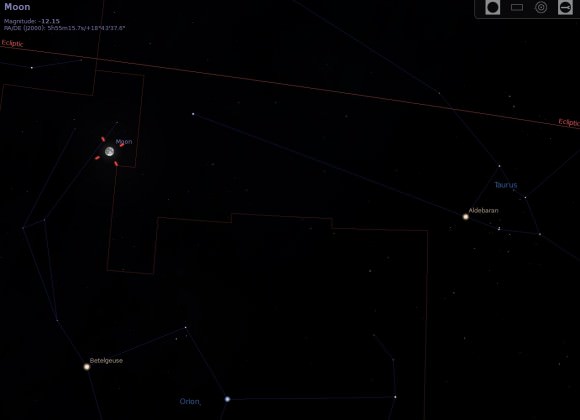
Moon crossing Orion.
Moon crossing Orion this week. (Credit: Stellarium).

The keen-eyed may notice the Moon also transits through the northern end of the non-zodiacal constellation of Orion on Tuesday, December 17th. Did you know that the Moon can actually stray far enough away from the ecliptic to cross through 18 constellations? The Six non-zodiacal constellations it can transit are: Orion, Ophiuchus, Corvus, Sextans, Auriga and Cetus.

Other names for the December Full Moon include the Yule, Oak, and Cold Moon.

Finally, a new Earthly ambassador is now roaming the lunar surface.

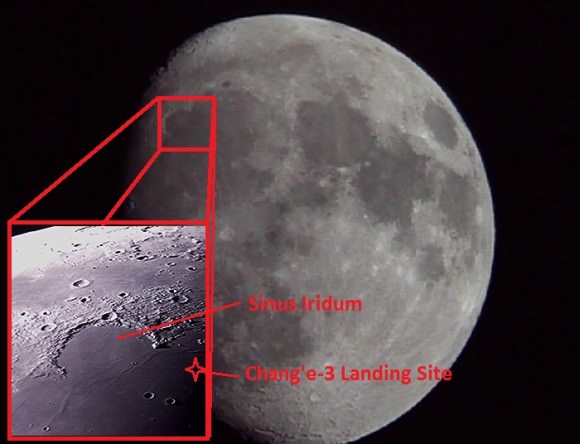
China’s Chang’E-3 spacecraft landed on the Moon just outside of the Bay of Rainbows (Sinus Iridum) near Montes Recti in the northern section of the Mare Imbrium on Saturday, December 14th. The landing site is visible now on the lunar nearside, and can be seen with that new Christmas telescope you’ve been itching to try out. Look for the Sinus Iridum as a wide crescent scarp, a sort of “notch” in the top of Mare Imbrium:

Finding the landing site of Chang'e-3. Photos and graphics by author.
Finding the landing site of Chang’e-3. Photos and graphics by author.

China’s Yutu or “Jade Rabbit” rover has been beaming back some splendid images of the lunar surface!

So don’t let the cold temperatures deter you from exploring the lunar surface, and the strange but fascinating motions of our nearest natural celestial neighbor. Dress warm and be sure this Christmas season to raise a glass of ye ole Nog to the Solstice/Yule Moon.

Thousands Of Supermassive Black Holes Could Lurk In New X-Ray Data

Artist's conception of the SWIFT satellite in the act of capturing a gamma-ray burst. Credit: NASA

Supermassive black holes likely are behind most of the nearly 100,000 new X-ray sources plotted by the Swift X-ray Telescope, according to findings led by the University of Leicester in the United Kingdom. The results came from poring over eight years of data produced by the Swift space observatory.

“Stars and galaxies emit X-rays because the electrons in them move at extremely high speeds, either because they are very hot (over a million degrees) or because extreme magnetic fields accelerate them. The underlying cause is usually gravity; gas can be compressed and heated as it falls on to black holes, neutron stars and white dwarfs or when trapped in the turbulent magnetic fields of stars like our Sun,” the university stated.

“Most of the newly discovered X-ray sources are expected to signal the presence of super-massive black holes in the centers of large galaxies many millions of light-years from earth, but the catalog also contains transient objects (short-lived bursts of X-ray emission) which may come from stellar flares or supernovae.”

The results were published in The Astrophysical Journal, which you can read here. You can also read the prepublished version on Arxiv.


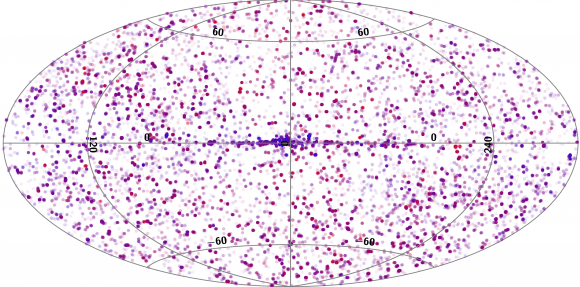
Plot points across the sky showing the new X-ray sources that the SWIFT satellite found. Blue represents higher-energy sources, and red lower-energy ones. The line represents the galactic plane, where many of the sources are concentrated. Source: Evans (University of Leicester)
Plot points across the sky showing the new X-ray sources that the SWIFT satellite found. Blue represents higher-energy sources, and red lower-energy ones. The line represents the galactic plane, where many of the sources are concentrated. Source:
Evans (University of Leicester)

When Is a Star Not a Star?

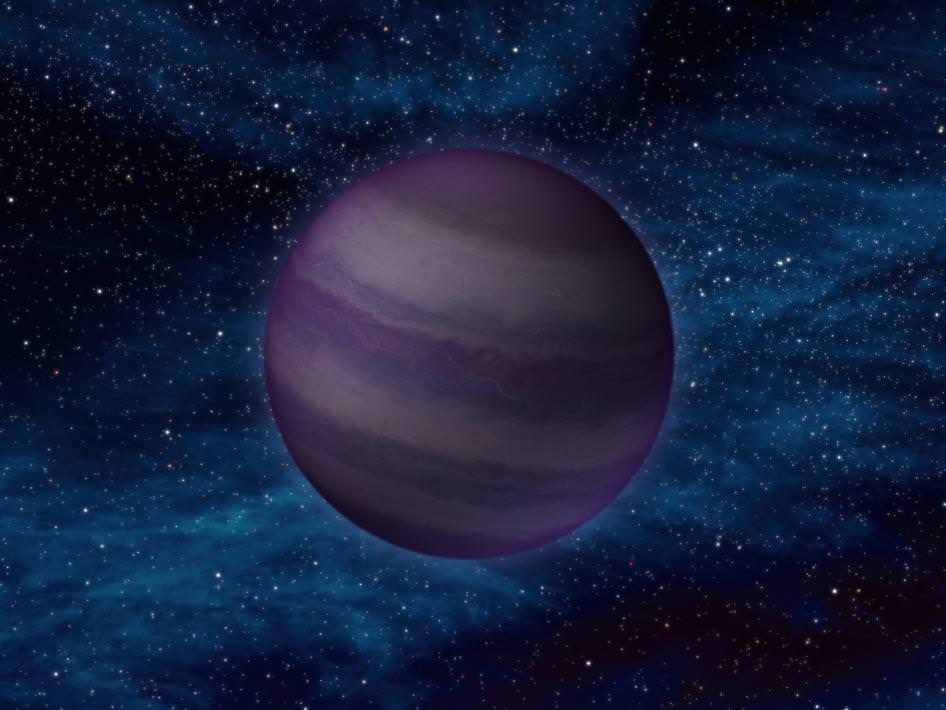
Artist's impression of a Y-dwarf, the coldest known type of brown dwarf star. (NASA/JPL-Caltech)

When it’s a brown dwarf — but where do we draw the line?

Often called “failed stars,” brown dwarfs are curious cosmic creatures. They’re kind of like swollen, super-dense Jupiters, containing huge amounts of matter yet not quite enough to begin fusing hydrogen in their cores. Still, there has to be some sort of specific tipping point, and astronomers (being the scientists that they are) would like to know: when does a brown dwarf stop and a star begin?

Researchers from Georgia State University now have the answer.

From a press release issued Dec. 9 from the National Optical Astronomy Observatory (NOAO):

For most of their lives, stars obey a relationship referred to as the main sequence, a relation between luminosity and temperature – which is also a relationship between luminosity and radius. Stars behave like balloons in the sense that adding material to the star causes its radius to increase: in a star the material is the element hydrogen, rather than air which is added to a balloon. Brown dwarfs, on the other hand, are described by different physical laws (referred to as electron degeneracy pressure) than stars and have the opposite behavior. The inner layers of a brown dwarf work much like a spring mattress: adding additional weight on them causes them to shrink. Therefore brown dwarfs actually decrease in size with increasing mass.

Read more: The Secret Origin Story of Brown Dwarfs

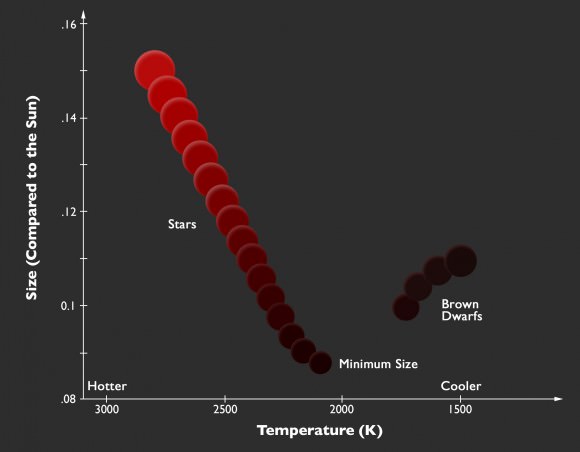
As Dr. Sergio Dieterich, the lead author, explained, “In order to distinguish stars from brown dwarfs we measured the light from each object thought to lie close to the stellar/brown dwarf boundary. We also carefully measured the distances to each object. We could then calculate their temperatures and radii using basic physical laws, and found the location of the smallest objects we observed (see the attached illustration, based on a figure in the publication). We see that radius decreases with decreasing temperature, as expected for stars, until we reach a temperature of about 2100K. There we see a gap with no objects, and then the radius starts to increase with decreasing temperature, as we expect for brown dwarfs. “

Dr. Todd Henry, another author, said: “We can now point to a temperature (2100K), radius (8.7% that of our Sun), and luminosity (1/8000 of the Sun) and say ‘the main sequence ends there’ and we can identify a particular star (with the designation 2MASS J0513-1403) as a representative of the smallest stars.”

The relation between size and temperature at the point where stars end and brown dwarfs begin (based on a figure from the publication) Image credit: P. Marenfeld & NOAO/AURA/NSF.

“We can now point to a temperature (2100K), radius (8.7% that of our Sun), and luminosity (1/8000 of the Sun) and say ‘the main sequence ends there’.”

Dr. Todd Henry, RECONS Director

Aside from answering a fundamental question in stellar astrophysics about the cool end of the main sequence, the discovery has significant implications in the search for life in the universe. Because brown dwarfs cool on a time scale of only millions of years, planets around brown dwarfs are poor candidates for habitability, whereas very low mass stars provide constant warmth and a low ultraviolet radiation environment for billions of years. Knowing the temperature where the stars end and the brown dwarfs begin should help astronomers decide which objects are candidates for hosting habitable planets.

The data came from the SOAR (SOuthern Astrophysical Research) 4.1-m telescope and the SMARTS (Small and Moderate Aperture Research Telescope System) 0.9-m telescope at the Cerro Tololo Inter-American Observatory (CTIO) in Chile.

Read more here.

This Picture Symbolizes The Changing Mission Of One Plucky Spacecraft

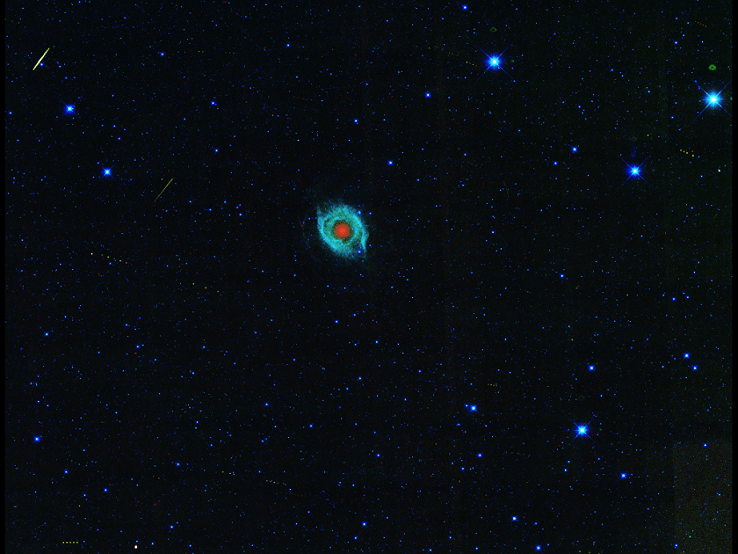
The Helix nebula is visible in the center of this image, surrounded by tracks of asteroids that are much closer to Earth (yellow dots). Click on the image to see them. The streaks you see are from satellites or cosmic rays. Credit: NASA/JPL-Caltech/UCLA

Besides being a darn pretty picture of the Helix nebula, this snapshot is a bit of symbolism for NASA. The spacecraft that nabbed this view is called the Wide-field Infrared Survey Explorer, or WISE. If you look very carefully — you may have to click on the picture for a closer view — you can see little dots showing the paths of asteroids in the picture. (The streaks are cosmic rays and satellites.)

WISE has an interesting history. It began as a telescope seeking secrets of the universe in infrared light, but ran out of coolant in 2010 and was repurposed for asteroid searching under the NEOWISE mission. It wrapped up its mission, was put into hibernation in February 2011, then reactivated this August to look for asteroids again for at least the next three years. You can see some pictures and data WISE collected during its mission below the jump.

It’s a nice way, NASA said, to celebrate the fourth anniversary of WISE’s launch. “WISE is the spacecraft that keeps on giving,” said Ned Wright of UCLA, who was the principal investigator of WISE before it transitioned into NEOWISE.

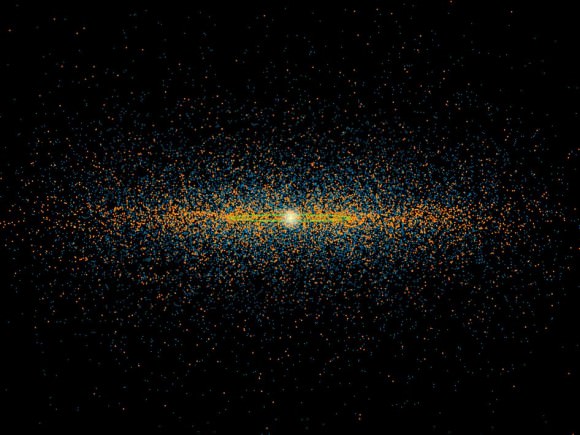
New results from NASA's NEOWISE survey find that more potentially hazardous asteroids, or PHAs, are closely aligned with the plane of our solar system than previous models suggested. Image credit: NASA/JPL-Caltech
Results from NASA’s NEOWISE survey find that more potentially hazardous asteroids, or PHAs, are closely aligned with the plane of our solar system than previous models suggested. Image credit: NASA/JPL-Caltech
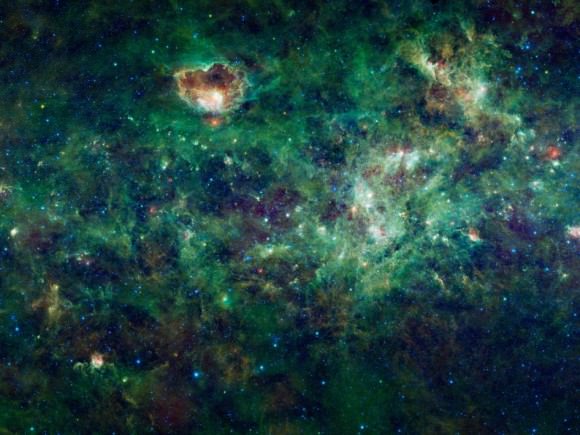
This enormous section of the Milky Way galaxy is a mosaic of images from NASA's Wide-field Infrared Survey Explorer, or WISE. The constellations Cassiopeia and Cepheus are featured in this 1,000-square degree expanse. Image credit: NASA/JPL-Caltech/UCLA
This enormous section of the Milky Way galaxy is a mosaic of images from NASA’s Wide-field Infrared Survey Explorer, or WISE. The constellations Cassiopeia and Cepheus are featured in this 1,000-square degree expanse. Image credit: NASA/JPL-Caltech/UCLA
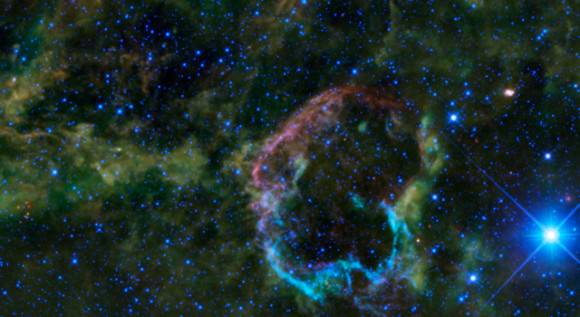
This oddly colorful nebula is the supernova remnant IC 443 as seen by WISE. Image credit: NASA/JPL-Caltech/UCLA