Early Supermassive Black Holes First Formed as Twins

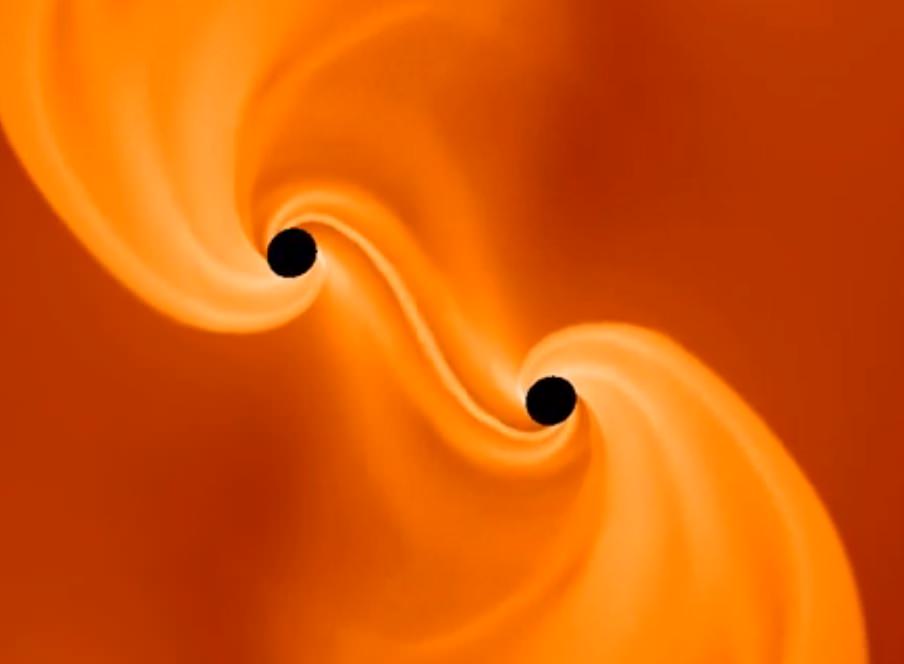
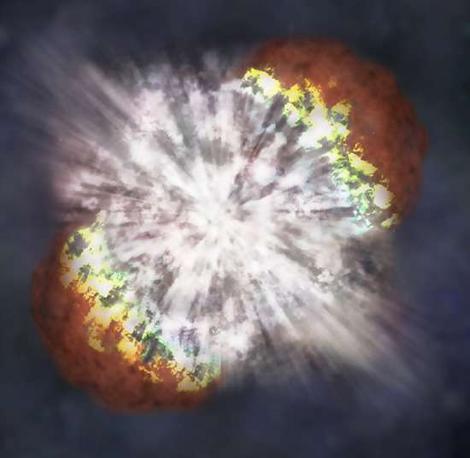
Two nascent black holes formed by the collapse of an early supergiant star. From a visualization by by Christian Reisswig (Caltech).

It’s one of the puzzles of cosmology and stellar evolution: how did supermassive black holes get so… well, supermassive… in the early Universe, when seemingly not enough time had yet passed for them to accumulate their mass through steady accretion processes alone? It takes a while to eat up a billion solar masses’ worth of matter, even with a healthy appetite and lots within gravitational reach. But yet there they are: monster black holes are common within some of the most distant galaxies, flaunting their precocious growth even as the Universe was just celebrating its one billionth birthday.

Now, recent findings by researchers at Caltech suggest that these ancient SMBs were formed by the death of certain types of primordial giant stars, exotic stellar dinosaurs that grew large and died young. During their violent collapse not just one but two black holes are formed, each gathering its own mass before eventually combining together into a single supermassive monster.

Watch a simulation and find out more about how this happens below:

From a Caltech news article by Jessica Stoller-Conrad:

To investigate the origins of young supermassive black holes, Christian Reisswig, NASA Einstein Postdoctoral Fellow in Astrophysics at Caltech and Christian Ott, assistant professor of theoretical astrophysics, turned to a model involving supermassive stars. These giant, rather exotic stars are hypothesized to have existed for just a brief time in the early Universe.

Read more: How Do Black Holes Get Super Massive?

Unlike ordinary stars, supermassive stars are stabilized against gravity mostly by their own photon radiation. In a very massive star, photon radiation—the outward flux of photons that is generated due to the star’s very high interior temperatures—pushes gas from the star outward in opposition to the gravitational force that pulls the gas back in.

During its life, a supermassive star slowly cools due to energy loss through the emission of photon radiation. As the star cools, it becomes more compact, and its central density slowly increases. This process lasts for a couple of million years until the star has reached sufficient compactness for gravitational instability to set in and for the star to start collapsing gravitationally.

Previous studies predicted that when supermassive stars collapse, they maintain a spherical shape that possibly becomes flattened due to rapid rotation. This shape is called an axisymmetric configuration. Incorporating the fact that very rapidly spinning stars are prone to tiny perturbations, Reisswig and his colleagues predicted that these perturbations could cause the stars to deviate into non-axisymmetric shapes during the collapse. Such initially tiny perturbations would grow rapidly, ultimately causing the gas inside the collapsing star to clump and to form high-density fragments.

“The growth of black holes to supermassive scales in the young universe seems only possible if the ‘seed’ mass of the collapsing object was already sufficiently large.”

– Christian Reisswig, NASA Einstein Postdoctoral Fellow at Caltech
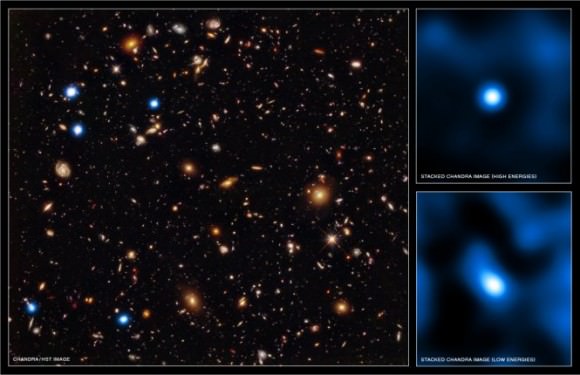
Composite image from Chandra and Hubble showing supermassive black holes in the early Universe.

These fragments would orbit the center of the star and become increasingly dense as they picked up matter during the collapse; they would also increase in temperature. And then, Reisswig says, “an interesting effect kicks in.” At sufficiently high temperatures, there would be enough energy available to match up electrons and their antiparticles, or positrons, into what are known as electron-positron pairs. The creation of electron-positron pairs would cause a loss of pressure, further accelerating the collapse; as a result, the two orbiting fragments would ultimately become so dense that a black hole could form at each clump. The pair of black holes might then spiral around one another before merging to become one large black hole.

“This is a new finding,” Reisswig says. “Nobody has ever predicted that a single collapsing star could produce a pair of black holes that then merge.”

These findings were published in Physical Review Letters the week of October 11. Source: Caltech news article by Jessica Stoller-Conrad.

Bright Venus Takes Center Stage in November

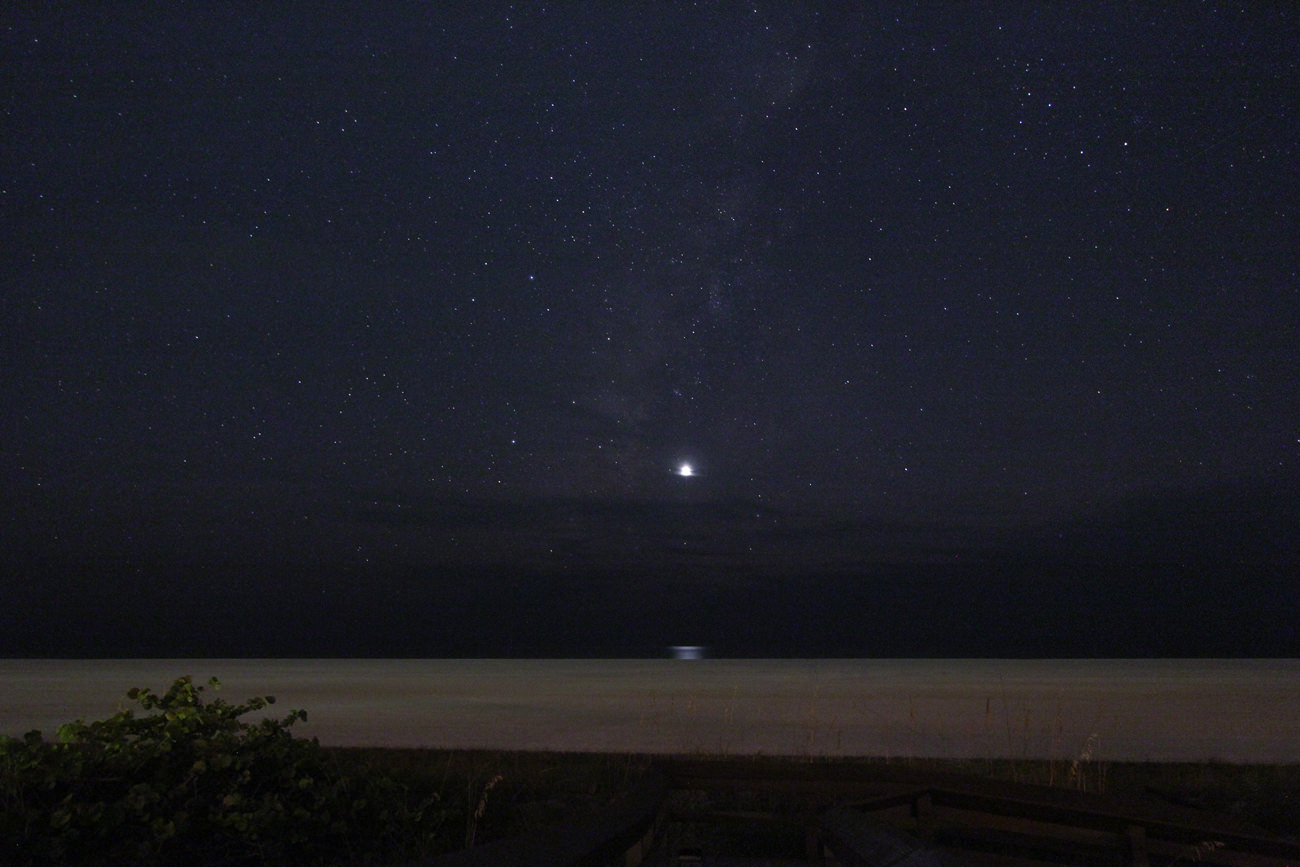
(Credit: Brian McGaffney/Nutwood Observatory).

“What’s that bright object to the southwest at dusk?” We’ve already fielded more than a few such questions as Earth’s sister world shines in the dusk sky.  Venus just passed its maximum elongation 47 degrees east of the Sun on November 1st, and currently shines at a brilliant magnitude -4.46. This is almost 16 times brighter than the brightest star in the sky, -1.46th magnitude Sirius.

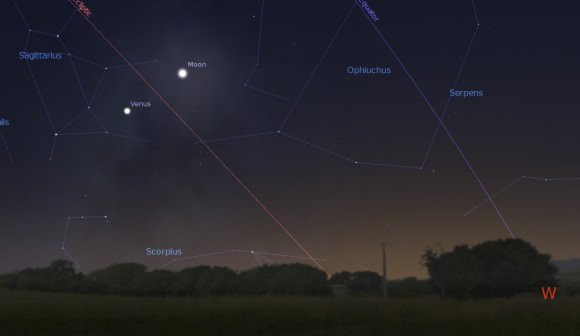
Venus and the waxing crescent Moon, looking to the west tonite at 30 minutes after sunset for latitude 30 degrees north. (Created using Stellarium).

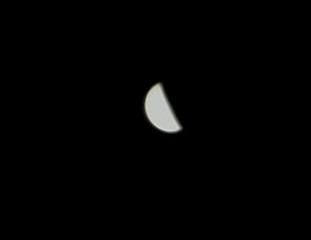
Just like the Moon, Venus goes through a full range of phases. Through the telescope, Venus currently presents a 26.7” diameter disk. That size will swell to almost 40” by month’s end, as Venus begins to approach the Earth and presents a noticeable crescent phase. We just passed dichotomy — the theoretical point where Venus presents a half-illuminated phase as seen from Earth — on October 31st, and Venus already shows a noticeable crescent:

Venus on the night of November 5th 2013, a quick stack of about 200 frames. (Photo by Author)

Note that we say “theoretical” because there’s typically a discrepancy of a day or two between predicted and observed dichotomy. This is also known as Schröter’s Effect. One probable cause for this is the dazzling appearance of the disk of Venus. We typically use a variable polarizing filter to cut the glare of Venus down at the eyepiece.

You might also note that Venus currently occupies the “basement” of the zodiac in the constellation Sagittarius. In fact, the planet is currently as far south as it can go, sitting at a declination of -27° 14’ on this very evening. You have to go all the way back to 1930 to find a more southerly declination of Venus, just 12’ lower!

But you won’t have to wait much longer to break that record, as the chart below shows for the most southerly declinations of Venus for the next half century:

Year Date Declination
2013 November 6th -27° 09’
2021 “            “ -27° 14’
2029 “            “ -27° 18’
2037 “            “ -27° 23’
2045 “            “ -27° 29’
2053 “            “ -27° 34’
2061 “            “ -27° 39’


Note that each event occurs on November 6th, and they’re spaced 8 years apart. Apparitions of Venus closely duplicate their paths in the sky over an 8 year cycle. This is because the planet nearly completes 13 orbits of the Sun for our 8. Venus “catches up” to the Earth on its interior orbit once every 584 days to reach inferior conjunction. It usually passes above or below the Sun from our vantage point, though last year it transited, a feat that won’t be witnessed again until 2117 AD.

How far south can Venus go? Well, its orbit is tilted 3.4 degrees relative to the ecliptic. It can reach a southern declination of -28 05’, though you have to go way back to 1874 for its last occurrence!

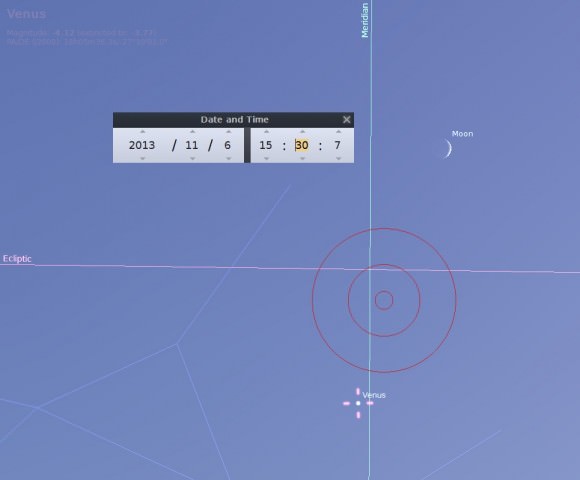
Today is also a great time to try your hand at spotting Venus in the daytime, as a 3-day old waxing crescent Moon lies about eight degrees to its upper right:

A daytime Venus near the Moon transiting to the south at about 3:30PM EST today. A 5 degree wide Telrad "bullseye" is provided for scale. (Credit: Stellarium).
A daytime Venus near the Moon, transiting to the south at about 3:30PM EST today. A 5 degree wide Telrad “bullseye” is provided for scale. (Credit: Stellarium).

Note that seeing Venus in the daytime is surprisingly easy, once you known exactly where to look for it. Your best chances are around mid-afternoon at about 3PM local, when the daytime Moon and Venus lie highest in the southern sky. Did you know that Venus is actually intrinsically brighter per square arc second than the Moon? It’s true! The Moon actually has a very low reflective albedo of 12% — about the equivalent of fresh asphalt — while the cloud tops of Venus are more akin the fresh snow with an albedo of about 80%.

Its also worth checking out Venus and its local environs after nightfall as it passes near the Lagoon (M8) and the Trifid nebula (M8) on the night of November 6th. Continuing with its trek across the star rich plane of the heart of the Milky Way galaxy, Venus also passes near the globular cluster M22 on November 13th.

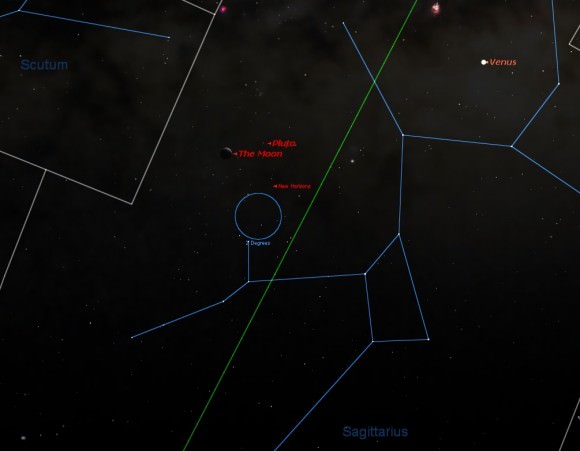
Venus also sits in the general of Pluto on November 15th, lying just 6.6 degrees south of it. Be sure to wave in the general direction of NASA’s New Horizons spacecraft bound for Pluto in July 2015 tonight as well, using the Moon and Venus for a guide:

The position of the Moon, Venus, Pluto, & New Horizons on the night of November 6th, 2013. (Created using Starry Night Education Software).
The position of the Moon, Venus, Pluto, & New Horizons at 14UT on November 7th, 2013. (Created using Starry Night Education Software).

Another shot at seeing Venus paired with the Moon occurs on December 5th.

Venus also presents a maximum area of illumination on December 6th, and will shine at its brightest on December 10th at magnitude -4.7. Can you catch it casting a shadow? The best time to search for this illusive phenomenon would be just before New Moon on December 2nd. A dark sky site away from any other sources of illumination, and a snow covered ground providing high contrast also helps. Fortunately, snow isn’t in short supply in the northern hemisphere in December!

Venus is currently the only naked eye planet in the November early evening sky. We always thought that it’s a bit of a cosmic irony that the nearest planet presents a dazzling, but featureless white disk as seen from Earth. Diligent amateurs have, however, been able to tease out cloud patterns on Venus using UV filters.

Another elusive phenomenon to watch for as Venus reaches a crescent phase is ashen light. Long reported by observers, a faint glow on the night side of Venus is something that persists, but shouldn’t be. A similar effect seen on the night side of the Moon known as Earthshine is easily explained by sunlight being reflected off of the Earth… but Venus has no moon. What gives? Frequent explanations over the years have been aurorae, electrical activity, airglow, or, more frequently cited, observer bias. The brain wants to see a filled in space, and promptly inserts it betwixt the dazzling horns of the planet.

Keep an eye on Venus as it reaches maximum brilliancy and heads towards inferior conjunction on January 11th, 2014, and a rare chance to see it on said date… more to come!


This Is How The World’s Largest Radio Telescope Is Divvying Up Design Work

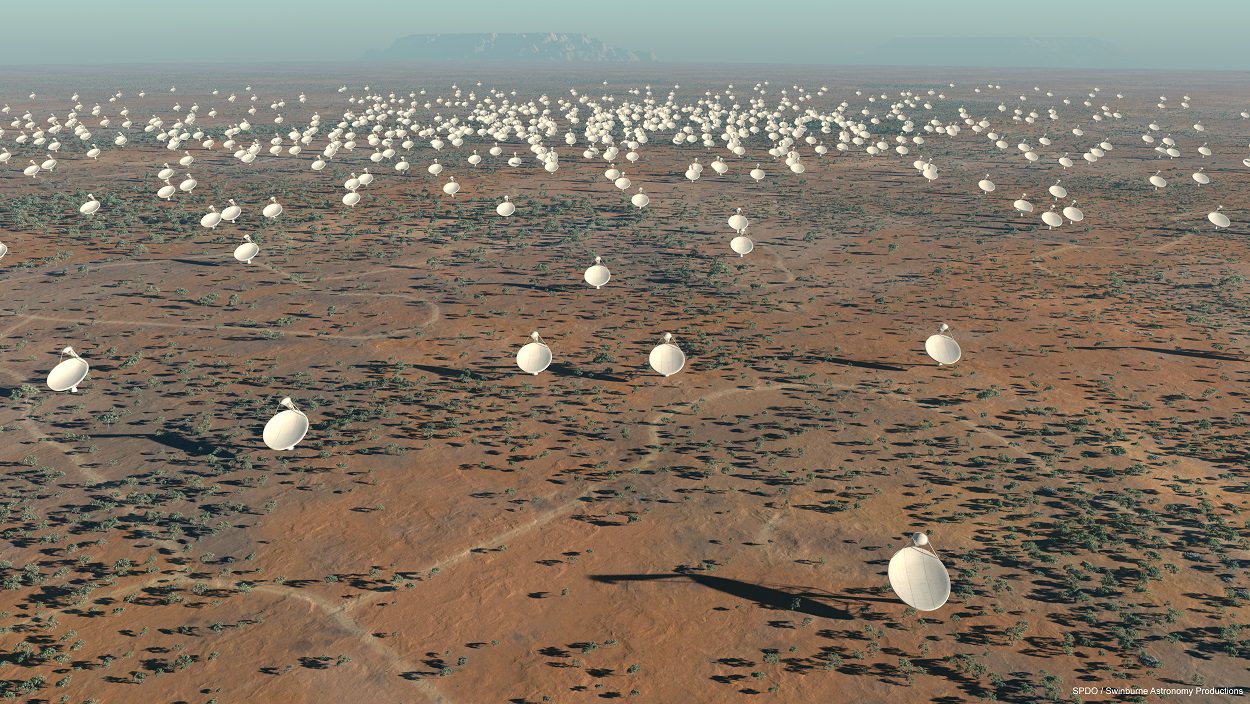
Artist's conception of the Square Kilometer Array. Credit: SKA Organisation

The world’s largest radio telescope will act very much like a jigsaw; every piece of it must be precisely engineered to “fit” and to work with all the other elements. This week, the organizers of the Square Kilometer Array released which teams will be responsible for the individual “work packages” for this massive telescope, which will be in both South Africa and Australia.

“Each element of the SKA is critical to the overall success of the project, and we certainly look forward to seeing the fruits of each consortium’s hard work shape up over the coming years”, stated John Womersley, chair of the SKA board.

“Now this multi-disciplinary team of experts has three full years to come up with the best technological solutions for the final design of the telescope, so we can start tendering for construction of the first phase in 2017 as planned.”

Key science goals for SKA include the evolution of galaxies, the nature of mysterious dark energy, examining the nature of gravity and magnetism, looking at how black holes and stars are created, and even searching for extraterrestrial signals. We’ll illustrate some of those key science concepts while talking about the teams below.

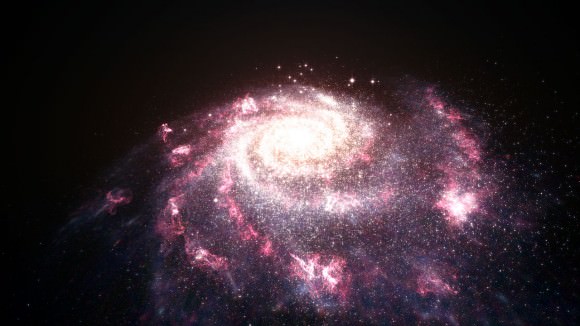
This illustration shows a messy, chaotic galaxy undergoing bursts of star formation. This star formation is intense; it was known that it affects its host galaxy, but this new research shows it has an even greater effect than first thought. The winds created by these star formation processes stream out of the galaxy, ionising gas at distances of up to 650 000 light-years from the galactic centre. Credit: ESA, NASA, L. Calçada

The numbers themselves on the teams are staggering: more than 350 scientists and engineers, representing 18 countries and almost 100 institutions. There are 10 main work packages that these people are responsible for. Here they are, along with SKA’s descriptions of each element:

Dish: “The “Dish” element includes all activities necessary to prepare for the procurement of the SKA dishes, including local monitoring & control of the individual dish in pointing and other functionality, their feeds, necessary electronics and local infrastructure.” (Led by Mark McKinnon of  Australia’s Commonwealth Scientific and Industrial Research Organisation, or CSIRO.)

– Low Frequency Aperture Array: “The set of antennas, on board amplifiers and local processing required for the Aperture Array telescope of the SKA.” (Led by Jan Geralt Bij de Vaate of ASTRON, or the Netherlands Institute for Radio Astronomy).

– Mid Frequency Aperture Array: “Includes the activities necessary for the development of a set of antennas, on board amplifiers and local processing required for the Aperture Array telescope of the SKA.” (Led by de Vaate.)

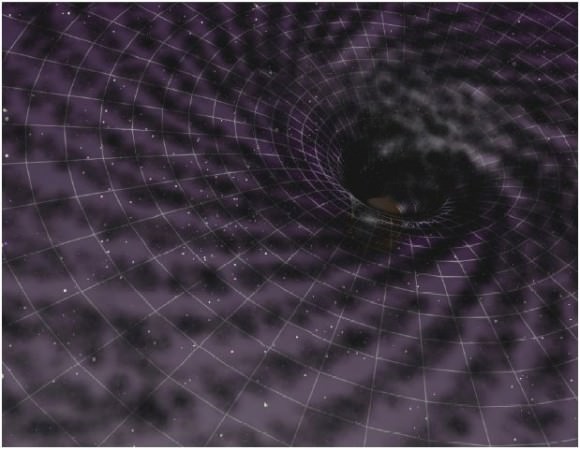
Artist’s schematic impression of the distortion of spacetime by a supermassive black hole at the centre of a galaxy. The black hole will swallow dark matter at a rate which depends on its mass and on the amount of dark matter around it. Image: Felipe Esquivel Reed.

– Telescope Manager: “Will be responsible for the monitoring of the entire telescope, the engineering and operational status of its component parts.” (Led by Yashwant Gupta of the NCRA or National Centre for Radio Astrophysics in India.)

– Science Data Processor: “Will focus on the design of the computing hardware platforms, software, and algorithms needed to process science data from the correlator or non-imaging processor into science data products.” (Led by Paul Alexander of the University of Cambridge, United Kingdom.)

– Central Signal Processor: “It converts digitised astronomical signals detected by SKA receivers (antennas & dipole (“rabbit-ear”) arrays) into the vital information needed by the Science Data Processor to make detailed images of deep space astronomical phenomena that the SKA is observing.” (David Loop of the NRC, National Research Council of Canada.)

The supernova that produced the Crab Nebula was detected by naked-eye observers around the world in 1054 A.D. This composite image uses data from NASA’s Great Observatories, Chandra, Hubble, and Spitzer, to show that a superdense neutron star is energizing the expanding Nebula by spewing out magnetic fields and a blizzard of extremely high-energy particles. The Chandra X-ray image is shown in light blue, the Hubble Space Telescope optical images are in green and dark blue, and the Spitzer Space Telescope’s infrared image is in red. The size of the X-ray image is smaller than the others because ultrahigh-energy X-ray emitting electrons radiate away their energy more quickly than the lower-energy electrons emitting optical and infrared light. The neutron star is the bright white dot in the center of the image.

 Signal and Data Transport: “The Signal and Data Transport (SADT) consortium is responsible for the design of three data transport networks.” (Led by Richard Schilizzi of the University of Manchester, United Kingdom.)

– Assembly, Integration & Verification: “Includes the planning for all activities at the remote sites that are necessary to incorporate the elements of the SKA into existing infrastructures, whether these be precursors or new components of the SKA.” (Led by Richard Lord of SKA South Africa.)

– Infrastructure: “Requires two consortia, each managing their respective local sites in Australia and Africa … This includes all work undertaken to deploy and be able to operate the SKA in both countries such as roads, buildings, power generation and distribution, reticulation, vehicles, cranes and specialist equipment needed for maintenance which are not included in the supply of the other elements.” (Led by Michelle Storey of CSIRO.)

Wideband Single Pixel Feeds: “Includes the activities necessary to develop a broadband spectrum single pixel feed for the SKA.” (Led by John Conway of Chalmers University, Sweden.)

Chandra Infographic Shows Where The Color Comes From In Space Pictures

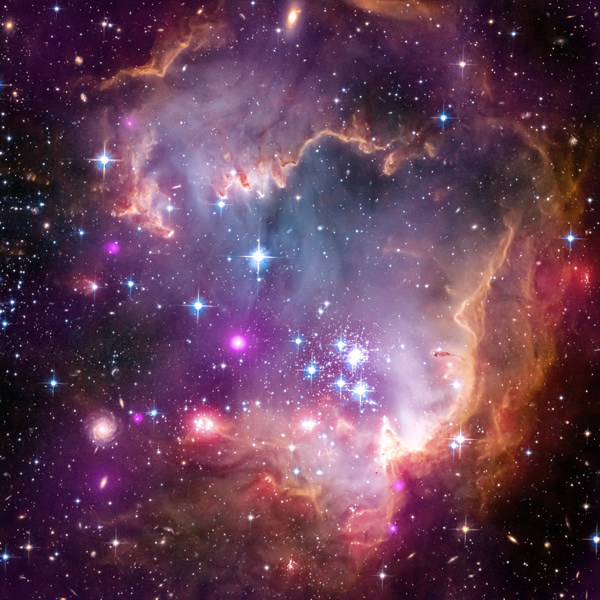
A part of the Small Magellanic Cloud galaxy is dazzling in this new view from NASA's Great Observatories. The Small Magellanic Cloud, or SMC, is a small galaxy about 200,000 light-years way that orbits our own Milky Way spiral galaxy. Credit: NASA.

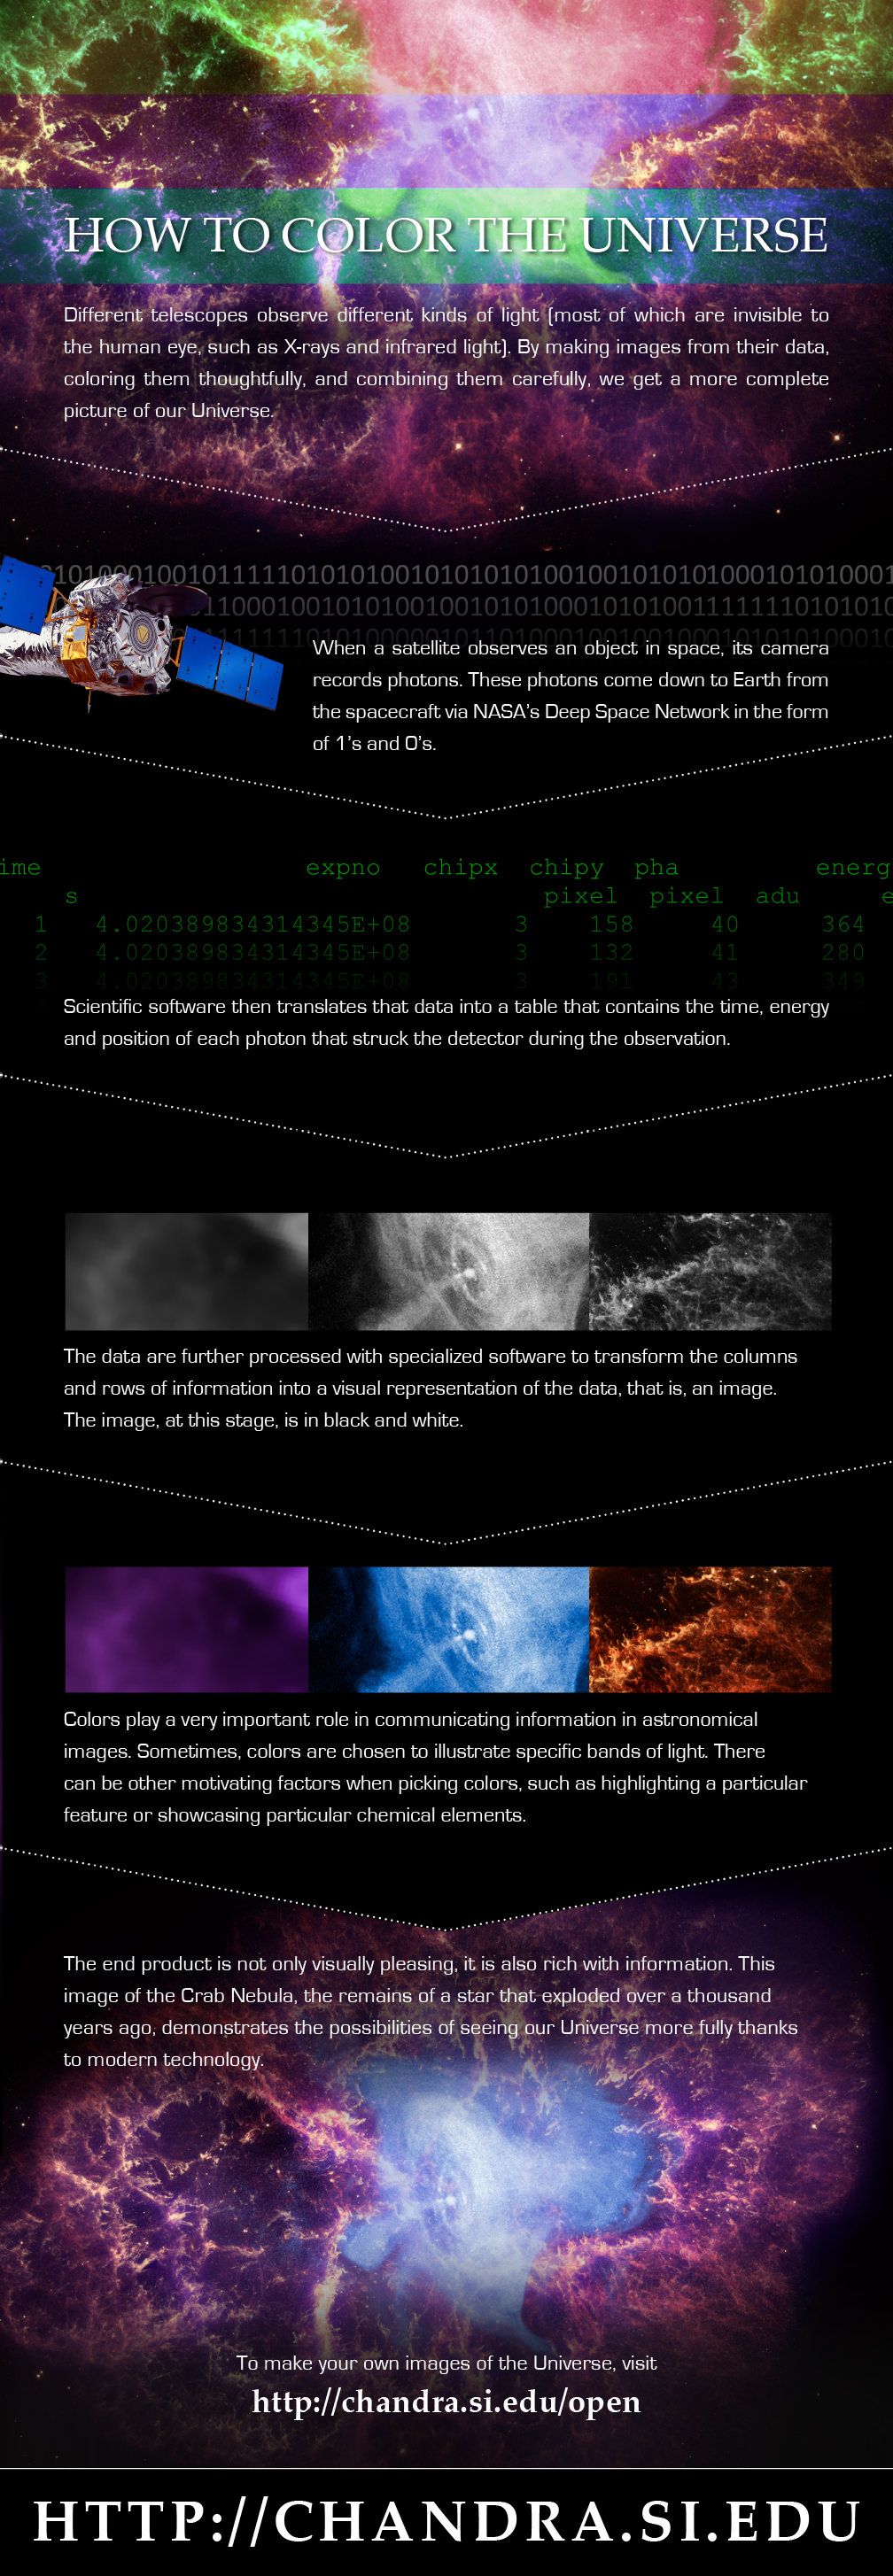
For your daily space zing, check out an infographic recently highlighted on the Chandra X-ray Observatory’s Google+ page. Called “How to Color the Universe” (see it below), it explains why the colors we see from space telescope pictures are added in after the data is gathered.

In a nutshell, the information is recorded by the telescope in photons, which is sent down to Earth in binary code (1s and 0s). Software renders these numbers into images, then astronomers pick the colors to highlight what to show in the data.

“Colors play a very important role in communication information in astronomical images,” the infographic states. “Sometimes, colors are chosen to illustrate specific bands of light. There can be other motivating factors when picking colors, such as highlighting a particular feature or showcasing particular chemical elements.”

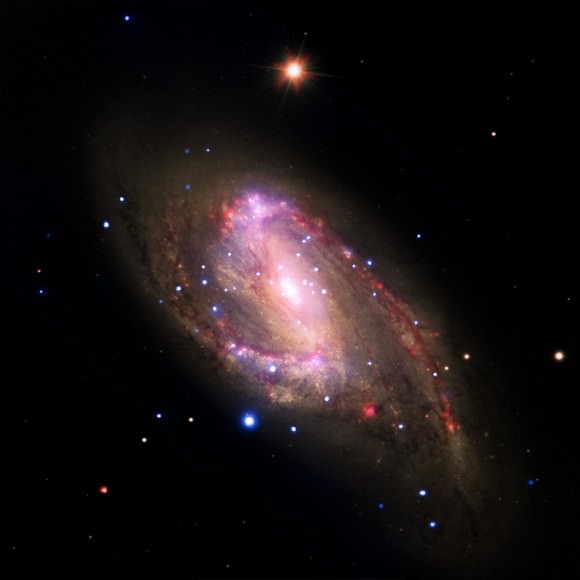
This multiwavelength image of the galaxy NGC 3627 contains X-rays from Chandra (blue), infrared data from Spitzer (red), and optical data from Hubble and the Very Large Telescope (yellow).  Astronomers conducted a survey of 62 galaxies, which included NGC 3627, to study the supermassive black holes at their centers.  Among this sample, 37 galaxies with X-ray sources are supermassive black hole candidates, and seven were not previously known. Confirming previous Chandra results, this study finds the fraction of galaxies hosting supermassive black holes is much higher than in optical searches for black holes that are relatively inactive.
This multiwavelength image of the galaxy NGC 3627 contains X-rays from Chandra (blue), infrared data from Spitzer (red), and optical data from Hubble and the Very Large Telescope (yellow). Astronomers conducted a survey of 62 galaxies, which included NGC 3627, to study the supermassive black holes at their centers. Among this sample, 37 galaxies with X-ray sources are supermassive black hole candidates, and seven were not previously known. Confirming previous Chandra results, this study finds the fraction of galaxies hosting supermassive black holes is much higher than in optical searches for black holes that are relatively inactive.

It’s natural right now to think that astronomers are adding data where none exist, but Chandra’s public affairs employees (Kim Arcand and Megan Watzke) wrote a Huffington Post piece in September addressing this, too.

“Often, scientists choose colors to represent certain scientific phenomena such as structures that appear in one wavelength and not another. This might be why the planet is pink or the galaxy green. Or they might want to show where different elements like iron or magnesium are found in an object, and they can demonstrate this by assigning the sliver of light for each in different colors,” they wrote.

“In other instances, colors are picked to make an image the most pleasing or beautiful. In some of these instances, cries of the images being faked can erupt. But they are not fake, no matter what colors are used. We can’t see these data without scientific tools and processing. The color in these images enhances the data but does not alter them.”

If you have a high level of comfort manipulating images, Chandra offers a website to create images from raw data yourself, complete with a tutorial showing you how to do it.

color_infograph

A Hybrid Solar Eclipse Seen From Earth… and Space

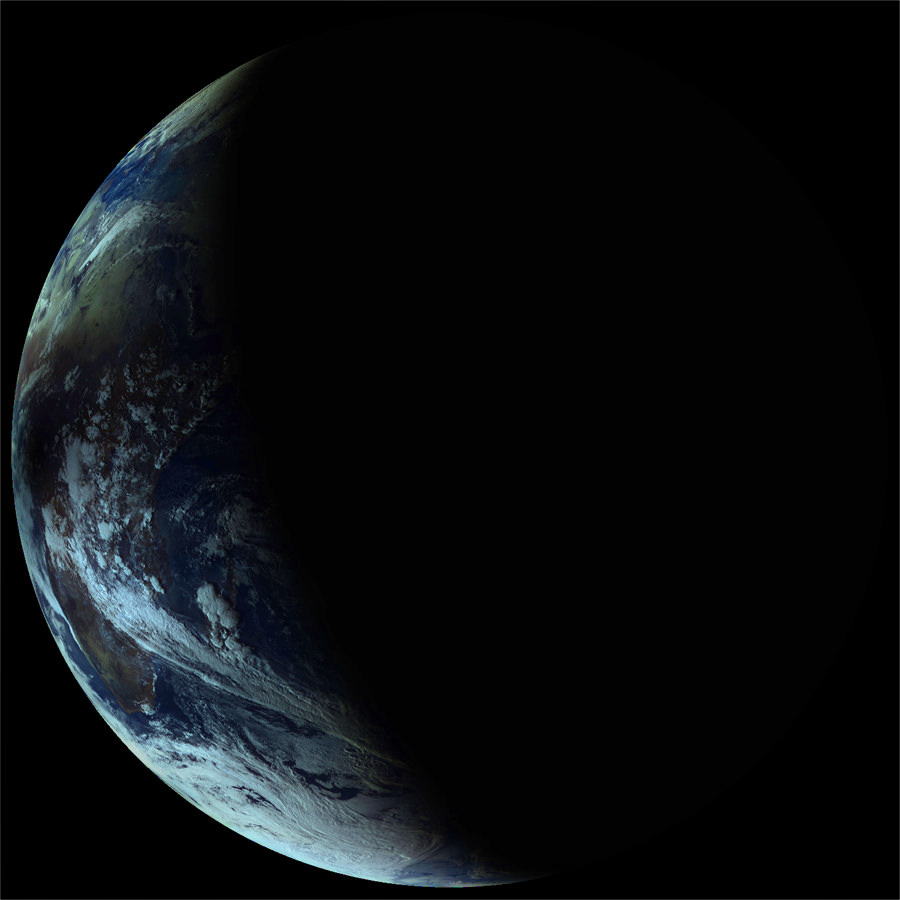
The Elektro-L satellite's view of how the Nov. 3, 2013 solar eclipse effected Earth. Blackness from the eclipse covers Africa. Credit: Elektro-L/Vitaliy EgorovVitaliy Egorov.

The final eclipse for 2013 was a grand event, witnessed across the Atlantic and the heart of Africa this past Sunday. Like so many other photographers along the North American east coast, we were at the ready to greet the partially eclipsed Sun at dawn. And as the shadow of the Moon touched down, teams on land, air and sea were ready to meet with the fleeting umbra as it raced eastward towards sunset over the Horn of Africa region.

But a fleet of spacecraft were also on hand to witness the rare spectacle as well. Turned earthward and sunward, these spacecraft documented not only the passage of the Moon’s shadow over the Earth, but recorded multiple partial solar eclipses from orbit as well.

The first view comes from the Roscosmos Electro-L satellite based in a geostationary orbit over the Indian Ocean:

Electro-L had captured such a view before, during the annular eclipse over Australia earlier this year in May. Roscosmos increased the frame capture rate of Electro-L to twice its usual speed for the sequence. As you watch the Earth pass from a waning gibbous to crescent phase, you can just see the umbra, or central shadow of the Moon, slide into view and come into contact with the sunset terminator over eastern Africa. You can also see the cloud cover that marks the dust storms that plagued eclipse-chasers based around the Lake Turkana region in Kenya.

One of the first public pictures of the umbra of the Moon as seen from space was taken from the Mir space station during a total solar eclipse in 1999. To our knowledge, such a feat has yet to be duplicated aboard the International Space Station. The phase angle of the ISS’s orbit during the eclipse was nearly perpendicular to the Sun-Moon-Earth syzygy, and unfavorable for this particular eclipse.

Thanks to the Russian journalist Vitaliy Egorov for bringing the Electro-L eclipse sequence to the attention of Universe Today!

Next up is a sequence of images from NASA’s Aqua satellite:

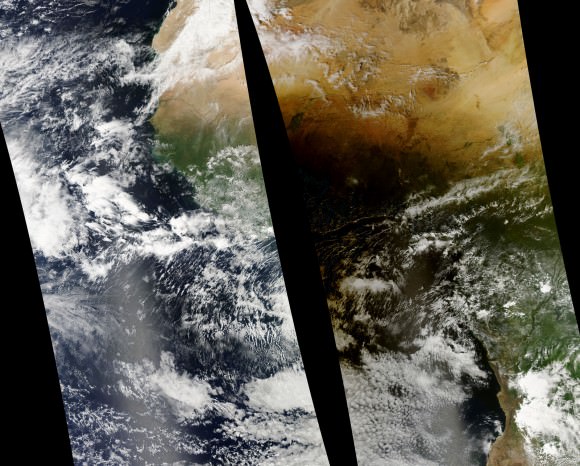
Sunday's eclipse and the Moon's umbra as seen from the Aqua satellite. (Credit: NASA/GSFC/Jeff Schmaltz/MODIS Land Rapid Response Team).
Sunday’s eclipse and the Moon’s umbra off of the west coast of Africa as seen from the Aqua satellite. (Credit: NASA/GSFC/Jeff Schmaltz/MODIS Land Rapid Response Team).

Launched in 2002, Aqua is part of the “A-train” (as in “Afternoon”) constellation of Earth-observing satellites. Perched in a low-Earth Sun-synchronous orbit, Aqua caught sight of the umbra of the Moon at around 14:45 UT on Sunday, November 3rd as it raced to make first landfall over the nation of Gabon and awaiting eclipse chasers.

Some Sun observing spacecraft caught sight of the eclipse as well. The European Space Agency’s Proba-2 nabbed three partial solar eclipses from its vantage point in low Earth orbit:

PROBA-2 used its SWAP imager to grab the sequences. Orbiting the Earth once every 99 minutes or 14.5 time a day, these “orbital eclipses” are quick, lasting about 10 minutes each in duration.

Finally, EUMETSAT’s MeteoSat-10 meteorological satellite based in a geostationary orbit over Africa captured an outstanding sequence, showing nearly the entire trek of the umbra across the entire path of the eclipse:

The sequence runs from 7:30 to 18:30 UT on November 3rd. Note how the video shows the shadow fade in and sharpen as the eclipse touches down off of the US East Coast and intensifies from an annular to total along the first 15 seconds of its track, only to speed up and flatten towards sunset over Africa. And all in six seconds!

And back here on Earth, we couldn’t resist stitching together the bounty from our own minor eclipse expedition for a stop-motion view of the partially eclipsed Sun rising over the Vehicle Assembly Building at the Kennedy Space Center in Florida:

We’d like to also mention a photo that isn’t a “solar eclipse seen from space…” Y’know the one, which shows the Earth, the Moon’s shadow, and a totally-eclipsed Sun, against a star dappled Milky Way. We won’t dignify it with a link. This has already been debunked by Bad Astronomer himself Phil Plait, but the bogus pic now seems to make its rounds across ye’ ole Web now during every eclipse. Seriously? Do we all crave “link juice” that bad? There are lots of real awesome eclipse photos out there, from Earth & beyond! Please, do your part to tell that well meaning friend/coworker/relative/stranger on Twitter that this “ultimate eclipse photo…” isn’t.

How rare are hybrid solar eclipses? Well, the next solar eclipse that is both annular and total along its track occurs over southeast Asia on April 20th, 2023. It’s interesting to note that this past weekend’s eclipse may have been the first sunrise solar eclipse over the VAB since it was built in 1966. Eclipses in the same 18 years and 11 days- long saros cycle repeat, but move about 120 degrees westward. Thus, follow an eclipse cycle through a “triple saros”— known as an “Exeligmos,” an ultimate scrabble word if you can land it on a triple word score! —and an eclipse’s geometry will roughly line back up over a 54 year 33 day long span. Saros 143 produced a an eclipse crossing a similar path on October 2nd, 1959 (before the VAB was built!) and will repeat its Atlantic sunrise performance on December 6th, 2067! Let’s see, by then I’ll be…

What is the Milky Way?

Artist's conception of the Milky Way galaxy. Credit: Nick Risinger

When you look up at the night sky, assuming conditions are just right, you might just catch a glimpse of a faint, white band reaching across the heavens. This band, upon closer observation, looks speckled and dusty, filled with a million tiny points of light and halos of glowing matter. What you are seeing is the Milky Way, something that astronomers and stargazers alike have been staring up at since the beginning of time.

But just what is the Milky Way? Well, simply put, it is the name of the barred spiral galaxy in which our solar system is located. The Earth orbits the Sun in the Solar System, and the Solar System is embedded within this vast galaxy of stars. It is just one of hundreds of billions of galaxies in the Universe, and ours is called the Milky Way because the disk of the galaxy appears to be spanning the night sky like a hazy band of glowing white light. Continue reading “What is the Milky Way?”

10-Year-Old Boy Discovers a 600 Million Year-Old Supernova

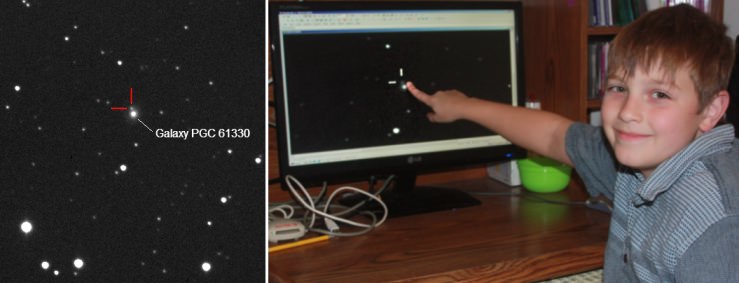
Canadian Nathan Gray (right) is likely the youngest person to discover a supernova. The supernova candidate (left) is probably located some 600 million light-years away (image from the ARO--Dave Lane). Follow-up observations will soon be acquired to confirm the supernova's class and nature.

Young Canadian Nathan Gray, age 10, has discovered a supernova candidate in the field of the galaxy designated PGC 61330, which lies in the constellation of Draco (the dragon).

Nathan made the discovery while scanning astronomical images taken by Dave Lane, who runs the Abbey Ridge Observatory (ARO) which is stationed in Nova Scotia.  Incidentally, Nathan may unseat his older sister, Kathryn Aurora Gray, as the youngest supernova discoverer by a mere 33 days.

Nothing is visible at the location of the supernova candidate in prior images of the field taken over the past two years, or Digitized Palomar Sky Survey images.

Kathryn Aurora Gray garnered worldwide fame when she discovered a supernova in the galaxy designated UGC 3378 (see the Universe Today article by Nancy Atkinson). The discovery eventually earned her an audience with astronauts such as Neil Armstrong (shown below).

Kathryn Aurora Gray discovery of a supernova earned her the chance to meet Neil Armstrong, Bill Anders (Apollo 8), Victor Gorbakto, and Jim Lovell (Apollo 8 & 13).
Kathryn Aurora Gray’s discovery of a supernova earned her the chance to meet Neil Armstrong, Bill Anders (Apollo 8), Victor Gorbakto, and Jim Lovell (Apollo 8 & 13) (image credit: P. Gray/RASC).

Caroline Moore held the record prior to Kathryn as the youngest person to discover a supernova (Caroline was 14 at the time). Caroline subsequently had the honor of meeting President Obama at the White House (see the video below).

Supernova are immense explosions linked to the evolutionary end-state of certain stars. The explosions are so energetic that they can be observed in distant galaxies. Indeed, Nathan’s supernova could be some 600 million light years distant.  Gazing into space affords humanity the opportunity to peer back in time. Despite the (finite) speed of light being a remarkable 300000 km/s, the light-rays must travel over “astronomical” distances.

There are several different classes of supernovae. For example, Type II supernovae are associated with larger mass stars. The Sun will not terminate as a supernova, but may potentially evolve into a standard (or not) planetary nebula (see the Universe Today post “Astronomers Hint that our Sun won’t Terminate as the Typical Planetary Nebula”).

Nathan’s discovery has been posted on the International Astronomical Union’s site, and its presence confirmed by US and Italian-based observers. Its provisional name is: PSN J18032459+7013306, and to get an official supernova designation a large telescope needs to confirm the unique supernova light signature (via a spectrum).  Is the target a bona fide supernova?

“Given no motion, large distance from the galactic plane (ie. not likely a nova), and several optical confirmations, as well as its very close angular proximity to a faint galaxy, it is a supernova at any reasonable certainty,” said Lane, an astronomer in the Dept. of Astronomy & Physics at Saint Mary’s University, as well as the director of the Burke-Gaffney and Abbey Ridge astronomical observatories. “A significant fraction of
the supernova discoveries these days are not observed spectrographically due to the sheer number of them vs. telescope time.”

Nathan Gray is the son of Paul and Susan Gray.

*2013 10 31.9053 – update from the IAU: SN to be confirmed in PGC 61330 detected with 3 x 3 min images (exp 9 min). Astrometry: RA 18 03 24.12 Dec +70 13 26.4 (ref stars UCAC2) Photometry: 17.00CR +/-0.02 (USNO A2R Ref stars 163R, 170R, 172R, 173R). Measure on unfiltered image. Observer and measurer: Xavier Bros, ANYSLLUM OBSERVATORY, Ager, Spain. T-350mm f4.6. Link to image and further information: http://www.anysllum.com/PSN_PGC61330.jpg

Watch Live: Sunday’s “Hybrid Solar Eclipse”

Totality! As seen during the November 13th, 2012 total solar eclipse. (Image credit: Narayan Mukkavilli, used with permission).

The chase is on. On Sunday, November 3rd, the shadow of the Moon will cross the Earth for one last time in 2013. We recently wrote about the prospects for viewing this “hybrid” annular-total solar eclipse as it crosses the Atlantic and central Africa. Viewers from northern South America across the U.S. Eastern Seaboard up into the Canadian Maritimes will also be treated to a brilliant rising partial eclipse over the Atlantic at sunrise. Tickets are already in hand for many, as umbraphiles wing their way (cue Indiana Jones music) to dusty and exotic far off locales to stand briefly in the shadow of our Moon…

But what if it’s cloudy?

Once the bane of eclipse-chasers, you can now thwart our sometimes murky atmosphere by catching the solar eclipse online.

I remember our first experience with eclipse-chasing on the internet, trying to catch an eclipse broadcast on ye ole dial up modem from an internet café (remember internet cafes?) way back in the late 90s. This was pre-You Tube, pre-UStream. Needless to say, the tenuous connection afforded nary a frozen glimpse of the partially eclipsed Sun, and crashed all together at the onset of totality.

Fast forward to 2013, when ginormous data packets routinely fly around the globe.

True, this eclipse presents a challenge, as it crosses some pretty wild and unconnected terrain. But one standby that we can expect is the good people at Slooh, who have dispatched a broadcast team to the African nations of Gabon and Kenya:

As of this writing, Slooh looks to be going live at around 11:45 UT on Sunday November 3rd. This is 6:45 AM EST, which takes into account our “falling back” one hour to UT -5 hours on Sunday morning. Astronomer Brian Cox will be broadcasting live from Kenya, and the broadcast starts just over two hours prior to the first landfall of totality at just before 14:00 UT. From Gabon, Maximum totality will be a brief 1 minute and 5 seconds, and will dwindle to an even briefer 14 seconds over Lake Turkana in Kenya before ending as a brilliant sunset eclipse over Somalia and Ethiopia. A backup broadcast of the partial phases of the eclipse is also planned from Slooh’s home base site in the Canary Islands.

Another fascinating potential broadcast may come our way from the BRCK organization basing their observations of the eclipse from the shores of Lake Turkana in Kenya.  Billed as “Your Backup Generator for the Internet,” BRCK’s mission is to bring broadband access internet to people in remote regions of the world. This weekend’s eclipse certainly qualifies. As of writing this on Halloween, October 31st, the BRCK team had gone into the field to “stress test” their webcasting capability onsite; follow them on Twitter as @brcknet for the latest updates. As of yet, there’s no embed for the broadcast, though we’ll be sure to drop it in if it surfaces!

There’s also some interesting science afoot during this eclipse as well. A recent press release out from Williams College notes that Field Memorial Professor of Astronomy and chair of the International Astronomical Union’s Working Group on Eclipses Jay Pasachoff will observe the eclipse, along with a student and tourist expedition from Gabon. A veteran eclipse chaser, Pasachoff will be working in concert with Dr. Vojtech Rusin of the Astronomical Institute of Slovakia, solar researchers Aris Voulgaris and Robert Lucas and William College students to study the ethereal solar corona.  Satellite-based coronagraphs, such as the one employed by SOHO, can create an “artificial eclipse” of the Sun to study the corona, but also face the challenge of scattered light via a phenomenon known as Fresnel-diffraction. Pasachoff and team hope to combine their observations with those being routinely carried out by NASA, the European Space Agency and the Royal Observatory in Belgium to characterize the solar corona and improve our understanding of the space weather environment. Pasachoff’s expedition is being assisted via support from the South African Astronomical Observatory, Nommo Astronomia, the Gabon Astronomy Society and the Gabon Space Agency. Veteran eclipse chaser and historian Michael Zeiler (@EclipseMaps) has also joined up with Pasachoff’s group in Gabon.

In space, the NASA/JAXA joint solar observing Hinode spacecraft and ESA’s Sun watching Proba-2 will also catch several partial eclipses from their respective perches in low Earth orbit. Expect to see these pics in the days following Sunday’s eclipse.

We’ll be dropping in more broadcasts as they come to our attention this weekend here at Universe Today. Planning an ad-hoc webcast of the eclipse? Let us know in the comments below! Even if it’s just a brief view of the rising partially eclipsed Sun from the beach, its worth the effort. Just remember that you’ll need a fairly long focal length (in the range of 200mm or longer) and a proper solar filter for the Sun to appear like anything more than a washed out dot in the broadcast. And always run a test of your rig beforehand!

Good luck, happy eclipse chasing, and don’t forget to send those eclipse pics to Universe Today!


What Are The Odds Of Spotting A Milky Way Supernova From Earth?

Artist illustration of supernova. Credit: NASA

An exploding star in our home galaxy might be visible to Earth in the next 50 years, astronomers say in a new calculation of the odds of a nearby supernova.

This explosion would be too faint to prove a hazard to Earthlings, and in fact it may not even be visible with the naked eye in the starry sky. Its heat signature, however, would be seen in the right kind of camera as long as we could swing a telescope there fast enough.

“For [researchers], this study suggests that they have a solid chance of doing something that’s never been done before: detect a supernova fast enough to witness what happens at the very beginning of a star’s demise,” wrote Ohio State University in a press release about the research, which was led by university astronomer researcher Scott Adams.

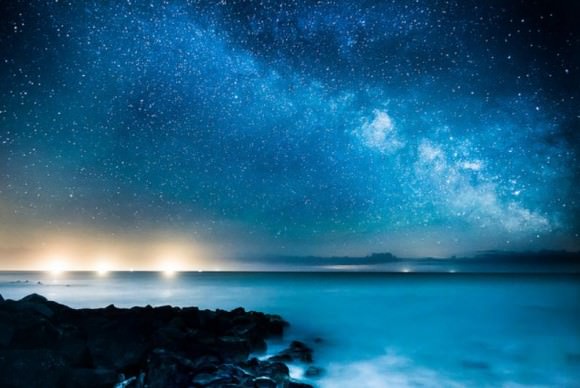
Fishing Boats Meet the Milky Way on the Isle of Wight (south of England) on May 16, 2013. Credit and copyright: Chad Powell.

The challenge with observing a supernova in our own galaxy is the presence of cosmic dust that can sometimes obscure supernovae and other phenomena from our view. However, infrared light is not as badly affected by this and may be able to see something through the obscurity.

To jump on the supernova as it is happening, the scientists propose having a network in place to send out neutrino alerts when these particles, which would arrive at Earth first after an explosion, are detected on Earth. The key is to figure out the difference between neutrinos from space and neutrinos from other sources, such as nuclear reactors, the sun or even spurious glitches.

A University of Tokyo group led the building of a model of a new kind of neutrino detector, a model that is now operating underground in Japan. Called EGADS (Evaluating Gadolinium’s Action on Detector Systems), the water in the system would be “spiked” with a bit of gadolinium, which would reportedly assist with neutrino detections from outside of Earth.

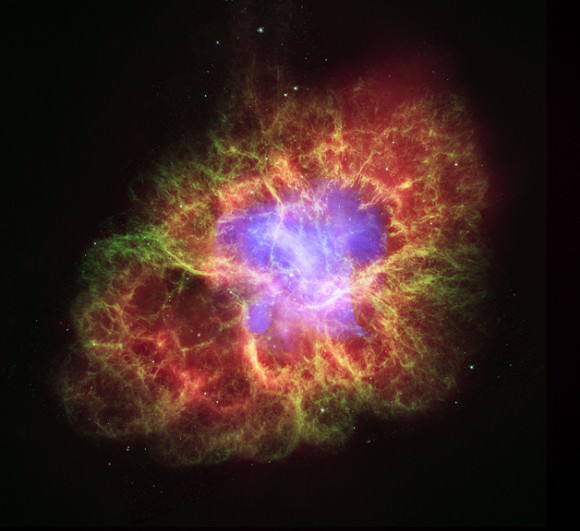
The supernova that produced the Crab Nebula was detected by naked-eye observers around the world in 1054 A.D. This composite image uses data from NASA’s Great Observatories, Chandra, Hubble, and Spitzer, to show that a superdense neutron star is energizing the expanding Nebula by spewing out magnetic fields and a blizzard of extremely high-energy particles. The Chandra X-ray image is shown in light blue, the Hubble Space Telescope optical images are in green and dark blue, and the Spitzer Space Telescope’s infrared image is in red. The size of the X-ray image is smaller than the others because ultrahigh-energy X-ray emitting electrons radiate away their energy more quickly than the lower-energy electrons emitting optical and infrared light. The neutron star is the bright white dot in the center of the image.
The supernova that produced the Crab Nebula was detected by naked-eye observers around the world in 1054 A.D. This composite image uses data from NASA’s Great Observatories, Chandra, Hubble, and Spitzer, to show that a superdense neutron star is energizing the expanding Nebula by spewing out magnetic fields and a blizzard of extremely high-energy particles.

“When a neutrino from a Milky Way supernova enters the tank, it can collide with the water molecules and release energy, along with some neutrons,” Ohio State added. “Gadolinium has a great affinity for neutrons, and will absorb them and then re-emit energy of its own. The result would be one detection signal followed by another a tiny fraction of a second later—a “heartbeat” signal inside the tank for each detected neutrino.”

But what about a naked-eye supernova? The researchers say the probability of that is just 20% to 50% in the next century, with southern hemisphere residents having a better chance since more of the galaxy is visible there. The last instance of this happening, by the way, was in 1604.

The research paper is available now on prepublishing site Arxiv and will soon be published in the Astrophysical Journal.

Source: Ohio State University

Correction: This article has been changed to remove a reference to Ohio State University in the EGADS collaboration.

What Is The Hottest Place on Earth?

What Is The Hottest Place on Earth?

We’ve talked about Venus, the hottest planet in the Solar System, but we know things can get pretty hot here on Earth, too. You may be wondering, where on the surface of the Earth has the highest natural temperature been recorded?

The location of this world record has had some controversy, but as of 2013, the hottest spot on record was the Furnace Creek Ranch in California’s Death Valley. On July 10, 1913, weather instruments measured 56.7 degrees Celsius, or 134 degrees Fahrenheit.
The previous record of 56 degrees at El Azizia, Libya was overturned because a systematic study in 2012 discovered there were errors in the measuring methods.

Similar temperatures to Death Valley’s record have been recorded around the World:
55 degrees in Africa,
53.6 in Asia,
50.7 in Australia,
and 49.1 in Argentina.

But these are just measurements from weather stations. It’s likely there are hotter temperatures, but nobody was around to measure. NASA satellites have spotted regions in Iran’s Lut desert which might have reached 70 degrees Celsius during the summers of 2004 and 2005.

So that’d be the hottest spot on the surface, but what about the hottest natural spot anywhere in the entire planet? Now you’ve got to travel straight down 6,371 kilometers to the very center of the Earth. At the inner core, the temperatures rise to about 5,430 degrees C, or 5700 Kelvin. Amazingly, this is about the same temperature as the surface of the Sun.

Some of this high temperature comes from leftover heat from the formation of the planet, 4.54 billion years ago, but the vast majority comes from the decay of radioactive minerals inside the Earth. It was likely hotter in the past, but all the short-period isotopes have already been depleted.

I keep saying the word “natural”, but what about “unnatural”? Wondering about the hottest temperature EVER generated on Earth? Thermonuclear explosions reach temperatures of tens of millions of Kelvin. Fusion experiments have hit 500 million Kelvin. But that’s nothing.

In 2012, physicists working with the Large Hadron Collider were investigating the conditions that might have existed during the earliest moments of the Big Bang.
They generated a quark gluon plasma that had a temperature of 5.5 trillion Kelvin.
Unless aliens can do better, this is not only the hottest temperature ever recorded on Earth, it’s easily the hottest temperature anywhere in the Universe since the Big Bang itself.