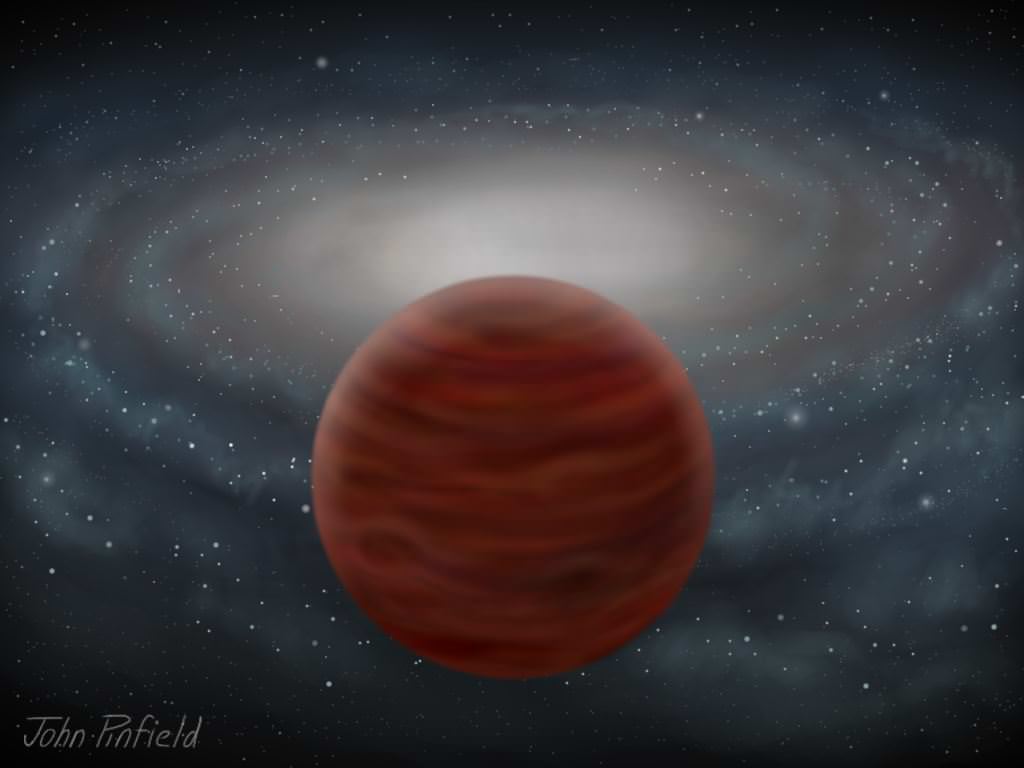
If you want a picture of how you’ll look in 30 years, youngsters are told, look at your parents. The same principle is true of astronomy, where scientists compare similar stars in different age groups to see how they progress.
We have a special interest in learning how the Sun will look in a few billion years because, you know, it’s the main source of energy and life on Earth. Newly discovered HIP 102152 could give us some clues. The star is four billion years older than the sun, but so close in composition that researchers consider it almost like a twin.
Telescopes have only been around for a few centuries, making it hard to project what happens during the billions upon billions of years for a star’s lifetime. We have about 400 years of observations on the sun, for example, which is a minute fraction of its 4.6 billion-year-old lifespan so far.
“It is very hard to study the history and future evolution of our star, but we can do this by hunting for rare stars that are almost exactly like our own, but at different stages of their lives,” stated the European Southern Observatory.
ESO’s Very Large Telescope — guided by a team led by the University of Sao Paulo’s Jorge Melendez — examined HIP 102152 with a spectrograph that broke up the light into various colors, revealing properties such as chemical composition. Around the same time, they scrutinized 18 Scorpii, also considered to be a twin but one that is younger than the sun (2.9 billion years old)
So what can we predict about the Sun’s future? One thing puzzling scientists has been the amount of lithium in our closest stellar companion. Although the Big Bang (the beginning of the universe) created hydrogen, helium and lithium, only the first two elements are abundant in the Sun.
HIP 102152, it turns out, also has low levels of lithium. Why isn’t clear yet, ESO notes, although “several processes have been proposed to transport lithium from the surface of a star into its deeper layers, where it is then destroyed.” Previous observations of young Sun-like stars also show higher levels of lithium, implying something changes between youth and middle age.
The elder twin to our Sun may host another discovery: there could be Earth-sized planets circling the star. Chemical properties of HIP 102152 show that it has few elements that you see in meteorites and rocky planets, implying the elements are “locked up” in bodies close to the star. “This is a strong hint that HIP 102152 may host terrestrial rocky planets,” ESO stated.
Better yet, separate observations showed that there are no giant planets close to the star — leaving room for Earth-sized planets to flourish.
Determining weather patterns in exoplanet atmospheres – hundreds to thousands of light years away – is extremely difficult. However, given that it may be one of our best ways to truly characterize these alien words, it’s a challenge astronomers have accepted willingly.
Most models have a very simple foundation, necessarily eliminating the complex physics that is difficult to incorporate and analyze. Recently, a team led by Dr. Konstantin Batygin of Harvard University, added one more parameter to their models, drastically changing their results.
The punch line is this: the inclusion of magnetic fields significantly changes, and actually simplifies, the atmospheric circulation of hot Jupiters.
Hot Jupiters orbit dangerously close to their host stars, roasting in stellar radiation. But they are also tidally locked to their host stars – one hemisphere continually faces the star, while one continuously faces away – creating a permanent dayside and a permanent nightside.
One would expect the temperature gradient between the dayside and the nightside to be very high. However, various weather patterns play a role in strongly decreasing this temperature gradient. As an example, we now know that clouds may significantly decrease the temperature of the dayside.
Dr. Batygin’s team analyzed magnetic effects within atmospheric circulation. “The case of hot Jupiters is quite peculiar,” she told Universe Today. “The atmospheres of hot Jupiters have temperatures that reach up to 2000 Kelvin, which is hot enough to ionize trace Alkali metals such as potassium and sodium. So the air on hot Jupiters is actually a weakly conducting plasma.”
Once the alkali metals have been ionized – stripped of their electrons – the upper atmosphere contains all of those charged particles and becomes a plasma. It is then electrically conductive and magnetic effects must be taken into account.
While the underlying physics is pretty complex (with nearly 40 multi-lined equations in the paper alone), the introduction of magnetic effects actually simplified the model’s outcome.
In the absence of magnetic fields, the upper and lower atmospheres feature two distinct patterns of circulation. The upper atmosphere consists of winds blowing away from the dayside in all directions. And the lower atmosphere consists of zonal flows – the bands of color on Jupiter. The zonal flows move parallel to lines of latitude in an east-west fashion. Each moves in a different direction than the one above and below it.
“Upon introducing magnetic fields, fancy dayside-to-nightside flows are quenched and the entire atmosphere circulates in an exclusively east-west fashion,” explains Dr. Batygin. The upper atmosphere resembles the lower atmosphere – zonal flows dominate.
Throughout these models, Dr. Batygin et al. assumed a magnetic field aligned with the rotation axis of the planet. Future work will include a closer look at the effect of a more complicated geometry. The team also intends to extend these results to hotter atmospheres, where magnetic fields will slow the rate of these zonal flows. According to Dr. Batygin, “this has potentially observable consequences and we hope to elucidate them in the future.”
These results will be published in the astrophysical journal (preprint available here).
It’s hard to believe that it’s been with us for a decade now.
Ten years ago this week, the planet Mars reached made an exceptionally close pass of the planet Earth. This occurred on August 27th, 2003, when Mars was only 56 million kilometres from our fair planet and shined at magnitude -2.9.
Such an event is known as opposition. This occurs when a planet with an orbit exterior to our own reaches a point opposite to the Sun in the sky, and rises as the Sun sets. In the case of Mars, this occurs about every 2.13 years.
But another myth arose in 2003, one that now makes its return every August, whether Mars does or not.You’ve no doubt gotten the chain mail from a well-meaning friend/relative/coworker back in the bygone days a decade ago, back before the advent social media when spam was still sorta hip. “Mars to appear as large as the Full Moon!!!” it breathlessly exclaimed. “A once in a lifetime event!!!”
Though a little over the top, the original version did at least explain (towards the end) that Mars would indeed look glorious on the night of August 27th, 2003 … through a telescope.
But never let facts get in the way of a good internet rumor. Though Mars didn’t reach opposition again until November 7th 2005, the “Mars Hoax” email soon began to make its rounds every August.
Co-workers and friends continued to hit send. Spam folder filled up. Science news bloggers debunked, and later recycled posts on the silliness of it all.
Now, a decade later, the Mars Hoax seems to have successfully made the transition over to social media and found new life on Facebook.
No one knows where the Mars Hoax meme goes to weather the lean months, only to return complete with all caps and even more exclamation points each and every August. Is it the just a product of the never ending quest for the almighty SEO? Are we now destined to recycle and relive astronomical events in cyber-land annually, even if they’re imaginary?
Perhaps, if anything there’s a social psychology study somewhere in there, begging the question of why such a meme as the Mars Hoax endures… Will it attain a mythos akin to the many variations of a “Blue Moon,” decades from now, with historians debating where the cultural thread came from?
Here are the facts:
-Mars reaches opposition about every 2.13 Earth years.
-Due to its eccentric orbit, Mars can vary from about 56 million to over 101 million kilometres from the Earth during oppositions.
-Therefore, Mars can appear visually from 13.8” to 25.1” arc seconds in size.
-But that’s still tiny, as the Moon appears about 30’ across as seen from the Earth. You could ring the local horizon with about 720 Full Moons end-to-end, and place 71 “maxed out Mars’s” with room to spare across each one of them!
-And although the Full Moon looks huge, you can cover it up with a dime held at arm’s length…. Try it sometime, and amaze your email sending/Facebook sharing friends!
–Important: Mars NEVER gets large enough to look like anything other than a star-like point to the naked eye.
-And finally, and this is the point that should be getting placed in all caps on Facebook, to the tune of thousands of likes… MARS ISN’T EVEN ANYWHERE NEAR OPPOSITION in August 2013!!! Mars is currently low in the dawn sky in the constellation Cancer on the other side of the Sun. Mars won’t be reaching opposition until April 8th, 2014, when it will reach magnitude -1.4 and an apparent size of 15.2” across.
Still, like zombies from the grave, this myth just won’t die. In the public’s eye, Mars now shines “As big as” (or bigger, depending on the bad hyperbole used) as Full Moon now every August. Friends and relatives hit send, (or these days, “share” or “retweet”) observatories and planetariums get queries, astronomers shake their heads, and science bloggers dust off their debunking posts for another round. Hey, at least it’s not 2012, and we don’t have to keep remembering how many “baktuns are in a piktun…”
What’s a well meaning purveyor & promoter science to do?
Feed those hungry brains a dose of reality.
There are real things, fascinating things about Mars afoot. We’re exploring the Red Planet via Mars Curiosity, an SUV-sized, nuclear powered rover equipped with a laser. The opposition coming up next year means that the once every 2+ year launch window to journey to Mars is soon opening. This time around, the Mars Atmosphere and Volatile EvolutioN (MAVEN) mission and, just perhaps, India’s pioneering Mars Orbiter Mission may make the trip. Launching from Cape Canaveral on November 18th, MAVEN seeks to answer the questions of what the climate and characteristics of Mars were like in the past by probing its tenuous modern day atmosphere.
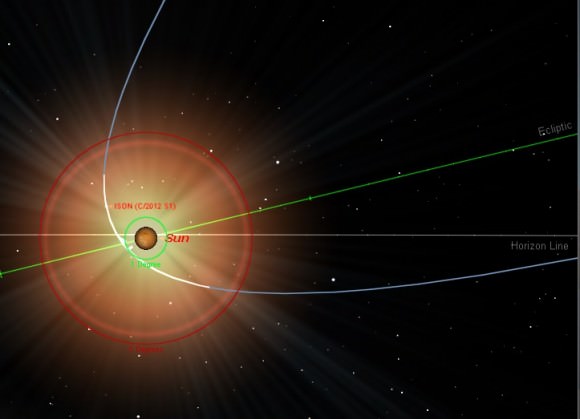
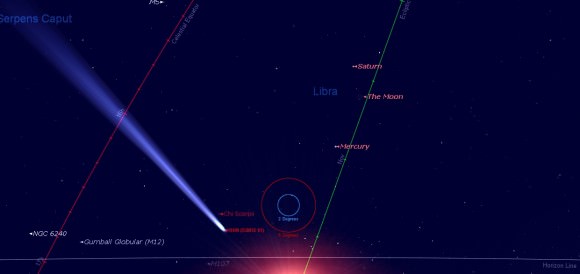
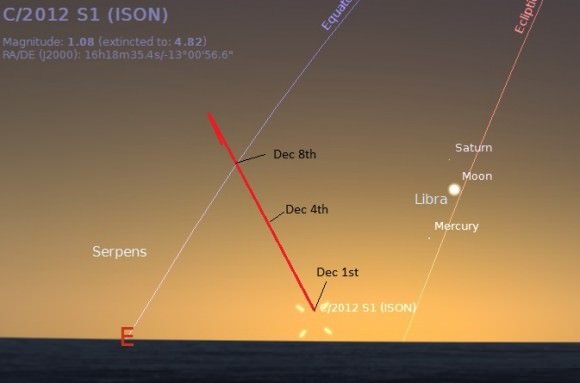
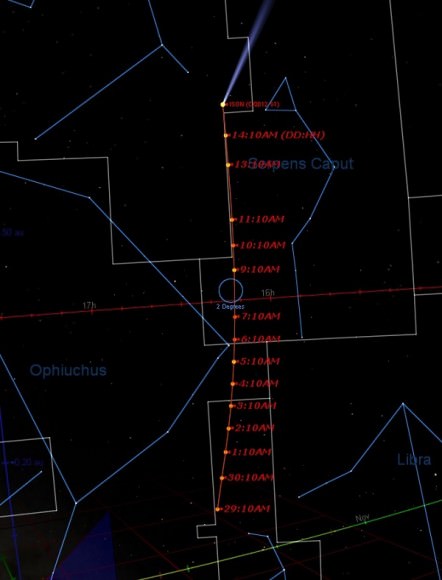
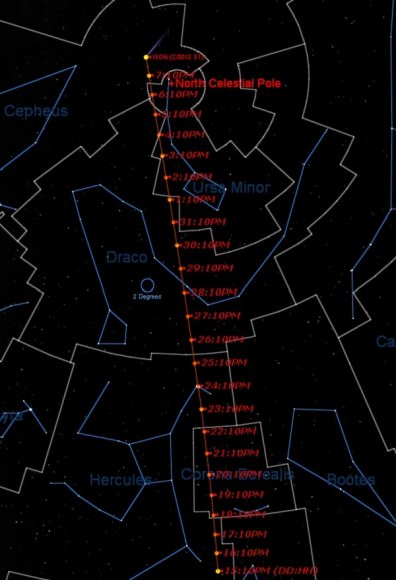
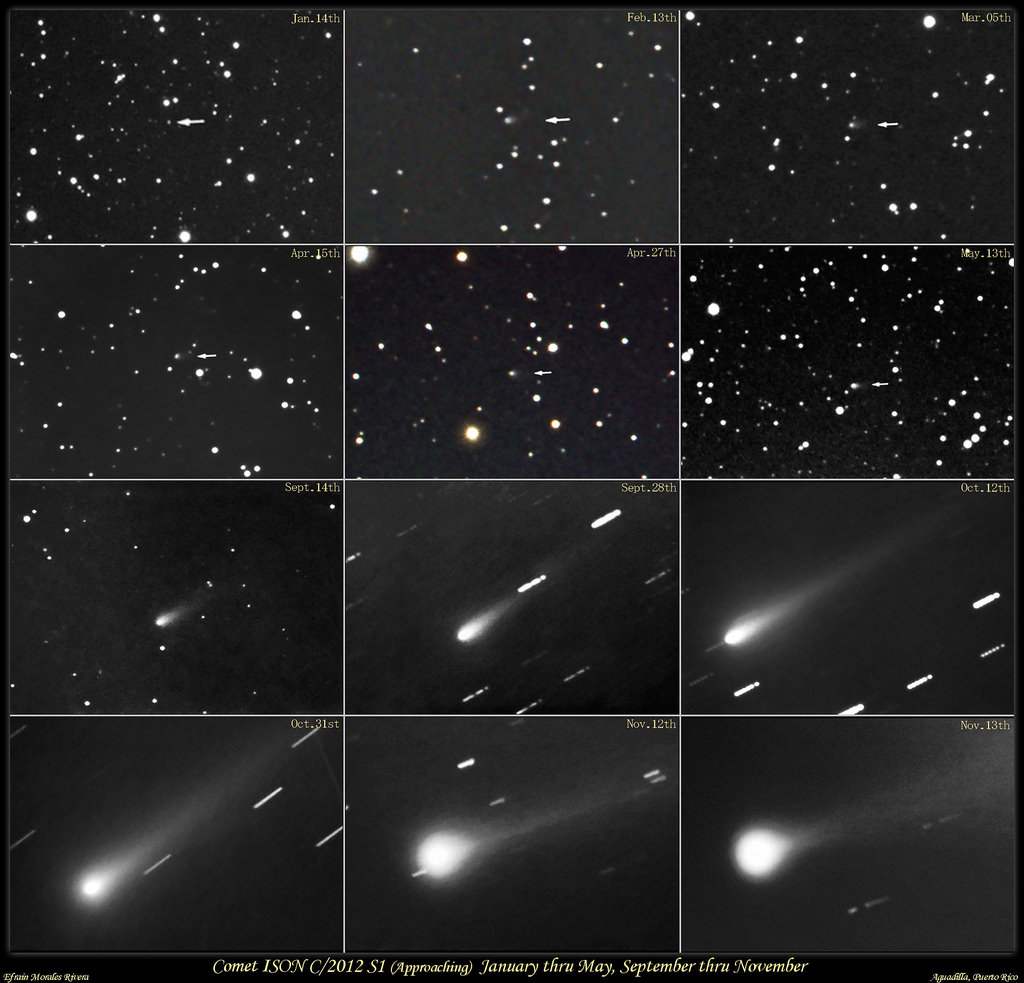
And as opposition approaches in 2014, Mars will again present a fine target for small telescopes. As a matter of fact, Mars will pass two intriguing celestial objects next month, passing in front of the Beehive cluster and — perhaps — a brightening Comet ISON. More to come on that later this week!
And it’s worth noting that after a series of bad oppositions in 2010 and 2012, oppositions in 2014 and 2016 are trending towards more favorable. In fact, the Mars opposition of July 27th, 2018 will be nearly as good as the 2003 approach, with Mars appearing 24.1” across. Not nearly as “large as a Full Moon” by a long shot, but hey, a great star party target.
Will the Mars Hoax email enjoy a resurgence on Facebook, Twitter or whatever is in vogue then? Stay tuned!
Permanently shadowed craters on the moon or Mercury are one of the most exciting locations to search for water. Because the walls of these craters protect certain spots inside from the rays of the sun, it’s quite possible for ice to lurk inside of there.
We’ve found ice on so-called airless worlds because of this trick of geometry. So how about exploring them? What’s the best way to do so?
The NASA Innovative Advanced Concepts office suggests using TransFormers to get inside these places. No, not the awesome robots you see in the movies, but still something that has a certain degree of complication: “multifunctional platforms that can change their shape and function”, according to the agency.
Like the iconic science fiction heroes, however, the TransFormers would be able to unfold and change their shape. These machines could relay information between a rover and an orbiting satellite, or reflect solar energy on to a target (say, a solar-powered rover).
The challenge with putting a rover in a permanently shadowed crater is figuring out how to power it. Nuclear power sources have special handling considerations during preparation and launch that must be taken into account for safety reasons. Solar power, however, would not be possible in these craters given there is no sunlight.
Putting a TransFormer at the crater’s edge, however, could make the environment a friendly one for a rover powered by the sun. It could reflect light inside and provide a power source for the rover to keep moving.
And once that rover starts running around, it would have immense scientific benefits, NASA stated.
“For example, water found in the permanently shadowed areas of craters on the Moon or Mercury can reveal clues about planetary formation and history, and could be used as a resource for astronauts,” the agency wrote.
This could even be extended to the Red Planet, which offers the enticing possibility of stumbling across life.
“Cave exploration on Mars offers the possibility of finding extraterrestrial life; furthermore, caves are time capsules preserving geochemical traces and may safely shelter future human explorers.”
As an amateur astronomer, two of the most frequently questions I’m asked are “When is the best time to see the aurora borealis and where is the best place?” In terms of place, two locations comes to mind: Churchill, Manitoba and Tromso, Norway. But until such time as the transporter is invented, most of us will be staying closer to home. The simple answer is north and the farther north the better.
As for the time, in the northern border states of the US, auroras occur fairly regularly around the time of solar maximum, when the sun peaks in storm activity. The current solar cycle tops out this summer and fall, so your chances at seeing northern lights are far better now than a year and a half ago when solar activity saw a steep decline during a protracted minimum.
A windsailing rover could use the high speeds and hot temperatures of Venus to a robotic explorer’s advantage, according to an idea funded by NASA’s Innovative Advanced Concepts program.
The rover would not only be able to move around Venus, but would also have electronics inside able to withstand the temperatures of 450 degrees Celsius (840 degrees Fahrenheit).
The rover, which is nicknamed Zephyr, would spend most of its time on Venus doing analysis on the ground. Whenever the science team wants to move some distance, however, it would deploy a sail that could bring it across the surface. One vision sees it sailing for about 15 minutes a day for about a month.
“A sail rover would be extraordinary for Venus. The sail has only two moving parts-just to set the sail and set the steering position-and that doesn’t require a lot of power. There’s no power required to actually drive,” stated Geoffrey Landis, who is with NASA’s Glenn Research Center.
“The fundamental elements of a rover for Venus are not beyond the bounds of physics,” Landis added. “We could survive the furnace of Venus if we can come up with an innovative concept for a rover that can move on extremely low power levels.”
The Hubble image above shows a strange galaxy, known as Mrk 273. The odd shape – including the infrared bright center and the long tail extending into space for 130 thousand light-years – is strongly indicative of a merger between galaxies.
Near-infrared observations have revealed a nucleus with multiple components, but for years the details of such a sight have remained obscured by dust. With further data from the Keck Telescope, based in Hawaii, astronomers have verified that this object is the result of a merger between galaxies, with the infrared bright center consisting of two active galactic nuclei – intensely luminous cores powered by supermassive black holes.
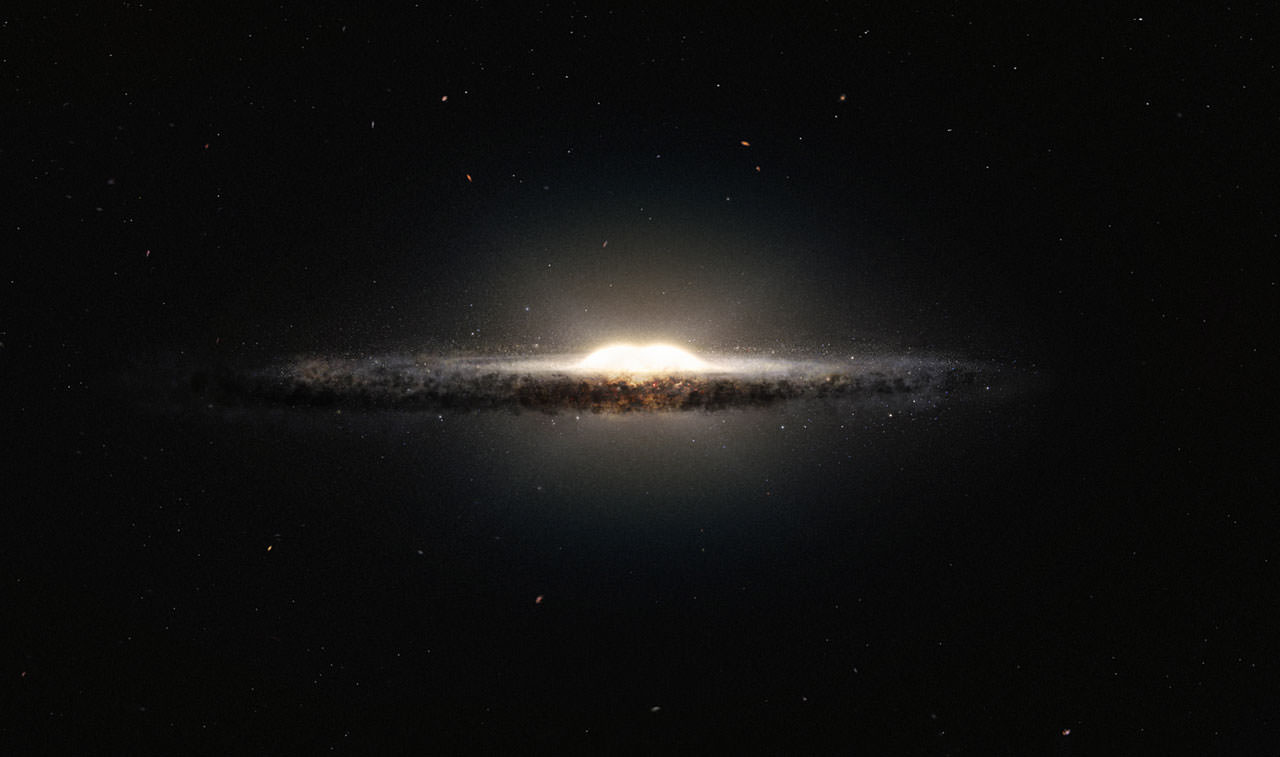
At the center of every single galaxy is a supermassive black hole. While the name sounds exciting, our supermassive black hole, Sgr A* is pretty quiescent. But at the center of every early galaxy looms the opposite: an active galactic nuclei (AGN for short). There are plenty of AGN in the nearby Universe as well, but the question stands: how and when do these black holes become active?
In order to find the answer astronomers are looking at merging galaxies. When two galaxies collide, the supermassive black holes fall toward the center of the merged galaxy, resulting in a binary black hole system. At this stage they remain quiescent black holes, but are likely to become active soon.
“The accretion of material onto a quiescent black hole at the center of a galaxy will enable it to grow in size, leading to the event where the nucleus is “turned on” and becomes active,” Dr. Vivian U, lead author on the study, told Universe Today. “Since galaxy interaction provides means for gaseous material in the progenitor galaxies to lose angular momentum and funnels toward the center of the system, it is thought to play a role in triggering AGN. However, it has been difficult to pinpoint exactly how and when in a merging system this triggering occurs.”
While it has been known that an AGN can “turn on” before the final coalescence of the two black holes, it is unknown as to when this will happen. Quite a few systems do not host dual AGN. For those that do, we do not know whether synchronous ignition occurs or not.
Mrk 273 provides a powerful example to study. The team used near-infrared instruments on the Keck Telescope in order to probe past the dust. Adaptive optics also removed the blurring affects caused by the Earth’s atmosphere, allowing for a much cleaner image – matching the Hubble Space Telescope, from the ground.
“The punch line is that Mrk 273, an advanced late-stage galaxy merger system, hosts two nuclei from the progenitor galaxies that have yet to fully coalesce,” explains Dr. U. The presence of two supermassive black holes can be easily discerned from the rapidly rotating gas disks that surround the two nuclei.
“Both nuclei have already been turned on as evidenced by collimated outflows (a typical AGN signature) that we observe” Dr. U told me. Such a high amount of energy released from both supermassive black holes suggests that Mrk 273 is a dual AGN system. These exciting results mark a crucial step in understanding how galaxy mergers may “turn on” a supermassive black hole.
The team has collected near-infrared data for a large sample of galaxy mergers at different merging states. With the new data set, Dr. U aims “to understand how the nature of the nuclear star formation and AGN activity may change as a galaxy system progresses through the interaction.”
The results will be published in the Astrophysical Journal (preprint available here).
A simple, yet elegant method of measuring the surface gravity of a star has just been discovered. These computations are important because they reveal stellar physical properties and evolutionary state – and that’s not all. The technique works equally well for estimating the size of hundreds of exoplanets. Developed by a team of astronomers and headed by Vanderbilt Professor of Physics and Astronomy, Keivan Stassun, this new technique measures a star’s “flicker”. Continue reading “Flicker… A Bright New Method of Measuring Stellar Surface Gravity”
Earth Waves at Saturn and Cassini on July 19, 2013
From more than 40 countries and 30 U.S. states, people around the world shared more than 1,400 images of themselves as part of the Wave at Saturn event organized by NASA’s Cassini mission on July 19, 2013. The Cassini team created this image collage as a tribute to the people of Earth
Credit: NASA/JPL-Caltech/People of Earth
See link below to the absolutely gigantic full resolution version [/caption]
On July 19, millions of Earthlings worldwide participated in NASA’s ‘Wave at Saturn’ campaign as the NASA Cassini Saturn orbiter turned about and imaged all of us.
Earthlings from 40 countries and 30 U.S. states heeded NASA’s call to photograph themselves while smiling and waving at Saturn and Cassini across 1 billion miles of interplanetary space and shared over 1400 images.
The results of all those images has now been assembled into a fabulous collage in the shape of our planet and released today (Aug. 21) by NASA and the Cassini team as a tribute to the People of Earth.
“Did you wave at Saturn and send us your photo? Then here’s looking at you!” NASA announced on the Cassini Facebook page.
This event was the first time that the citizens of Earth knew in advance that a distant interplanetary spacecraft was photographing portraits of our home planet and our Moon. NASA invited everyone to participate.
Photos flooded into NASA via Twitter, Facebook, Flickr, Instagram, Google+ and email.
Click here for the full resolution version. But be forewarned – it weighs in at over 26 MB and it’s far too big to post here.
“Thanks to all of you, near and far, old and young, who joined the Cassini mission in marking the first time inhabitants of Earth had advance notice that our picture was being taken from interplanetary distances,” said Linda Spilker, Cassini project scientist at NASA’s Jet Propulsion Laboratory, Pasadena, Calif, in a statement.
“While Earth is too small in the images Cassini obtained to distinguish any individual human beings, the mission has put together this collage so that we can celebrate all your waving hands, uplifted paws, smiling faces and artwork.”
The Cassini imaging science team is still assembling the hundreds of images of Saturn and Earth snapped by the spacecraft as we were waving, to create individual color composites and a panoramic view of the ‘pale blue dot’ and the entire Saturnian system.
To capture all of Saturn and its wide swath of rings, Cassini’s wide angle camera snapped a mosaic of 33 footprints on July 19, 2013.
“At each footprint, images were taken in different spectral filters for a total of 323 images,” says Carolyn Porco, Cassini Imaging Team leader, Space Science Institute in Boulder, Colo.
Cassini took the pictures of Earth from a distance of about 898 million miles (1.44 billion kilometers) away from the home to every human being that has ever lived.
It achieved orbit at Saturn in 2004 and has transmitted breathtaking images and science that revolutionized our understanding of the Saturnian system.
The mission is scheduled to continue until 2017 when it will commit a suicide death dive into the humongous gas giant.
Coincidentally, the first humans (Neil Armstrong and Buzz Aldrin) set foot on the Moon 44 years ago nearly to the day of Cassini’s Earth-Moon portrait on July 20, 1969 aboard Apollo 11.
And now for something to appeal to your inner geek. Or, if you’re like me, your outer geek. Many of you have been watching the new nova in Delphinus with the naked eye and binoculars since it burst onto the scene early Aug. 14. In a moment I’ll show how to turn your observations into a cool representation of the nova’s behavior over time.
Where I live in northern Minnesota, we’ve had a lucky run of clear nights since the outburst began. Each night I’ve gone out with my 8×40 binoculars and star chart to estimate the nova’s brightness. The procedure is easy and straightforward. You find comparison stars near the nova with known magnitudes, then select one a little brighter and one a little fainter and interpolate between the two to arrive at the nova’s magnitude.
For example, if the nova’s brightness lies halfway between the magnitude 4.8 and 5.7 stars it’s about magnitude 5.3. The next night you might notice it’s not exactly halfway but a tad brighter or closer to the 4.8 star. Then you’d measure 5.2. Remember that the smaller the number, the brighter the object. I’ve found that defocusing the stars into disks makes it a bit easier to estimate these differences.
In time, you’ll come up with a list of magnitudes or brightness estimates for Nova Delphini. Here’s mine to date:
* Aug. 14: 5.8
* Aug. 15: 4.9
* Aug. 16: 5.0
* Aug. 17: 5.0
* Aug. 18: 5.0
* Aug. 19: 5.2
* Aug. 20: 5.5
So far just numbers, but there’s a way to turn this into a satisfying visual picture of the nova’s long-term behavior. Graph it! That’s what astronomers do, and they call it a light curve.
I dug around and came up with this very basic template. The horizontal or x-axis measures time in days, the vertical or y-axis plots the nova’s brightness measured in magnitudes. You can either right-click and save the image above or grab the higher-res version HERE.
Next, print out a copy and lay in your data points with pencil and ruler the old-fashioned way or use an imaging program like Photoshop or Paint to do the same on the computer. I use a very basic version of Photoshop Elementsto plot my observations. Once your observations are marked, connect them to build your light curve.
Right away you’ll notice a few interesting things. The nova shot up from approximately 17th magnitude on Aug. 13 to 6.8 on Aug. 14 – a leap of more than 10 magnitudes, which translates to a nearly 10,000 fold increase in brightness.
I wasn’t able to see the Nova Del top out at around 4.4 magnitude – that happened when I was asleep the next morning – but I did catch it at 4.9. The next few days the nova hits a plateau followed by what appears for the moment like a steady decline in brightness. Will it rocket back up or continue to fade? That’s for you and your binoculars to find out the next clear night.
If you’d like to take the next step and contribute your observations for scientific use, head over to the AAVSO (American Assn. of Variable Star Observers) and become a member. Even if you don’t sign up, access to data, charts and light curves of novae and other variable stars is completely free.
I get a kick out of comparing my basic light curves with those created with thousands of observations contributed by hundreds of observers. The basic AAVSO curve looks all scrunched up for the moment because their time scale (x-axis) is much longer term than in my simple example. But guess what? You can change the scale using their light curve generatorand open up the view a little more as I did in the curve above.
Here are a couple other typical novae light curves. By the time you’re done looking at the examples here as well as creating your own, you’ll gain a familiarity that may surprise you. Not only will be able to interpret trends in Nova Delphini’s brightness, but you’ll better understand the behavior of other variable stars at a glance. It’s as easy as connecting the dots.