How Do Black Holes Get Super Massive?

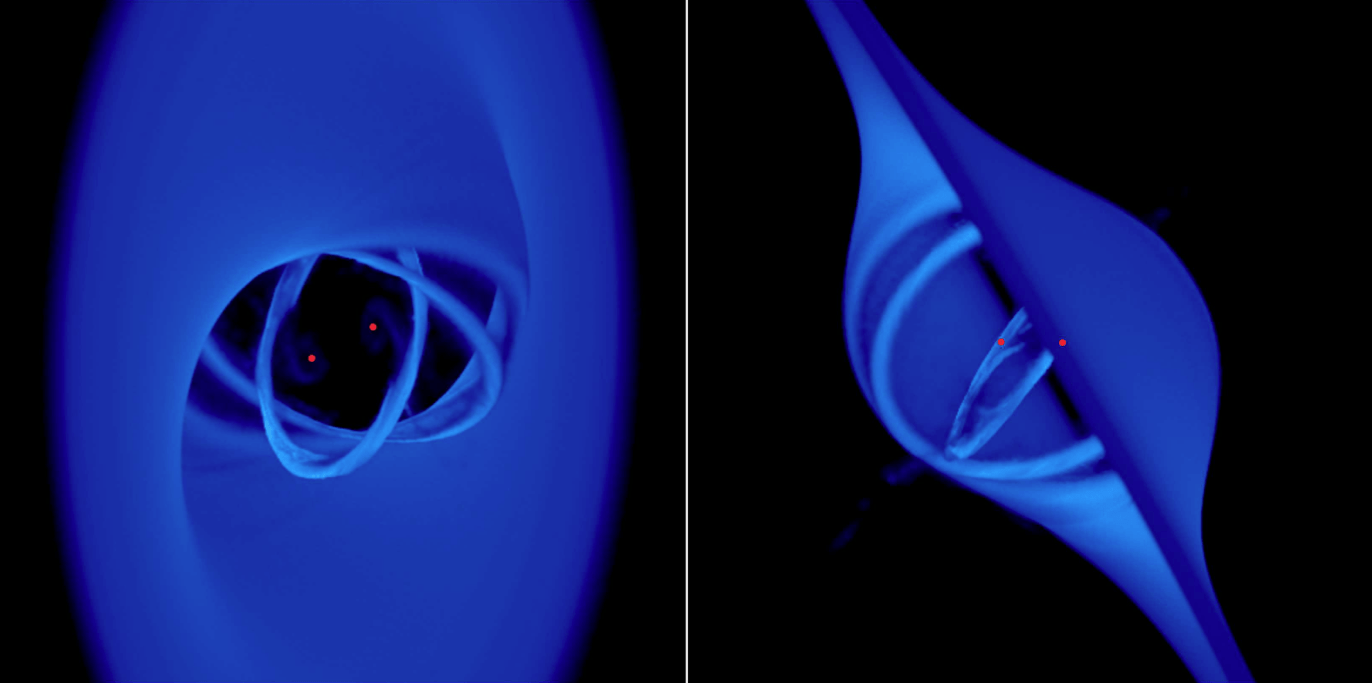
A binary black hole pair with an accretion disk inclined 45 degrees. Source: Nixon et al.

Since their discovery, supermassive black holes – the giants lurking in the center of every galaxy – have been mysterious in origin. Astronomers remain baffled as to how these supermassive black holes became so massive.

New research explains how a supermassive black hole might begin as a normal black hole, tens to hundreds of solar masses, and slowly accrete more matter, becoming more massive over time. The trick is in looking at a binary black hole system.  When two galaxies collide the two supermassive black holes sink to the center of the merged galaxy and form a binary pair.  The accretion disk surrounding the two black holes becomes misaligned with respect to the orbit of the binary pair. It tears and falls onto the black hole pair, allowing it to become more massive.

In a merging galaxy the gas flows are turbulent and chaotic. Because of this “any gas feeding the supermassive black hole binary is likely to have angular momentum that is uncorrelated with the binary orbit,” Dr. Chris Nixon, lead author on the paper, told Universe Today. “This makes any disc form at a random angle to the binary orbit.

Nixon et al. examined the evolution of a misaligned disk around a binary black hole system using computer simulations. For simplicity they analyzed a circular binary system of equal mass, acting under the effects of Newtonian gravity. The only variable in their models was the inclination of the disk, which they varied from 0 degrees (perfectly aligned) to 120 degrees.

After running multiple calculations, the results show that all misaligned disks tear. Watch tearing in action below:

In most cases this leads to direct accretion onto the binary.

“The gravitational torques from the binary are capable of overpowering the internal communication in the gas disc (by pressure and viscosity),” explains Nixon. “This allows gas rings to be torn off, which can then be accreted much faster.”

Such tearing can produce accretion rates that are 10,000 times faster than if the exact same disk were aligned.

In all cases the gas will dynamically interact with the binary.  If it is not accreted directly onto the black hole, it will be kicked out to large radii.  This will cause observable signatures in the form of shocks or star formation.  Future observing campaigns will look for these signatures.

In the meantime, Nixon et al. plan to continue their simulations by studying the effects of different mass ratios and eccentricities.  By slowly making their models more complicated, the team will be able to better mimic reality.

Quick interjection: I love the simplicity of this analysis. These results provide an understandable mechanism as to how some supermassive black holes may have formed.

While these results are interesting alone – based on that sheer curiosity that drives the discipline of astronomy forward – they may also play a more prominent role in our local universe.

Before we know it (please read with a hint of sarcasm as this event will happen in 4 billion years) we will collide with the Andromeda galaxy. This rather boring event will lead to zero stellar collisions and a single black hole collision – as the two supermassive black holes will form a binary pair and then eventually merge.

Without waiting for this spectacular event to occur, we can estimate and model the black hole collision.  In 4 billion years the video above may be a pretty good representation of our collision with the Andromeda galaxy.

The results have been published in the Astrophysical Journal Letters (preprint available here). (Link was corrected to correct paper on 8/15/2013).

Is the Sun More Active Than it Looks? An Innovative Method to Characterize the Solar Cycle

A solar cycle montage from August 1991 to September 2001 in X-rays courtesy of the Yohkoh Solar Observatory. (Credit: David Chenette, Joseph B. Gurman, Loren W. Acton, image in the public Domain).

The Sun has provided no shortage of mysteries thus far during solar cycle #24.

And perhaps the biggest news story that the Sun has generated recently is what it isn’t doing. As Universe Today recently reported, this cycle has been an especially weak one in terms of performance. The magnetic polarity flip signifying the peak of the solar maximum is just now upon us, as the current solar cycle #24 got off to a late start after a profound minimum in 2009…

Or is it?

Exciting new research out of the University of Michigan in Ann Arbor’s Department of Atmospheric, Oceanic and Space Sciences published in The Astrophysical Journal this past week suggests that we’re only looking at a portion of the puzzle when it comes to solar cycle activity.

Traditional models rely on the monthly averaged sunspot number. This number correlates a statistical estimation of the number of sunspots seen on the Earthward facing side of the Sun and has been in use since first proposed by Rudolf Wolf in 1848. That’s why you also hear the relative sunspot number sometimes referred to as the Wolf or Zürich Number.

But sunspot numbers may only tell one side of the story. In their recent paper titled Two Novel Parameters to Evaluate the Global Complexity of the Sun’s Magnetic Field and Track the Solar Cycle, researchers Liang Zhao, Enrico Landi and Sarah E. Gibson describe a fresh approach to model solar activity via looking at the 3-D dynamics heliospheric current sheet.

The spiralling curve of the heliospheric current sheet through the inner solar system. (Graphic credit: NASA).
The spiraling curve of the heliospheric current sheet through the inner solar system. (Graphic credit: NASA).

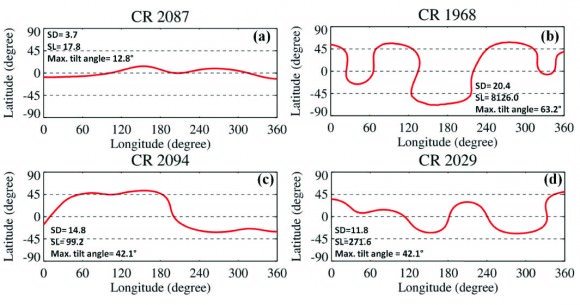
The heliospheric current sheet (or HCS) is the boundary of the Sun’s magnetic field separating the northern and southern polarity regions which extends out into the solar system. During the solar minimum, the sheet is almost flat and skirt-like. But during solar maximum, it’s tilted, wavy and complex.

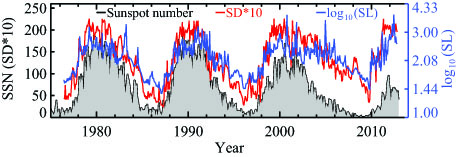
Two variables, known as SD & SL were used by researchers in the study to produce a measurement that can characterize the 3-D complexity of the HCS.  “SD is the standard deviation of the latitudes of the HCS’s position on each of the Carrington maps of the solar surface, which basically tells us how far away the HCS is distributed from the equator. And SL is the integral of the slope of HCS on that map, which can tell us how wavy the HCS is on each of the map,” Liang Zhao told Universe Today.

Ground and space-based observations of the Sun’s magnetic field exploit a phenomenon known as the Zeeman Effect, which was first demonstrated during solar observations conducted by George Ellery Hale using his new fangled invention of the spectrohelioscope in 1908. For the recent study, researchers used data covering a period from 1975 through 2013 to characterize the HCS data available online from the Wilcox Solar Observatory.

SD and SL perameters juxtaposed against the tradional monthly sunspot number.
SD and SL parameters juxtaposed against the traditional monthly sunspot number (SSN). Note the smooth fit until the end of solar cycle #23 around 2003. (Credit: Liang Zhao/The Astrophysical Journal).

Comparing the HCS value against previous sunspot cycles yields some intriguing results. In particular, comparing the SD and SL values with the monthly sunspot  number provide a “good fit” for the previous three solar cycles— right up until cycle #24.

“Looking at the HCS, we can see that the Sun began to act strange as early as 2003,” Zhao said. “This current cycle as characterized by the monthly sunspot number started a year late, but in terms of HCS values, the maximum of cycle #24 occurred right on time, with a first peak in late 2011.”

“Scientists believe there will be two peaks in the sunspot number in this solar maximum as in the previous maximum (in ~2000 and ~2002),” Zhao continued, “since the Sun’s magnetic fields in the north and south hemispheres look asymmetric, and the north evolved faster than the south recently. But so far as I can see, the highest value of monthly-averaged sunspot number in this cycle 24 is still the one in the November 2011. So we can say the first peak of cycle 24 could be in November of 2011, since it is the highest monthly sunspot number so far in this cycle. If there is a second peak, we will see it sooner or later.”

The paper also notes that although cycle 24 is especially weak when compared to recent cycles, its range of activity is not unique when compared with solar cycles over the past 260 years.

HCS curves plotted on the surface of the Sun.
HCS curves plotted on the surface of the Sun. Comparisons are made for the solar maximum on October 2000 (CR 1968), descending phase on April 2005 (2029), solar minimum on September 2009 (CR 2087), and ascending phase on March 2010 (CR2094). CR=Carrington Rotation. (Credit: Liang Zhao, The Astrophysical Journal).

The HCS value characterizes the Sun over one complete Carrington Rotation of 27 days. This is an averaged value for the rotation of the Sun, as the poles rotate slower than the equatorial regions.

The approximately 22 year span of time that it takes for the poles to reverse back to the same polarity again is equal to two average 11 year sunspot cycles. The Sun’s magnetic field has been exceptionally asymmetric during this cycle, and as of this writing, the Sun has already finished its reversal of the north pole first.

This sort of asymmetry during an imminent pole reversal was first recorded during solar cycle 19, which spanned 1954-1964. Solar cycles are numbered starting from observations which began in 1749, just four decades after the end of the 70-year Maunder Minimum.

“This is an exciting time to study the magnetic field of the Sun, as we may be witnessing a return to a less-active type of cycle, more like those of 100 years ago,” NCAR/HAO senior scientist and co-author Sarah Gibson said.

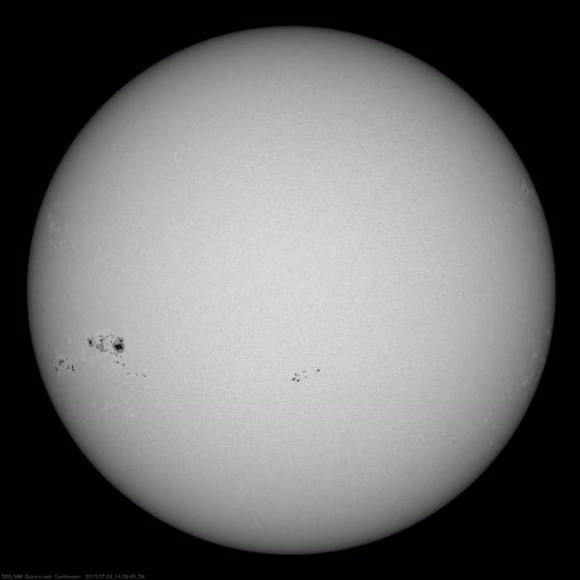
A massive sunspot group that rotated into view in early July, 2013... one of the largest seen for solar cycle #24 thus far. (Credit: NASA/SDO).
A massive sunspot group that rotated into view in early July, 2013, one of the largest seen for solar cycle #24 thus far. (Credit: NASA/SDO).

But this time, an armada of space and ground-based observatories will scrutinize our host star like never before. The SOlar Heliospheric Observatory (SOHO) has already followed the Sun through the equivalent of one complete solar cycle— and it has now been joined in space by STEREO A & B, JAXA’s Hinode, ESA’s Proba-2 and NASA’s Solar Dynamics Observatory. NASA’s Interface Region Imaging Spectrograph (IRIS) was also launched earlier this year and has just recently opened for business.

Will there be a second peak following the magnetic polarity reversal of the Sun’s south pole, or is Cycle #24 about to “leave the building?” And will Cycle #25 be absent all together, as some researchers suggest? What role does the solar cycle play in the complex climate change puzzle? These next few years will prove to be exciting ones for solar science, as the predictive significance of HCS SD & SL values are put to the test… and that’s what good science is all about!

-Read the abstract with a link to the full paper in The Astrophysical Journal by University of Michigan researchers here.

How To Hit A Landing Target On Mars … Potentially, Precisely and Perfectly!

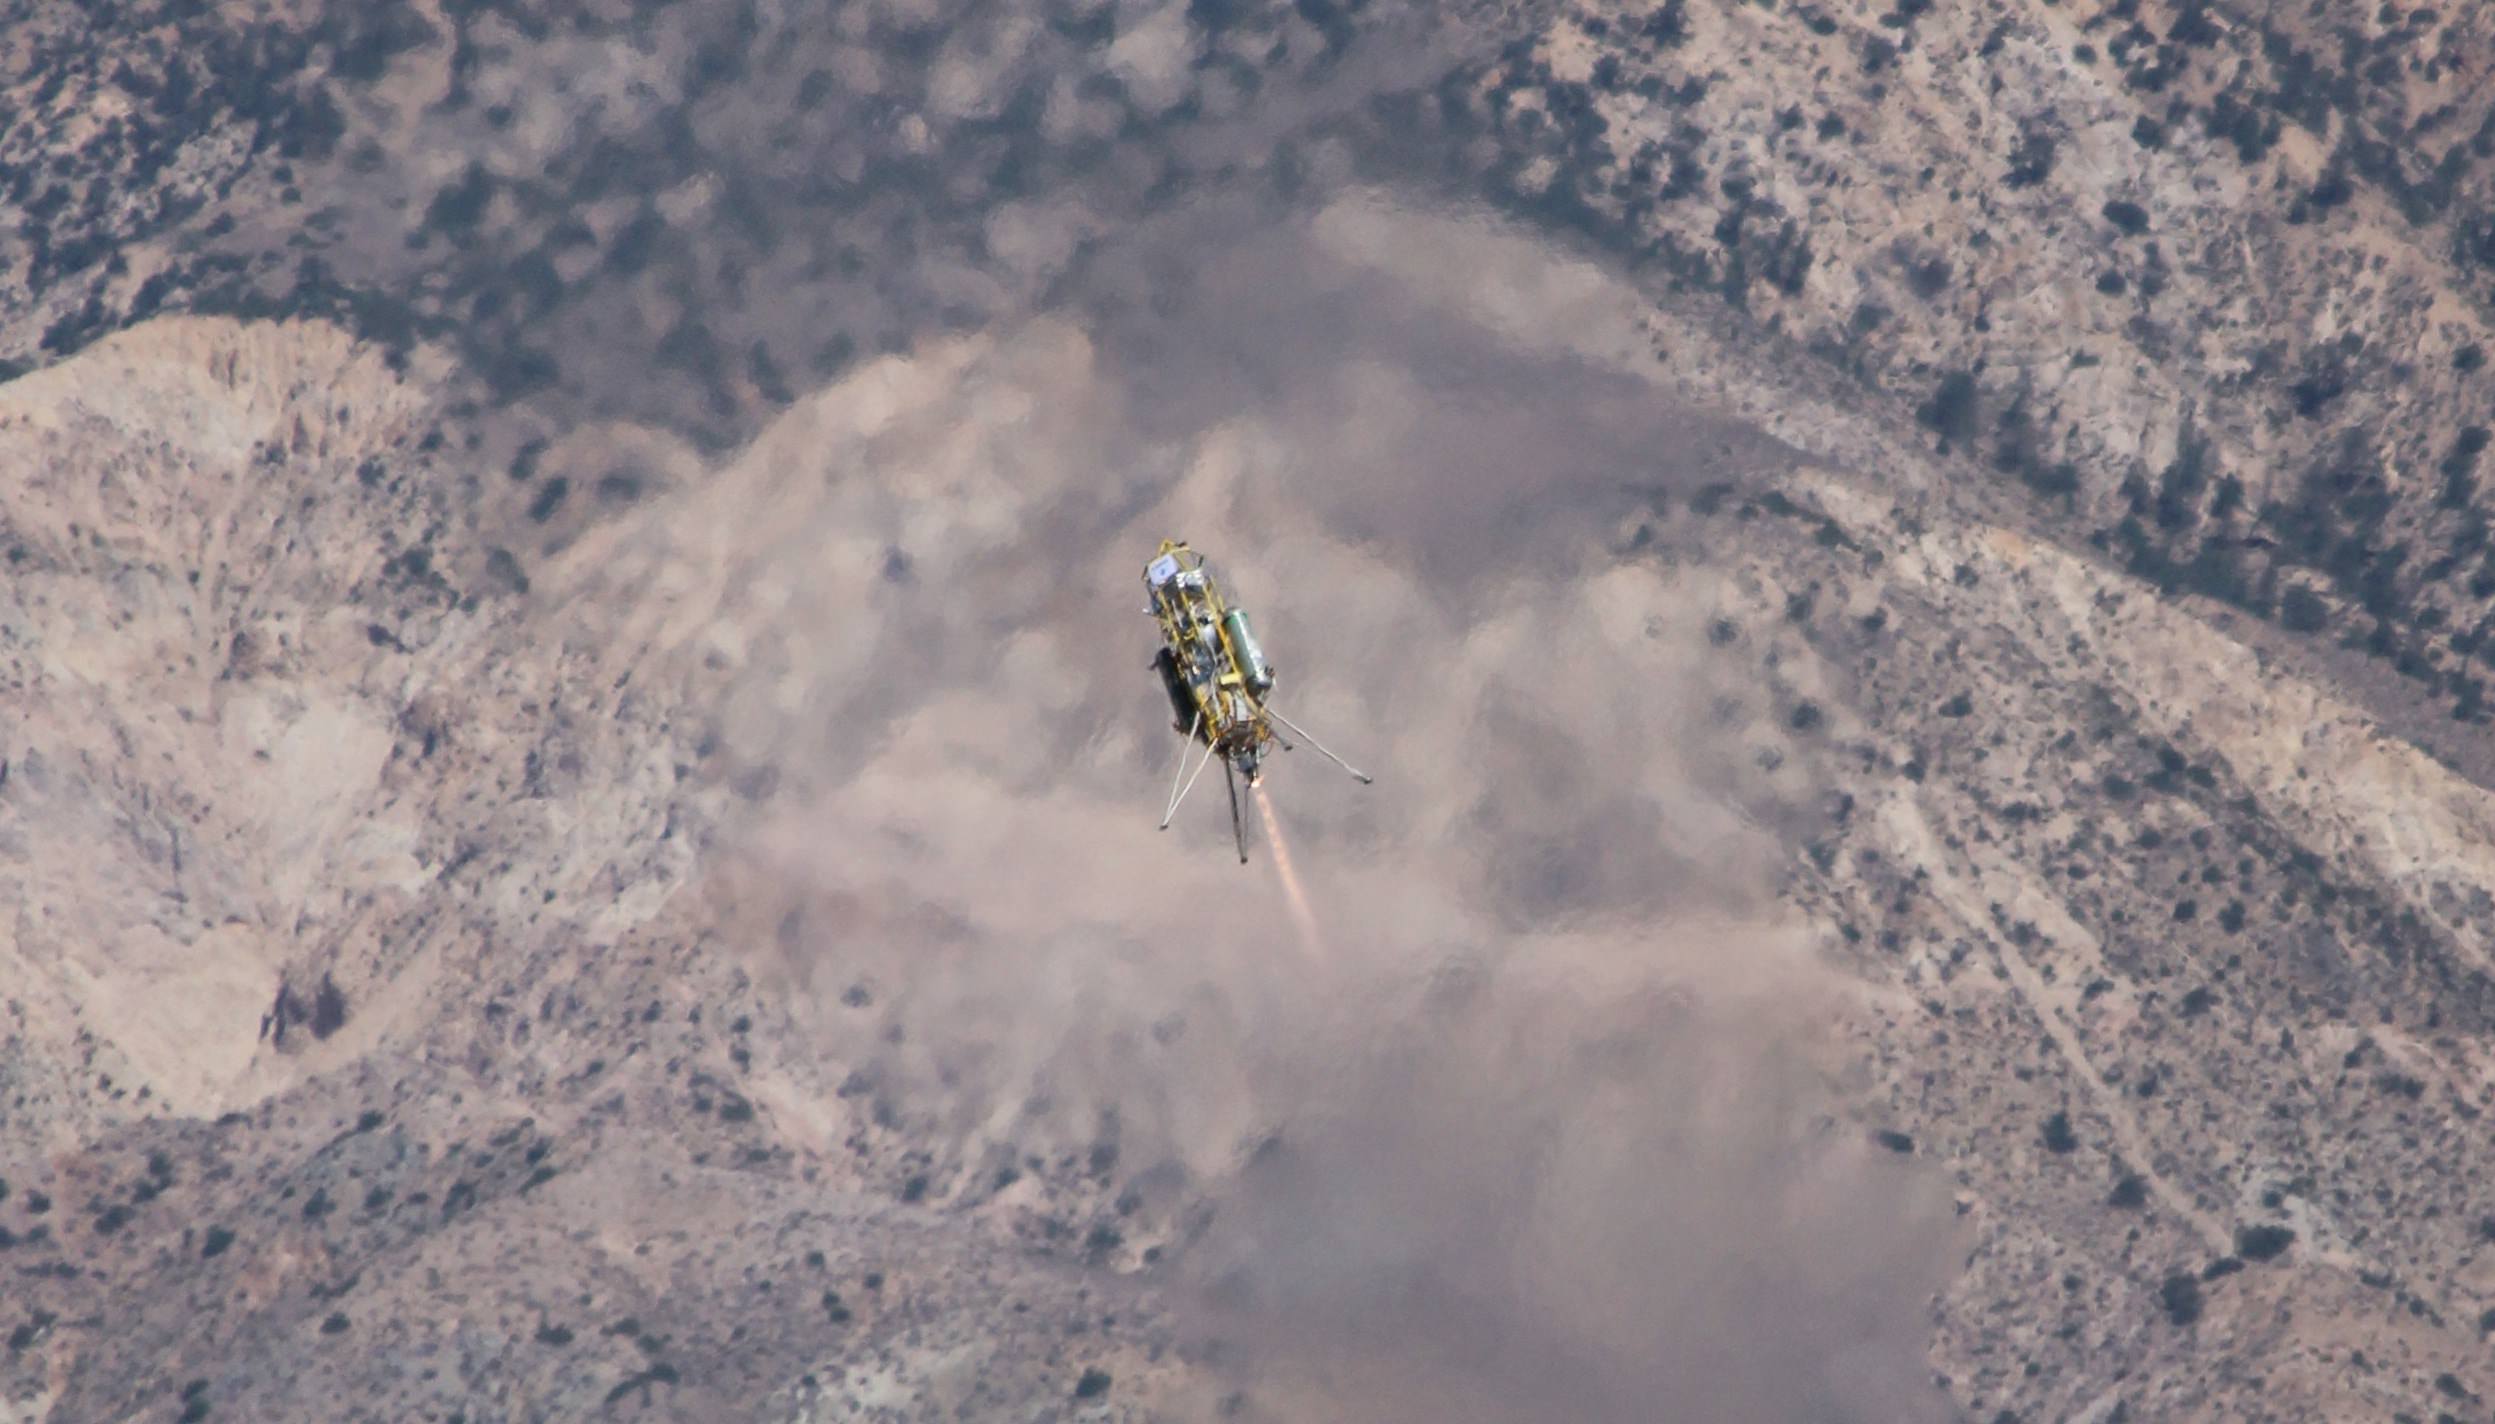
A Xombie technology demonstrator from Masten Space Systems. Credit: NASA/Masten

It’s frustrating to make it all the way to Mars, only to land in the wrong spot. So as Masten Space Systems tests its Xombie vertical-launch-vertical-landing rocket prototype on Earth, engineers are also examining a software solution to make Red Planet landings even more precise.

The software is called G-FOLD (for Fuel Optimal Large Divert Guidance algorithm) and is a product of NASA’s Jet Propulsion Laboratory and other NASA departments. The agency is using techniques for spacecraft landings that have origins from the Apollo moon missions of the 1960s, which have some limitations.

“These algorithms do not optimize fuel usage and significantly limit how far the landing craft can be diverted during descent,” JPL stated, adding that the new algorithm can figure out the best fuel-conserving paths in real time, along with a “key new technology required for planetary pinpoint landing.”

An artist's concept of Curiosity landing with the skycrane system. Credit: NASA/JPL
An artist’s concept of Curiosity landing with the skycrane system — demonstrating one recently used technique for landing on Mars. Credit: NASA/JPL

Hitting the target exactly is an exciting feat for researchers, JPL explained, because robotic missions can be steered to difficult-to-reach science targets and crewed missions could bring more cargo to their landing site rather than carrying extra fuel.

Xombie first tested out this technique on July 30 and nailed the landing — about half a mile away — when it received the commands while 90 feet in the air. A second flight is planned for August, providing the data analysis goes as planned.

The technology is still new, of course, and there are other concepts out there for pinpoint systems. In May, the European Space Agency released information on a concept it is funding. That system, which is also still being developed, uses a database of landmarks to assist a spacecraft with making landings.

Source: NASA

Aerospace Students Shoot for the Stars and Space Flight Dreams

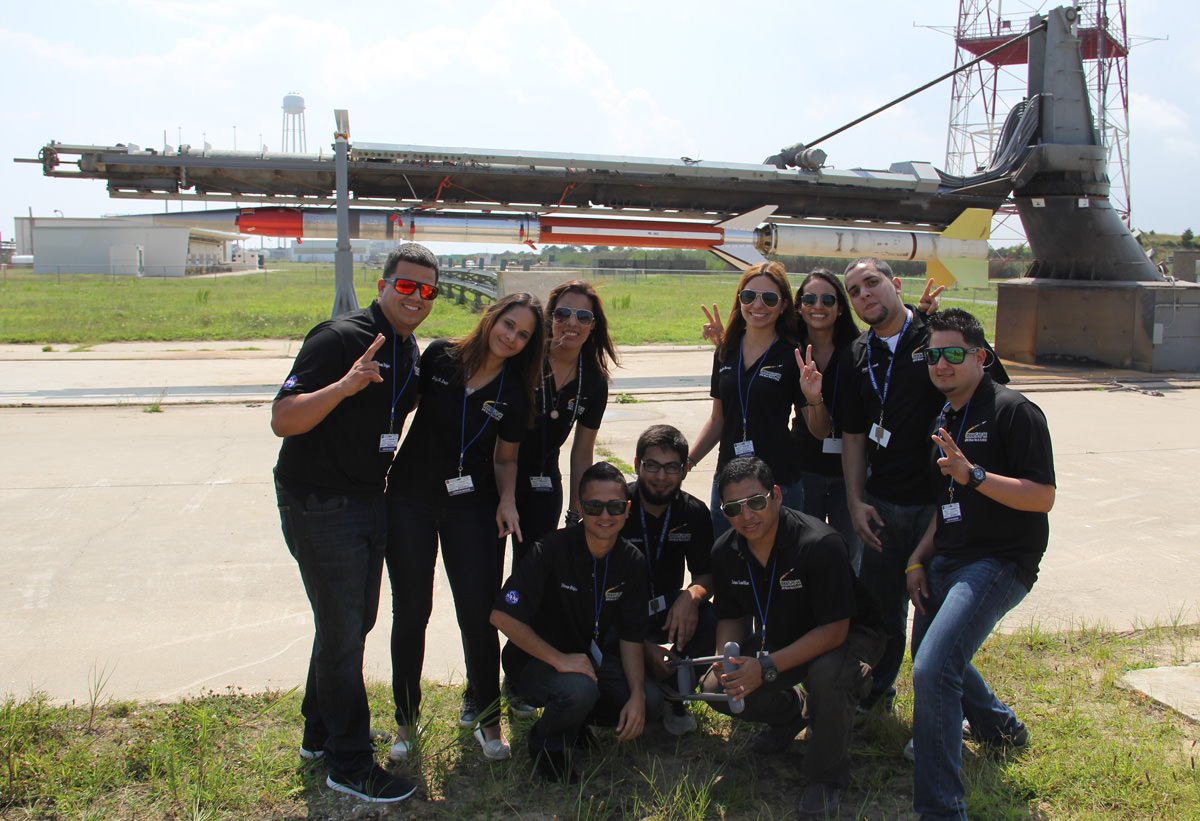
Rocket science university students from Puerto Rico pose for photo op with the Terrier-Improved Malemute sounding rocket that will launch their own developed RockSat-X science experiments to space on Aug. 13 at 6 a.m. from NASA Wallops Flight Facility, VA. Credit: Ken Kremer/kenkremer.com

Rocket science university students from Puerto Rico pose for photo op with the Terrier-Improved Malemute sounding rocket that will launch their own developed RockSat-X science experiments to space on Aug. 13 at 6 a.m. from NASA Wallops Flight Facility, VA.
Credit: Ken Kremer/kenkremer.com[/caption]

WALLOPS ISLAND, VA – How many of you have dreamed of flying yourselves or your breakthrough experiments to the High Frontier? Well if you are a talented student, NASA may have a ticket for you.

A diverse group of highly motivated aerospace students from seven universities spread across the United States have descended on NASA’s Wallops Flight Facility along the Eastern Shore of Virginia to fulfill the dream of their lifetimes – launching their very own science experiments aboard a rocket bound for space.

I met the thrilled students and professors today beside their rocket at the Wallops Island launch pad.

On Aug 13, after years of hard work, an impressive array of research experiments developed by more than 40 university students will soar to space on the RockSat-X payload atop a 44-foot tall Terrier-Improved Malemute suborbital sounding rocket at 6 a.m. EDT.

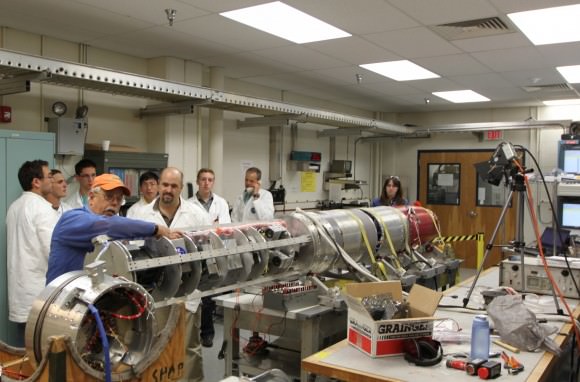
Students from Northwest Nazarene University observe the pre-integration of their experiment into the RockSat-X payload at the NASA Wallops Flight Facility in June. Students from seven universities are participating in the program and will attend the launch on August 13.  Credit: NASA/K. Koehler
Students from Northwest Nazarene University observe the pre-integration of their experiment into the RockSat-X payload at the NASA Wallops Flight Facility in June. Students from seven universities are participating in the program and will attend the launch on August 13. Credit: NASA/K. Koehler

The two stage rocket will rapidly ascend on a southeasterly trajectory to an altitude of some 97 miles and transmit valuable data in-flight during the 12-minute mission.

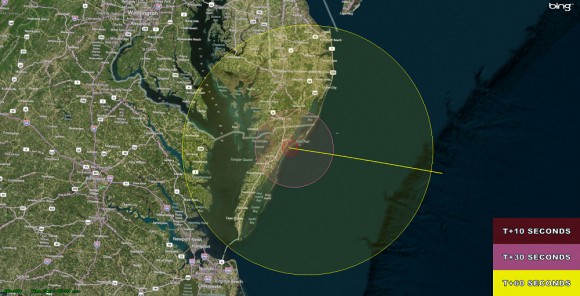
The launch will be visible to spectators in parts of Virginia, Maryland and Delaware, and perhaps a bit beyond. Check out the visibility map below.

The RockSat-X flight profile and visibility map. RockSat-X is scheduled to launch from NASA's Wallops Flight Facility, VA on Aug. 13 at 6.a.m. EDT  Credit: NASA
The RockSat-X flight profile and visibility map. RockSat-X is scheduled to launch from NASA’s Wallops Flight Facility, VA on Aug. 13 at 6.a.m. EDT Credit: NASA

If you’re available, try venturing out to watch it. The available window lasts until 10 a.m. EDT if needed.

The students will put their classroom learning to the test with experiments and instruments built by their own hands and installed on the 20 foot long RockSat-X payload. The integrated payload accounts for nearly half the length of the Terrier Malamute suborbital rocket. It’s an out of this world application of the scientific method.

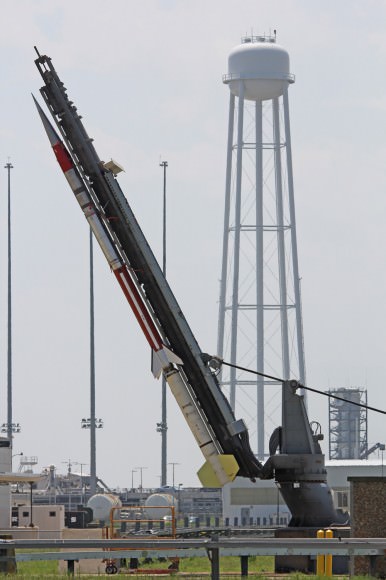
Terrier-Improved Malemute sounding rocket erected for launch of student experiments  on RockSat-X payload on Aug. 13 at 6 a.m. from NASA Wallops Flight Facility, VA.  Credit: Ken Kremer/kenkremer.com
Terrier-Improved Malemute sounding rocket erected for launch of student experiments on RockSat-X payload on Aug. 13 at 6 a.m. from NASA Wallops Flight Facility, VA. Credit: Ken Kremer/kenkremer.com
Included among the dozens of custom built student experiments are HD cameras, investigations into crystal growth and ferro fluids in microgravity, measuring the electron density in the E region (90-120km), aerogel dust collection on an exposed telescoping arm from the rockets side, effects of radiation damage on various electrical components, determining the durability of flexible electronics in the cryogenic environment of space and creating a despun video of the flight.

At the conclusion of the flight, the payload will descend to Earth via a parachute and splash down in the Atlantic Ocean approximately 86 miles offshore from Wallops.

Commercial fishing ships under contract to NASA will then recover the RockSat-X payload and return it to the students a few hours later, NASA spokesman Keith Koehler told Universe Today.

They will tear apart the payload, disengage their experiments and begin analyzing the data to see how well their instruments performed compared to the preflight hypotheses’.

RockSat-X is a joint educational activity between NASA and the Colorado Space Grant Consortium. It is the third of three practical STEM educational programs where the students must master increasingly difficult skill level requirements leading to a series of sounding rocket liftoffs.

In mid-June, some 50 new students participated in the successful ‘RockOn’ introductory level payload launch from Wallops using a smaller Terrier-Improved Orion rocket.

“The goal of the RockSat-X program is to provide students a hands-on experience in developing experiments for space flight,” said Chris Koehler, Director of the Colorado Space Grant Consortium.

“This experience allows these students to apply what they have learned in the classroom to a real world hands-on project.”

The students participating in this year’s RockSat-X launch program hail from the University of Colorado at Boulder; the University of Puerto Rico at San Juan; the University of Maryland, College Park; Johns Hopkins University, Baltimore, Md.; West Virginia University, Morgantown; University of Minnesota, Twin Cities; and Northwest Nazarene University, Nampa, Idaho.

Panoramic view of the NASA Wallops Flight Facility launch range at Virginia’s Eastern Shore during prior launch of two suborbital sounding rockets as part of the Daytime Dynamo mission. RockSat-X payload will launch on a Terrier-Improved Malemute sounding rocket.   Credit: Ken Kremer/kenkremer.com
Panoramic view of the NASA Wallops Flight Facility launch range at Virginia’s Eastern Shore during prior launch of two suborbital sounding rockets as part of the Daytime Dynamo mission. RockSat-X payload will launch on a Terrier-Improved Malemute sounding rocket. Credit: Ken Kremer/kenkremer.com

Some of these students today could well become the pioneering aerospace industry leaders of tomorrow!

In the event of a delay forced by weather or technical glitches, August 14 is the backup launch day.

A great place to witness the blastoff is from the NASA Wallops Visitor Center, offering a clear view to the NASA launch range.

It opens at 5 a.m. on launch day and is a wonderful place to learn about NASA missions – especially the pair of exciting and unprecedented upcoming launches of the LADEE lunar science probe to the moon and the Cygnus cargo carrier to the ISS in September.

Both LADEE and Cygnus are historic first of their kind flights from NASA Wallops.

Live coverage of the launch is available via UStream beginning at 5 a.m. on launch day at:
http://www.ustream.tv/channel/nasa-tv-wallops

Ken Kremer

…………….
Learn more about Suborbital Science, Cygnus, Antares, LADEE, MAVEN and Mars rovers and more at Ken’s upcoming presentations

Aug 12/13: “RockSat-X Suborbital Launch, LADEE Lunar & Antares Rocket Launches from Virginia”; Rodeway Inn, Chincoteague, VA, 8 PM

Sep 5/6/16/17: LADEE Lunar & Antares/Cygnus ISS Rocket Launches from Virginia”; Rodeway Inn, Chincoteague, VA, 8 PM

Oct 3: “Curiosity, MAVEN and the Search for Life on Mars – (3-D)”, STAR Astronomy Club, Brookdale Community College & Monmouth Museum, Lincroft, NJ, 8 PM

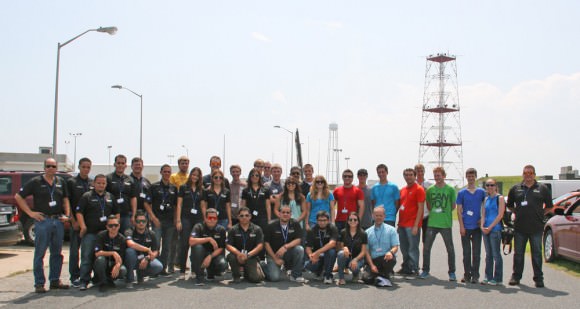
More than 40 University students participating in the Aug. 13 RockSat-X science payload pose for photo op with the Terrier-Improved Malemute sounding rocket that will launch their own experiments to space from NASA Wallops Flight Facility, VA.  Credit: Ken Kremer/kenkremer.com
More than 40 University students participating in the Aug. 13 RockSat-X science payload pose for photo op with the Terrier-Improved Malemute sounding rocket that will launch their own experiments to space from NASA Wallops Flight Facility, VA. Credit: Ken Kremer/kenkremer.com

Giveaway: Star Walk: Stargazing App for the iPhone

We have another great app giveaway for you, our valued readers. Star Walk is an app that allows you to point your iPhone at the night sky to provide names and descriptions of all the objects you are seeing. Furthermore, you can click on any individual star, satellite, planet or constellation and an in depth description will conveniently pop up on your screen. Whether you live in the city with lots of light pollution or in the country where there are more stars than black, this app will fill you in on all of the celestial objects you can (or can’t) see.

From the developer:

Star Walk is an award-winning Education app that allows users to easily locate and identify 20,000+ objects in the night sky. The 360-degree, touch control star map displays constellations, stars, planets, satellites, and galaxies currently overhead from anywhere on Earth. Highly praised and the winner of a 2010 Apple Design Award, the latest update allows users to enjoy unprecedented eye candy and interactivity of the star map, achieved with the new camera and high resolution of the new device.

Enter to win one of 10 free copies of this app for your iPhone. How?

In order to be entered into the giveaway drawing, just put your email address into the box at the bottom of this post (where it says “Enter the Giveaway”) before Monday, August 19, 2013. We’ll send you a confirmation email, so you’ll need to click that to be entered into the drawing.

A Challenging Series of Occultations of Spica by the Moon Coming to a Sky Near You

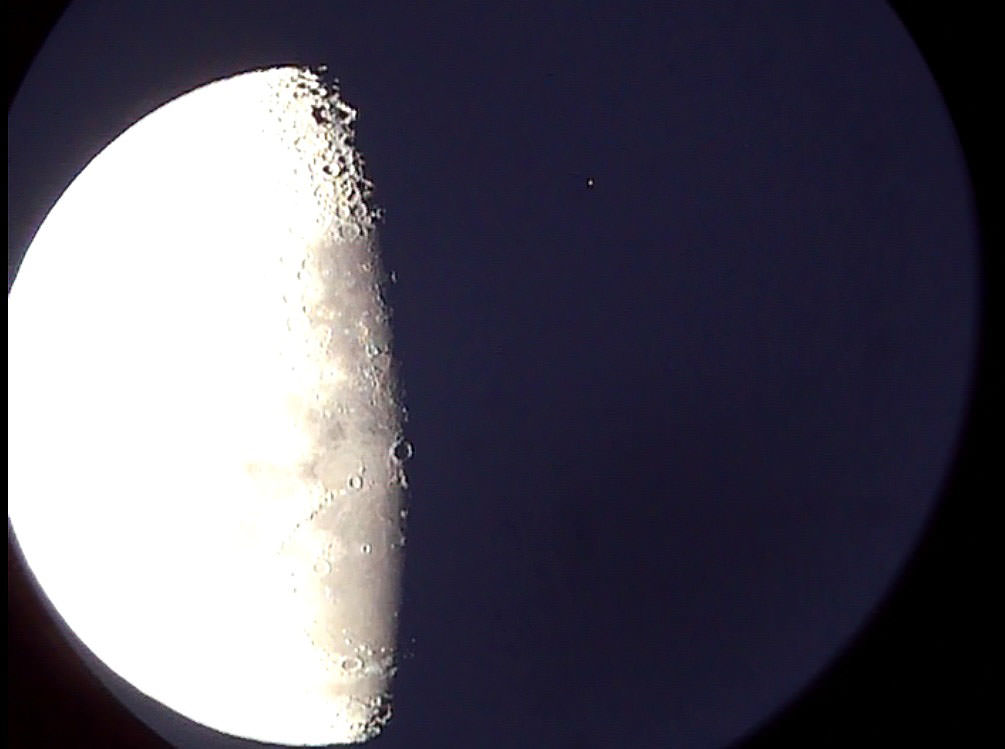
An occultation of the star Mu Geminorum (to the upper right off the dark limb of the Moon) Photo by author.

The first in a cycle of challenging occultations of the bright star Spica for northern hemisphere observers begins this coming Monday on August 12th.

Watching a bright star or planet wink out on the dark limb of the Moon can be an amazing event to witness. It’s an abrupt “now you see it, now you don’t” event in a universe which often seems to move at an otherwise glacial pace. And if the event grazes the limb of the Moon, an observer may see a series of winks as the starlight streams through the lunar valleys.

Close companion stars have been discovered during occultations, and astronomers even used a series of occultations of radio source 3C 273 in 1962 to pin down the position of the first quasar.

An occultation occurs when one object passes in front of another as seen from the observer’s vantage point. The term has its hoary roots back in a time when astronomy was intertwined with its pseudoscience ancestor of astrology. Even today, I still get funny looks from non-astronomy friends when I use the term occultation, as if it just confirms their suspicions of the arcane arts that astronomers really practice in secret.

But back to reality-based science. At an apparent magnitude of +1.1, Spica is the 3rd brightest star that the Moon can occult along its five degree path above and below the plane of the ecliptic. It’s also one of only four stars brighter than +1.4 magnitude on the Moon’s path. The others are Antares (magnitude +1.0), Regulus (magnitude +1.4), and Aldebaran (magnitude +0.8). All of these are bright enough to be visible on the lunar limb through binoculars or a telescope in the daytime if conditions are favorable.

It’s interesting to note that this situation also changes over time due to the precession of the equinoxes. For example, the bright star Pollux was last occulted by the Moon in 117 BC, but cannot be covered by the Moon in our current epoch.

Spica is currently in the midst of a cycle of 21 occultations by our Moon. This cycle started in July 25th, 2012 and will end in January 2014.

Spica is a B1 III-IV type star 10 times the mass of the Sun. At 260 light years distant, Spica is one of the closest candidates to the Earth along with Betelgeuse to go supernova. Now, THAT would make for an interesting occultation! Both are safely out of the ~100 light year distant “kill zone”.

What follows are the circumstances for the next four occultations of Spica by the Moon. The times are given for closest geocentric conjunction of the two objects. Actual times of disappearance and reappearance will vary depending on the observer’s location. Links are provided for each event which include more info.

Starry Night
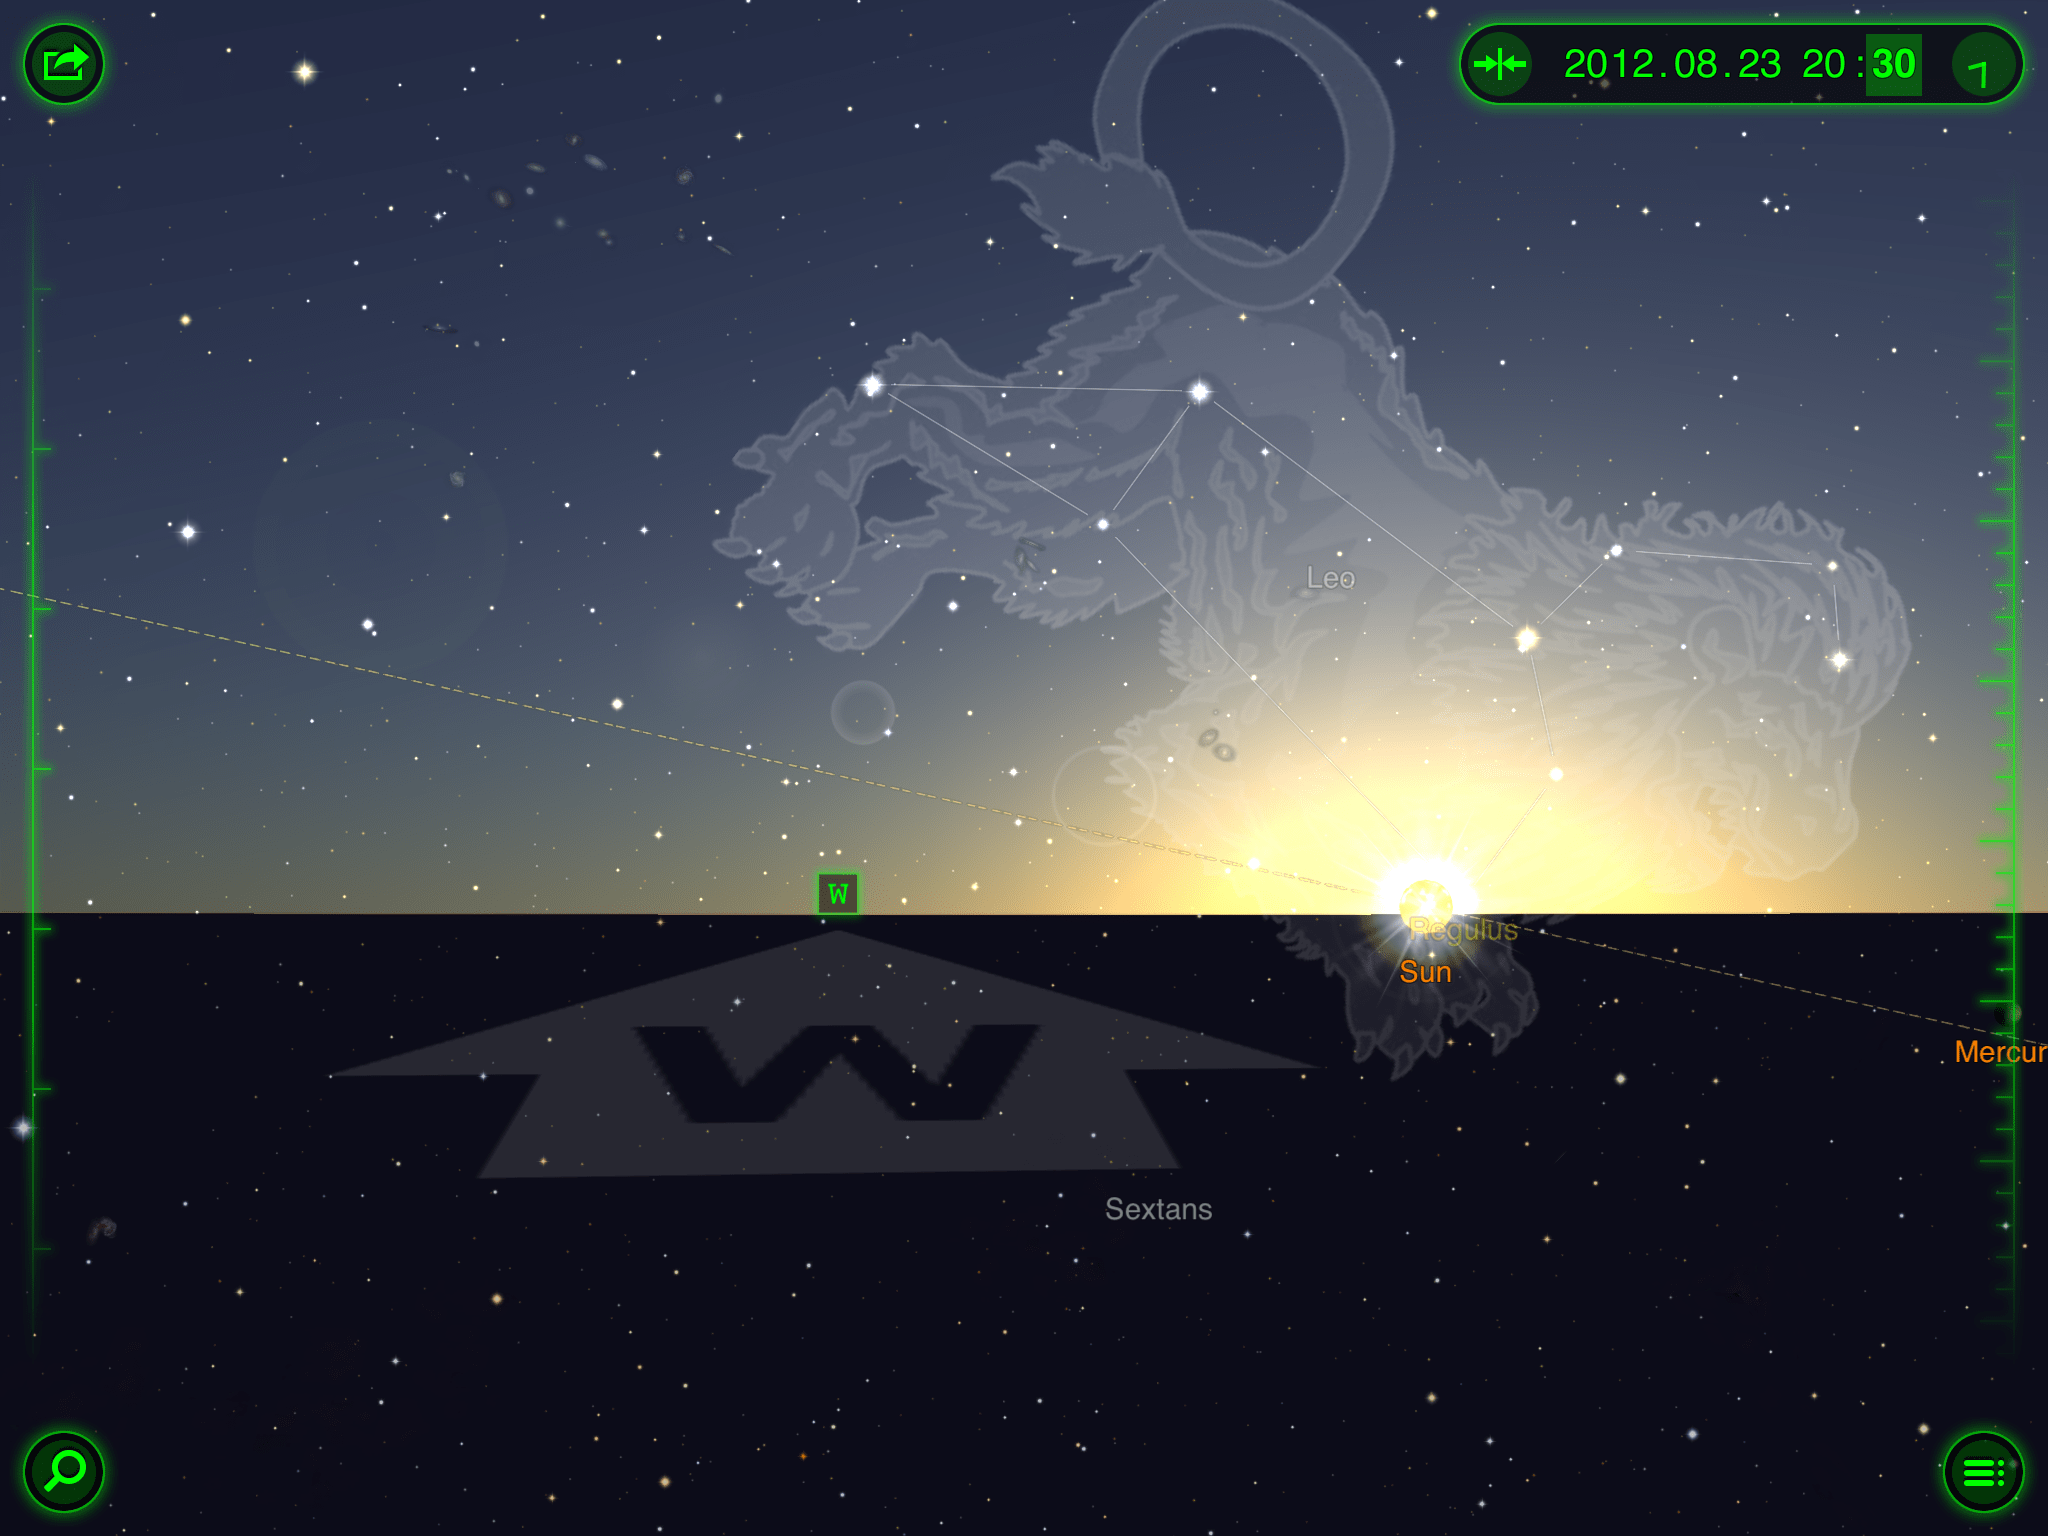
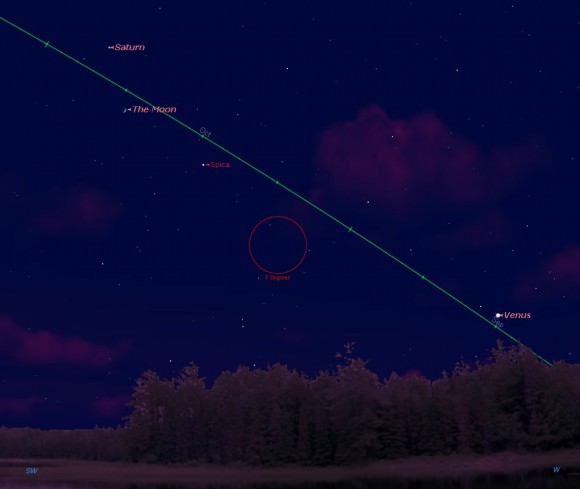
Looking westward 30 minutes after sunset for North American viewers on the night of August 12th. (Created by the Author using Starry Night).

First up is the August 12th occultation of Spica, which favors Central Asia and the Asian Far East. This will occur late in the afternoon sky around 09:00 UT  and prior to sunset. The waxing crescent Moon will be six days past New phase. North American observers will see the Moon paired five degrees from Spica with Saturn to the upper left on the evening of August 12th.

Occult
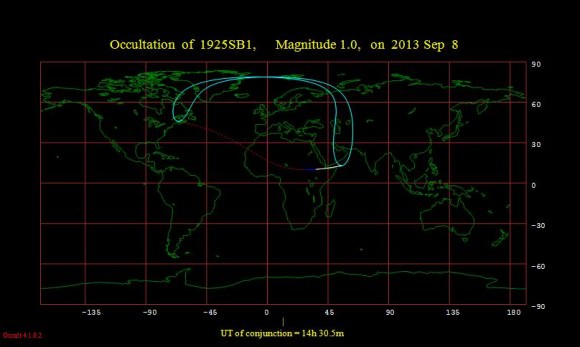
The footprint for the September 8th occultation of Spica by the Moon. Note that the broken line indicates where the occultation will take place in the daytime sky. ( Credit: Occult 4.1.0.2)

Next is the September 8th daytime occultation of Spica for Europe, the Middle East and northern Africa around ~15UT. This will be a challenge, as the Moon will be a waxing crescent at only 3 days past New. Observers in the Middle East will have the best shot at this event, as the occultation occurs at dusk and before moonset. Note that the Moon also occults Venus six hours later for Argentina and Chile.

Stellarium
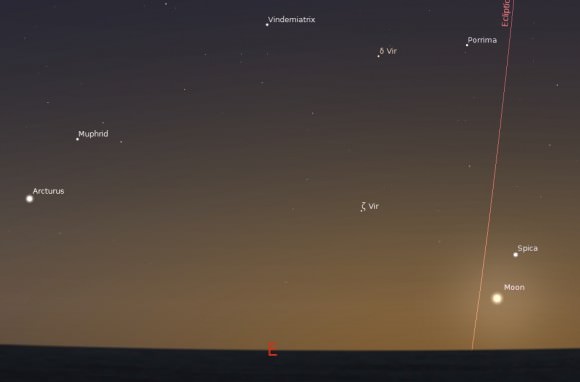
Looking to the east the morning of November 2nd for North American observers. (Created by the author using Stellarium).

After taking a break in October (the occultation of October 5 occurs only 23 hours after New and is unobservable), the Moon again occults Spica on November 2nd for observers across Europe & Central Asia. This will be a difficult one, as the Moon will be only 20 hours from New and a hybrid solar eclipse that will cross the Atlantic and central Africa. It may be possible to lock on to the Moon and track it up into the daylight, just be sure to physically block the rising Sun behind a building or hill!

USNO
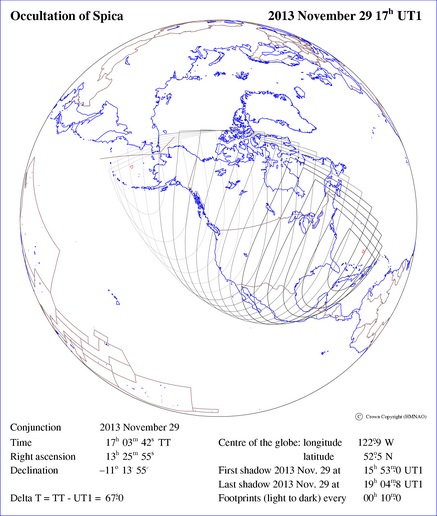
The occultation footprint of Spica by the Moon for November 29th, 2013.  (Reproduced from the Astronomical Almanac online and produced by the U.S. Naval Observatory and H.M. Nautical Almanac Office).

Finally, the Moon will occult Spica for North American observers on November 29th centered on 17:03 UT. This will place the event low in the nighttime sky for Alaskan observers. It’ll be a bit more of a challenge for Canadian and U.S. observers in the lower 48, as the Moon & Spica will be sandwiched between the Sun and the western horizon in the mid-day sky. As an added treat, comet C/2012 S1 ISON will reach perihelion on November 28th, just 20 hours prior and will be reaching peak brilliance very near the Sun.

And as an added bonus, the Moon will be occulting the +2.8 star Alpha Librae (Zubenelgenubi) on August 13th for central South America.

All of these events are challenges, to be sure. Viewers worldwide will still catch a close night time pairing of the Moon and Spica on each pass. We’ve watched the daytime Moon occult Aldebaran with binoculars while stationed in Alaska back in the late 1990’s, and can attest that such a feat of visual athletics is indeed possible.

And speaking of which, the next bright star due for a series of occultations by the Moon is Aldebaran starting in 2015. After 2014, Spica won’t be occulted by the Moon again until 2024.

But wait, there’s more- the total eclipse of the Moon occurring on April 15th 2014 occurs just 1.5 degrees from Spica, favoring North America. This is the next good lunar eclipse for North American observers, and one of the best “Moon-star-eclipse” conjunctions for this century. Hey, at least it’ll give U.S. observers something besides Tax Day to look forward to in mid-April. More to come in 2014!

Why Do Stars Twinkle?

Why Do Stars Twinkle?

Did you know you can distinguish between stars and planets in the sky?

Stars twinkle, planets don’t.

Okay, that’s not actually correct. The stars, planets, even the Sun and Moon twinkle, all in varying amounts. Anything outside the atmosphere is going to twinkle.

If you’re feeling a little silly using the word twinkle over and over again, we can also use the scientific term: astronomical scintillation.

You can’t feel it, but you’re carrying the entire weight of the atmosphere on your shoulders. Every single square inch of your skin is getting pushed by 15 pounds of pressure. And even though astronomers need our atmosphere to survive, it still drives them crazy. As it makes objects in space so much harder to see.

Stars twinkle, I mean scintillate, because as light passes down through a volume of air, turbulence in the Earth’s atmosphere refracts light differently from moment to moment. From our perspective, the light from a star will appear in one location, then milliseconds later, it’ll be distorted to a different spot.

We see this as twinkling.

So why do stars appear to twinkle, while planets don’t?

Stars appear as a single point in the sky, because of the great distance between us and them. This single point can be highly affected by atmospheric turbulence. Planets, being much closer, appear as disks.

We can’t resolve them as disks with our eyes, but it still averages out as a more stable light in the sky.

Astronomers battle atmospheric turbulence in two ways:

First, they try to get above it. The Hubble Space Telescope is powerful because it’s outside the atmosphere. The mirror is actually a quarter the size of a large ground-based observatory, but without atmospheric distortion, Hubble can resolve galaxies billions of light-years away. The longer it looks, the more light it gathers.

Second, they try to compensate for it.

Some of the most sophisticated telescopes on Earth use adaptive optics, which distorts the mirror of the telescope many times a second to compensate for the turbulence in the atmosphere.

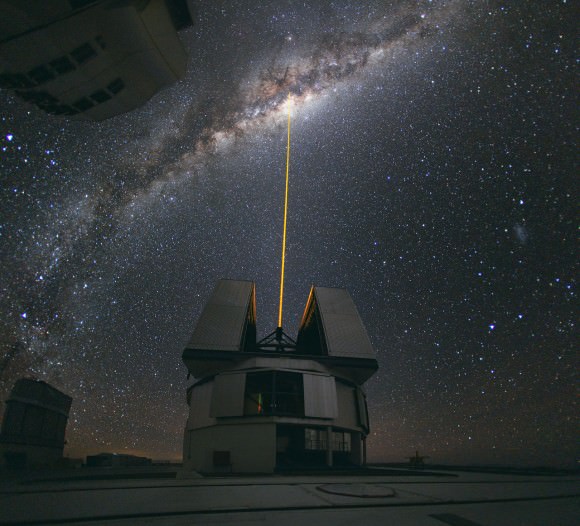
A beam from the Laser Star Guide on one of the VLT's four Unit Telescopes helps to correct the blurring effect of Earth's atmosphere before making observations (ESO/Y. Beletsky)
A beam from the Laser Star Guide on one of the VLT’s four Unit Telescopes helps to correct the blurring effect of Earth’s atmosphere before making observations (ESO/Y. Beletsky)
Astronomers project a powerful laser into the sky, creating an artificial star within their viewing area. Since they know what the artificial star should look like, they distort the telescope’s mirror with pistons cancelling out the atmospheric distortion. While it’s not as good as actually launching a telescope into space, it’s much, much cheaper.

Now you know why stars twinkle, why planets don’t seem to twinkle as much, and how you can make all of them stop.

We have written many articles about stars here on Universe Today. Here’s an article that talks about a technique astronomers use to minimize the twinkle of the Earth’s atmosphere.

If you’d like more information on stars, check out Hubblesite’s News Releases about Stars, and here’s the stars and galaxies homepage.

We have recorded several episodes of Astronomy Cast about stars. Here are two that you might find helpful: Episode 12: Where Do Baby Stars Come From, and Episode 13: Where Do Stars Go When they Die?

GRB Lights Up Ancient Hidden Galaxy

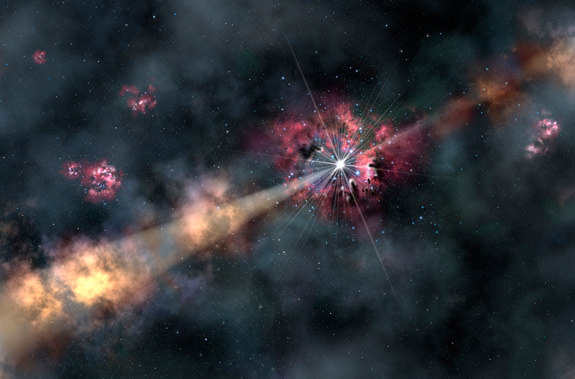
This artist's illustration depicts a gamma-ray burst illuminating clouds of interstellar gas in its host galaxy. By analyzing a recent gamma-ray burst, astronomers were able to learn about the chemistry of a galaxy 12.7 billion light-years from Earth. They discovered it contains only one-tenth of the heavy elements (metals) found in our solar system. Credit: Gemini Observatory/AURA, artwork by Lynette Cook

Once upon a time, more than 12.7 billion years ago, a star was poised on the edge of extinction. It made its home in a galaxy too small, too faint and too far away to even be spotted by the Hubble Space Telescope. Not that it would matter, because this star was going to end its life before the Earth formed. As it blew itself apart, it expelled its materials in twin jets which ripped through space at close to the speed of light – yet the light of its death throes outshone its parent galaxy by a million times.

“This star lived at a very interesting time, the so-called dark ages just a billion years after the Big Bang,” says lead author Ryan Chornock of the Harvard-Smithsonian Center for Astrophysics (CfA).

“In a sense, we’re forensic scientists investigating the death of a star and the life of a galaxy in the earliest phases of cosmic time,” he adds.

When this unsung star expired, it created one of the scariest things in astronomy… a gamma-ray burst (GRB). However, it wasn’t just a normal, garden variety GRB – it was long one, lasting more than four minutes. After century upon century of travel, the light reached our little corner of the Universe and was detected by NASA’s Swift spacecraft on June 6th. Chornock and his team quickly organized follow-up observations by the MMT Telescope in Arizona and the Gemini North telescope in Hawaii.

“We were able to get right on target in a matter of hours,” Chornock says. “That speed was crucial in detecting and studying the afterglow.”

Time to kick back and have a smoke? In a sense. The “afterglow” of a GRB happens when the jets impact the surrounding gas in an almost tsunami-like effect. As it sweeps up the material, it begins to heat and glow. As this light traverses the parent galaxy, it impacts clouds of interstellar gas, illuminating their spectra. Through these chemical signatures, astronomers are able to ascertain what gases the distant galaxy may have contained. As we know, all chemical elements heavier than hydrogen, helium, and lithium are the product of stars. Researchers refer to this as “metal content” and it takes a certain amount of time to accumulate. In the scheme of creation, the elements necessary for life – carbon and oxygen – didn’t exist. What Chornock and his team discovered was the GRB galaxy was host to only about a tenth of the “metals” in our solar system. What does that mean? In the eyes of the astronomers, rocky planets might have been able to form in that far away galaxy, but chances are good that life could not.

“At the time this star died, the universe was still getting ready for life. It didn’t have life yet, but was building the required elements,” says Chornock.

At a redshift of 5.9, or a distance of 12.7 billion light-years, GRB 130606A is one of the most distant gamma-ray bursts ever found.

“In the future we will be able to find and exploit even more distant GRBs with the planned Giant Magellan Telescope,” says Edo Berger of the CfA, a co-author on the publication.

Original Story Source: Harvard Smithsonian Center for Astrophysics News Release.

Ancient Astronomical Calendar Discovered in Scotland Predates Stonehenge by 6,000 Years

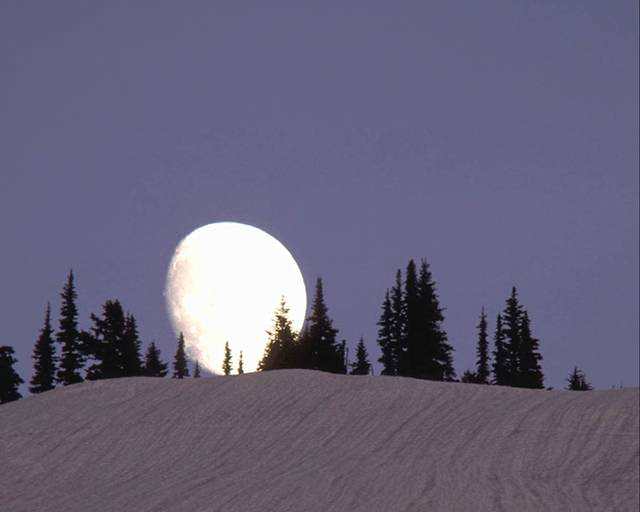
A wintertime rising gibbous Moon. (Image credit: Art Explosion).

A team from the University of Birmingham recently announced an astronomical discovery in Scotland marking the beginnings of recorded time.

Announced last month in the Journal of Internet Archaeology, the Mesolithic monument consists of a series of pits near Aberdeenshire, Scotland. Estimated to date from 8,000 B.C., this 10,000 year old structure would pre-date calendars discovered in the Fertile Crescent region of the Middle East by over 5,000 years.

But this is no ordinary wall calendar.

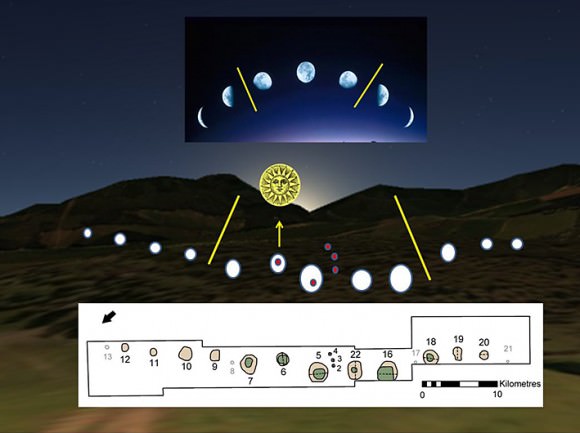
Originally unearthed by the National Trust for Scotland in 2004, the site is designated as Warren Field near the town of Crathes. It consists of 12 pits in an arc 54 metres long that seem to correspond with 12 lunar months, plus an added correction to bring the calendar back into sync with the solar year on the date of the winter solstice.

Diagram...
A diagram of the Warren Field site, showing the 12 pits (below) and the alignment with the phases of the Moon plus the rising of the winter solstice Sun. Note: the scale should read “0-10  metres.” (Credit: The University of Birmingham).

“The evidence suggests that hunter-gatherer societies in Scotland had both the need and sophistication to track time across the years, to correct for seasonal drift of the lunar year” said team leader and professor of Landscape Archaeology at the University of Birmingham Vince Gaffney.

We talked last week about the necessity of timekeeping as cultures moved from a hunter-gatherer to agrarian lifestyle. Such abilities as marking the passage of the lunar cycles or the heliacal rising of the star Sirius gave cultures the edge needed to dominate in their day.

For context, the pyramids on the plains of Giza date from around 2500 B.C., The Ice Man on display in Bolzano Italy dates from 3,300 B.C., and the end of the last Ice Age was around 20,000 to 10,000 years ago, about the time that the calendar was constructed.

“We have been taking photographs of the Scottish landscape for nearly 40 years, recording thousands of archaeological sites that would never have been detected from the ground,” said manager of Aerial projects of the Royal Commission of Aerial Survey Projects Dave Cowley. “It’s remarkable to think that our aerial survey may have helped to find the place where time was invented.”

The site at Warren Field was initially discovered during an aerial survey of the region.

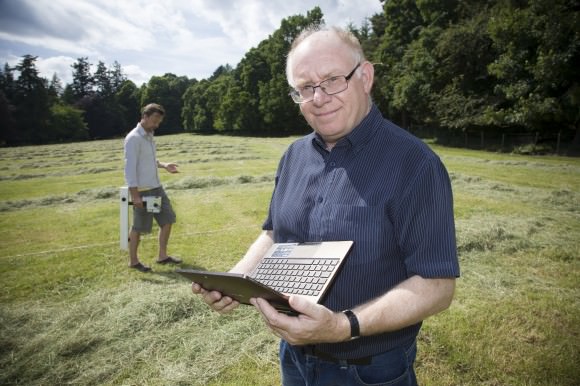
Vince Gaffney professor of Landscape and Archaeology at University of Birmingham in Warren Field, Crathes, Aberdeenshire where the discovery was made.
Vince Gaffney, professor of Landscape and Archaeology at University of Birmingham in Warren Field, Crathes, Aberdeenshire where the discovery was made. (Credit: The University of Birmingham).

The use of such a complex calendar by an ancient society also came as a revelation to researchers. Emeritus Professor of Archaeoastronomy at the University of Leicester Clive Ruggles notes that the site “represents a combination of several different cycles which can be used to track time symbolically and practically.”

The lunar synodic period, or the span of time that it takes for the Moon to return to the same phase (i.e., New-to-New, Full-to-Full, etc) is approximately 29.5 days. Many cultures used a strictly lunar-based calendar composed of 12 synodic months. The Islamic calendar is an example of this sort of timekeeping still in use today.

However, a 12 month lunar calendar also falls out of sync with our modern Gregorian calendar by 11 days (12 on leap years) per year.

The familiar Gregorian calendar is at the other extreme, a calendar that is strictly solar-based.  The Gregorian calendar was introduced in 1582 and is still in use today. This reconciled the 11 minute per year difference between the Julian calendar and the mean solar year, which by the time of Pope Gregory’s reform had already caused the calendar to “drift” by 10 days since the 1st Council of Nicaea 325 AD.

Artist’s conception of the Warren Field site during the winter solstice. (Credit: The University of Birmingham). Credit: The University of Birmingham

Surprisingly, the calendar discovered at Warren Field may be of a third and more complex variety, a luni-solar calendar. This employs the use of intercalary periods, also known as embolismic months to bring the lunar and solar calendar back into sync.

The modern Jewish calendar is an example of a luni-solar hybrid, which adds an extra month (known as the 2nd Adar or Adar Sheni) every 2-3 years. This will next occur in March 2014.

The Greek astronomer Meton of Athens noted in 5th century B.C. that 235 synodic periods very nearly add up to 19 years, to within a few hours. Today, this period bears his name, and is known as a metonic cycle. The Babylonian astronomers were aware of this as well, and with the discovery at Warren Field, it seems that ancient astronomers in Scotland may have been moving in this direction of advanced understanding as well.

It’s interesting to note that the site at Warren Field also predates Stonehenge, the most famous ancient structure in the United Kingdom by about 6,000 years. 10,000 years ago would have also seen the Earth’s rotational north celestial pole pointed near the +3.9th magnitude star Rukbalgethi Shemali (Tau Herculis) in the modern day constellation of Hercules. This is due to the 26,000 year wobble of our planet’s axis known as the precession of the equinoxes.

The precession of the north celestial pole over millenia. (Credit: Wikimedia Commons graphic under a Creative Commons Attribution 2.5 Generic license. Author: Tau'olunga).
The precession of the north celestial pole over millennia. (Credit: Wikimedia Commons graphic under a Creative Commons Attribution 2.5 Generic license. Author: Tau’olunga).

The Full Moon nearest the winter solstice also marks the “Long Nights Moon,” when the Full Moon occupies a space where the Sun resides during the summer months and  rides high above the horizon for northern observers all night. The ancients knew of the five degree tilt that our Moon has in relation to the ecliptic and how it can ride exceptionally high in the sky every 18.6 years. We’re currently headed towards a ‘shallow year’ in 2015, where the Moon rides low in relation to the ecliptic. From there, the Moon’s path in the sky will get progressively higher each year, peaking again in 2024.

Who built the Warren Field ruins along the scenic Dee Valley of Scotland? What other surprises are in store as researchers excavate the site? One thing is for certain: the ancients were astute students of the sky. It’s fascinating to realize how much of our own history has yet to be told!


What’s A Kilonova? You’re Looking At It!

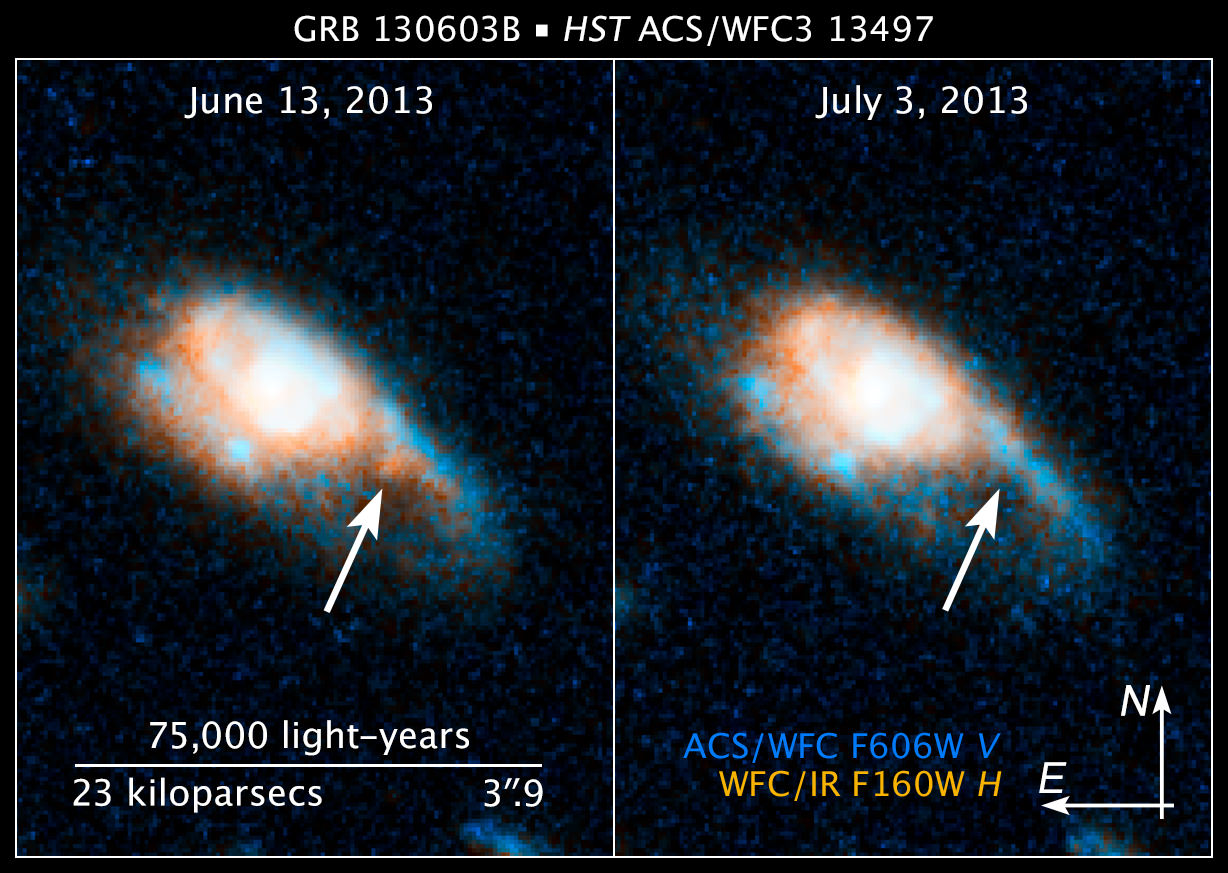
Remnants of a gamma-ray burst (called GRB 130603B) are visible in these Hubble Space Telescope pictures. Credit: NASA, ESA, and Z. Levay (STScI/AURA)

As astute readers of Universe Today, you likely know what a supernova is: a stellar explosion that signals the end game for certain kinds of stars. Above, however, is a picture of a kilonova, which happens when two really dense objects come together.

This fireball arose after a short-term (1/10 of a second) gamma-ray burst came into view of the Swift space telescope on June 3. Nine days later, the Hubble Space Telescope looked at the same area to see if there were any remnants, and spotted a faint red object that was confirmed in independent observations.

It’s the first time astronomers have been able to see a connection between gamma-ray bursts and kilonovas, although it was predicted before. They’re saying this is the first evidence that short-duration gamma ray bursts arise as two super-dense stellar objects come together.

So what’s the connection? Astronomers suspect it’s this sequence of events:

  • Two binary neutron stars (really dense stars) start to move closer to each other;
  • The system sends out gravitational radiation that make ripples in space-time;
  • These waves make the stars move even closer together;
  • In the milliseconds before the explosion, the two stars “merge into a death spiral that kicks out highly radioactive material,” as NASA states, with material that gets warmer, gets bigger and sends out light;
  • The kilonova occurs with the detonation of a white dwarf. While it’s bright, 1,000 times brighter than a nova, it’s only 1/10th to 1/100th the brightness of an average supernova.
An artistic image of the explosion of a star leading to a gamma-ray burst. (Source: FUW/Tentaris/Maciej Fro?ow)

“This observation finally solves the mystery of the origin of short gamma ray bursts,” stated Nial Tanvir of the University of Leicester in the United Kingdom, who is also the lead author.

“Many astronomers, including our group, have already provided a great deal of evidence that long-duration gamma ray bursts (those lasting more than two seconds) are produced by the collapse of extremely massive stars. But we only had weak circumstantial evidence that short bursts were produced by the merger of compact objects. This result now appears to provide definitive proof supporting that scenario.”

Check out more details on the burst on HubbleSite. The scientific paper associated with these results was published in Nature Aug. 3.

Source: NASA