Our Place in the Galactic Neighborhood Just Got an Upgrade

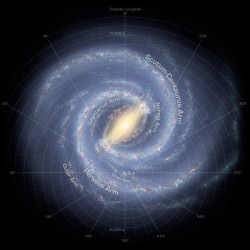
The sun's newly classified neighborhood -- the Local Arm, as shown in this picture -- is more prominent than previously supposed. Credit: Robert Hurt, IPAC; Bill Saxton, NRAO/AUI/NSF

Some cultures used to say the Earth was the center of the Universe. But in a series of “great demotions,” as astronomer Carl Sagan put it in his book Pale Blue Dot, we found out that we are quite far from the center of anything. The Sun holds the prominent center position in the center of the Solar System, but our star is just average-sized, located in a pedestrian starry suburb — a smaller galactic arm, far from the center of the Milky Way Galaxy.

But perhaps our suburb isn’t as quiet or lowly as we thought. A new model examining the Milky Way’s structure says our “Local Arm” of stars is more prominent than we believed.

“We’ve found there is not a lot of difference between our Local Arm and the other prominent arms of the Milky Way, which is in contrast what astronomers thought before,” said researcher Alberto Sanna, of the Max-Planck Institute for Radio Astronomy, speaking today at the American Astronomical Society’s annual meeting in Indianapolis, Indiana.

Sanna said that one of the main questions in astronomy is how the Milky Way would appear to an observer outside our galaxy.

If you imagine the Milky Way as a rippled cookie, our star is in a neighborhood in between two big ripples (the Sagittarius Arm and the Perseus Arm). Before, we thought the Local Arm (or Orion Arm) was just a small spur between the arms. New research using trigonometric parallax measurements, however, suggests the Local Arm could be a “significant branch” of one of those two arms.

In a few words, our stellar neighborhood is a bigger and brighter one than we thought it was.

Astrophoto: Colorado Milky Way by Michael Underwood
Colorado Milky Way. Credit: Michael Underwood

As part of the BeSSeL Survey (Bar and Spiral Structure Legacy Survey) using the Very Long Baseline Array (VLBA), astronomers are able to make more precise measurements of cosmic distances. The VLBA uses a network of 10 telescopes that work together to figure out how far away stars and other objects are.

It’s hard to figure out the distance from the Earth to other stars. Generally, astronomers use a technique called parallax, which measures how much a star moves when we look at it from the Earth.

VLBA telescope locations, courtesy of NRAO/AUI

When our planet is at opposite sites of its orbit — in spring and fall, for example — the apparent location of stellar objects changes slightly.

The more precisely we can measure this change, the better a sense we have of a star’s distance.

The VLBA undertook a search for spots in our galaxy where water and methanol molecules (also known as masers) enhance radio waves — similar to how lasers strengthen light waves. Masers are like stellar lighthouses for radio telescopes, the National Radio Astronomy Observatory stated.

Trigonometric Parallax method determines distance to star or other object by measuring its slight shift in apparent position as seen from opposite ends of Earth's orbit. CREDIT: Bill Saxton, NRAO/AUI/NSF
Trigonometric Parallax method determines distance to star or other object by measuring its slight shift in apparent position as seen from opposite ends of Earth’s orbit. CREDIT: Bill Saxton, NRAO/AUI/NSF

Between 2008 and 2012, the VLBA tracked the distances to (and movements of) several masers to higher precision than previously, leading to the new findings.

Will the findings help ease our “inferiority complex” after all those great demotions?

“I would say yes, that’s a nice conclusion to say we are more important,” Sanna told Universe Today. “But more importantly, we are now mapping the Milky Way and discovering how the Milky Might appear to an outside observer. We now know the Local Arm arm is something that an observer from afar would definitely notice!”

The results will be published in the Astrophysical Journal, (preprint available here) and were presented today (June 3) at the AAS meeting.

Source: National Radio Astronomy Observatory

Smile! This Could Be The Lightest Alien Planet Ever Captured On Camera

Planet HD95086 b is shown at lower left in this picture. Astronomers blocked out the light of the star (center) to image the exoplanet. The blue circle represents the equivalent orbit of Neptune in this star system. Credit: ESO/J. Rameau

We’ve found hundreds of planets outside the solar system, but taking a picture of one is still something quite special. The light of the parent star tends to greatly overwhelm the faint light of the alien planet. (So usually we learn about planets by tracking the effects each planet has on its star, like dimming light when it passes in front or making the star slightly wobble.)

This picture (above) shows HD95086 b, which astronomers believe is one of only about a dozen exoplanets ever imaged. It’s 300 light-years from Earth. The planet candidate is about four to five times the mass of Jupiter and orbiting a very young star that is probably only 10 million to 17 million years old. That’s a baby compared to our own solar system, estimated at 4.5 billion years old.

We still have a lot to learn about this object (and the observations from the Very Large Telescope will need to be confirmed independently), but so far astronomers say they figure that planet formed in the gas and dust surrounding star HD 95086. But the planet is actually very far away from the star now, about twice the distance as the Sun-Neptune orbital span in our own solar system.

The Very Large Telescope (VLT) at ESO's Cerro Paranal observing site.  Located in the Atacama Desert of Chile, the site is over 2600 metres  above sea level, providing incredibly dry, dark viewing conditions. The  VLT is the worldâ??s most advanced optical  instrument, consisting         of four Unit Telescopes with main mirrors 8.2-m in diameter and   four movable 1.8-m diameter Auxiliary        Telescopes. The telescopes  can work together, in groups of two or  three, to form a giant  interferometer, allowing astronomers to see  details up to 25 times  finer than with  the individual telescopes. Credit: European Southern Observatory
The Very Large Telescope (VLT) at ESO’s Cerro Paranal observing site. Credit: European Southern Observatory

“Its current location raises questions about its formation process,” stated team member Anne-Marie Lagrange, who is with the Grenoble Institute of Planetology and Astrophysics in France.

“It either grew by assembling the rocks that form the solid core and then slowly accumulated gas from the environment to form the heavy atmosphere, or started forming from a gaseous clump that arose from gravitational instabilities in the disc.

“Interactions between the planet and the disc itself,” she added, “or with other planets may have also moved the planet from where it was born.”

Astronomers estimate the planet candidate has a surface temperature of 1,292 degrees Fahrenheit (700 degrees Celsius), which could allow water vapor or methane to stick around in the atmosphere. It will take more VLT observations to figure this out, though.

The results from this study will be published in Astrophysical Journal Letters. The paper is also available on prepublishing site Arxiv.

Source: European Southern Observatory

How A New Family Tree of Space Rocks Could Better Protect Earth

An artist's conception of an asteroid collision, which leads to how "families" of these space rocks are made in the belt between Mars and Jupiter. Credit: NASA/JPL-Caltech
An artist's conception of an asteroid collision, in the belt between Mars and Jupiter. Credit: NASA/JPL-Caltech

In perhaps the neatest astronomical application of geneology yet, astronomers found 28 “hidden” families of asteroids that could eventually show them how some rocks get into orbits that skirt the Earth’s path in space.

From scanning millions of snapshots of asteroid heat signatures in the infrared, these groups popped out in an all-sky survey of asteroids undertaken by NASA’s orbiting Wide-Field Infrared Survey Explorer. This survey took place in the belt of asteroids between Mars and Jupiter, where most near-Earth objects (NEOs) come from.

NEOs, to back up for a second, are asteroids and comets that approach Earth’s orbit from within 28 million miles (45 million kilometers). Sometimes, a gravitational push can send a previously unthreatening rock closer to the planet’s direction. The dinosaurs’ extinction roughly 65 million years ago, for example, is widely attributed to a massive rock collision on Earth.

Part of NASA’s job is to keep an eye out for potentially hazardous asteroids and consider approaches to lessen the threat.

Artist concept of the asteroid belt. Credit: NASA
Artist concept of the asteroid belt between Mars and Jupiter. Credit: NASA

There are about 600,000 known asteroids between Mars and Jupiter, and the survey looked at about 120,000 of them. Astronomers then attempted to group some of them into “families”, which are best determined by the mineral composition of an asteroid and how much light it reflects.

While it’s hard to measure reflectivity in visible light — a big, dark asteroid reflects a similar amount of light as a small shiny one — infrared observations are harder to fool. Bigger objects give off more heat.

This allowed astronomers to reclassify some previously studied asteroids (which were previously grouped by their orbits), and come up with 28 new families.

“This will help us trace the NEOs back to their sources and understand how some of them have migrated to orbits hazardous to the Earth,” stated Lindley Johnson, NASA’s program executive for the Near-Earth Object Observation Program.

This diagram illustrates the differences between orbits of a typical near-Earth asteroid (blue) and a potentially hazardous asteroid, or PHA (orange). Image credit: NASA/JPL-Caltech

The astronomers next hope to study these different families to figure out their parent bodies. Astronomers believe that many asteroids we see today broke off from something much larger, most likely through a collision at some point in the past.

While Earthlings will be most interested in how NEOs came from these larger bodies and threaten the planet today, astronomers are also interested in learning how the asteroid belt formed and why the rocks did not coalesce into a planet.

The prevailing theory today says that was due to influences from giant Jupiter’s strong gravity, which to this day pulls many incoming comets and asteroids into different orbits if they swing too close. (Just look at what happened to Shoemaker-Levy 9 in 1994, for example.)

Source: NASA

Black Hole Secrets: Revealing The S-Star

Sgr A Chandra Image Courtesy of NASA/CXC/MIT/F. Baganoff, R. Shcherbakov et al.

Deep in the heart of the Milky Way resides a black hole. However, that is not the mysterious object which scientists Fabio Antonini, of the Canadian Institute for Theoretical Astrophysics, and David Merritt, of the Rochester Institute of Technology, have been endeavoring to explain. The objects of their attention are the orbits of massive young stars which attend it. They are called “S-stars”.

No. That’s not a stutter. S-Stars are a legitimate phenomenon which enable researchers to even more closely examine black hole activity. Their very presence causes astronomers to question what they know. For example, how is it possible for these massive young stars to orbit so close to a region where it would be highly unlikely for them to form there? The sheer force of the strong gravity near a black hole means these stars had to have once been further away from their observed position. However, when theoreticians created models to depict how S-stars might have traveled to their current orbital positions, the numbers simply didn’t match up. How could their orbits be so radically removed from predictions?

Today, Dr. Antonini offered his best explanation of this enigma at the annual meeting of the Canadian Astronomical Society (CASCA). In “The Origin of the S-star Cluster at the Galactic Center,” he gave a unified theory for the origin and dynamics of the S-stars. It hasn’t been an easy task, but Antonini has been able to produce a very viable theory of how these stars were able to get in close proximity to a supermassive black hole in only tens of millions of years since their formation.

“Theories exist for how migration from larger distances has occurred, but have up until now been unable to convincingly explain why the S-stars orbit the galactic center the way they do,” Antonini said. “As main-sequence stars, the S-stars cannot be older than about 100 million years, yet their orbital distribution appears to be ‘relaxed’, contrary to the predictions of models for their origin.”

3-dimensional visualization of the stellar orbits in the Galactic center based on data obtained by the W. M. Keck Telescopes between 1995 and 2012. Stars with the best determined orbits are shown with full ellipses and trails behind each star span ~15-20 years. These stars are color-coded to represent their spectral type: Early-type (young) stars are shown in teal green, late-type (old) stars are shown in orange, and those with unknown spectral type are shown in magenta. Stars without ellipses are from a statistical sample and follow the observed radial distributions for the early (white) or late (yellow/orange) type stars. These stars are embedded in a model representation of the inner Milky Way provided by NCSA/AVL to provide context for the visualization.

According to Antonini and Merritt’s model, S-stars began much further away from the galactic center. Normal? Yep. Normal mode. Then these seemingly normal orbiting stars encountered the black hole’s gravity and began their spiral inward. As they made the inexorable trek, they then encountered the gravity of other stars in the vicinity which then changed the S-stars orbital pattern. It’s a simple insight, and one that verifies how the galactic center evolves from the conjoined influence of a supermassive black holes relativistic effects and the handiwork of gravitational interactions.

“Theoretical modeling of S-star orbits is a means to constrain their origin, to probe the dynamical mechanisms of the region near the galactic center and,” says Merritt, “indirectly to learn about the density and number of unseen objects in this region.”

Although the presence of supermassive black holes at the center of nearly all massive galaxies isn’t a new concept, further research into how they take shape and evolve leads to a better understanding of what we see around them. These regions are deeply connected to the very formation of the galaxy where they exist. With the center of our own galaxy – Sagittarius A – so near to home, it has become the perfect laboratory to observe manifestations such as S-stars. Tracking their orbits over an extended period of time has validated the presence of a supermassive black hole and enlightened our thinking of our own galaxy’s many peculiarities.

Original Story Source: Canadian Astronomical Society Press Release

Black Holes Can Get Really Big, And We Have No Idea Why

Artist’s rendering of the environment around the supermassive black hole at the center of Mrk 231. The broad outflow seen in the Gemini data is shown as the fan-shaped wedge at the top of the accretion disk around the black hole, in side view. A similar outflow is probably present under the disk as well. The total amount of material entrained in the broad flow is at least 400 times the mass of the sun per year. Credit: Gemini Observatory/AURA, artwork by Lynette Cook

Right now, as you read this article, it’s quite possible that the ultra-huge black hole at the center of our galaxy is feasting on asteroids or supercooked gas.

We’ve seen these supermassive black holes in other spots in the universe, too: merging together, for example. They’re huge heavyweights, typically ranging between hundreds of thousands to billions of times the mass of the Sun. But we also know, paradoxically, that mini supermassive black holes exist.

So while we’ve observed the gravitational effects of these monsters, a University of Alberta researcher today (May 30) is going to outline the big question: how the heck some of them got so massive. For now, no one knows for sure, but scientists are naturally taking a stab at trying to figure this out.

Maybe they were your ordinary stellar black holes, just three to 100 times the mass of the sun, that underwent a growth spurt. There’s a sticking point with that theory, though:  “To do this, the black holes would have to gorge excessively, at rates that require new physics,” stated the Canadian Astronomical Society.

Illustration of Cygnus X-1, another stellar-mass black hole located 6070 ly away. (NASA/CXC/M.Weiss)
Illustration of Cygnus X-1, a stellar-mass black hole located 6070 ly away. (NASA/CXC/M.Weiss)

“We might also expect to see some black holes that are intermediate in mass between stellar-mass and supermassive black holes in our nearby universe,” the society added, “like a band that is consistently releasing albums, but never making it truly big.”

Anyway, Jeanette Gladstone (a postdoctoral researcher) will make a presentation at CASCA’s annual meeting in Vancouver today outlining some ideas. Gladstone, by the way, focuses on X-rays (from black holes) in her work. Here’s what she said on her research page:

HLX-1 in the periphery of the edge-on spiral galaxy ESO 243-49. Credit: Heidi Sagerud.

“I am currently trying to understand a strange group of curiously bright X-ray binaries. These ultraluminous X-ray sources emit too much X-ray radiation to be explained by standard accretion [of] only a regular stellar mass black hole,” she wrote.

“So I use various parts of the electromagnetic spectrum to try and understand what makes them appear so bright. More recently I have started looking at the very brightest of these sources, a group of objects that have recently become a class in their own right. These are the hyperluminous X-ray sources.”

For context, here’s more info on a hyperluminous X-ray source (and its black hole) in spiral galaxy ESO 234-9, as studied by the Hubble Space Telescope and the Swift X-Ray Telescope.

Astronomers were pretty excited with this 2012 work: “For the first time, we have evidence on the environment, and thus the origin, of this middle-weight black hole,” said Mathieu Servillat, a member of the Harvard-Smithsonian Center for Astrophysics research team, at the time.

Credit: CASCA

Why Are Dying Stars in 47 Tucanae Cooling Off So Slowly?

White Dwarf Star
White Dwarf Star

The Hubble Space Telescope is going to be used to settle an argument. It’s a conflict between computer models and what astronomers are seeing in a group of stars in 47 Tucanae.

White dwarfs — the dying embers of stars who have burnt off all their fuel — are cooling off slower than expected in this southern globular cluster, according to previous observations with the telescope’s Wide Field Camera and Advanced Camera for Surveys.

Puzzled astronomers are now going to widen that search in 47 Tucanae (which initially focused on a few hundred objects) to 5,000 white dwarfs. They do have some theories as to what might be happening, though.

White dwarfs, stated lead astronomer Ryan Goldsbury from the University of British Columbia, have several factors that chip in to the cooling rate:

The Hubble Space Telescope. Image credit: NASA, tweaked by D. Majaess.

– High-energy particle production from the white dwarfs;

– What their cores are made up of;

– What their atmospheres are made up of;

– Processes that bring energy from the core to the surface.

Somewhere, somehow, perhaps one of those factors is off.

This kind of thing is common in science, as astronomers create these programs according to the best educated guesses they can make with respect to the data in front of them. When the two sides don’t jive, they do more observations to refine the model.

“The cause of this difference is not yet understood, but it is clear that there is a discrepancy between the data and the models,” stated the Canadian Astronomical Society (CASCA) and the University of British Columbia in a press release.

Since the white dwarfs are in a cluster that presumably formed from the same cloud of gas, it allows astronomers to look at a group of stars at a similar distance and to determine the distribution of masses of stars within the cluster.

“Because all of the white dwarfs in their study come from a single well-studied star cluster, both of these bits of information can be independently determined,” the release added.

You can read the entire article on the previous Hubble research on 47 Tucanae at the Astrophysical Journal.

Today’s announcement took place during the annual meeting of CASCA, which is held this year in Vancouver.

Source: CASCA/UBC

Suddenly Slowing Star Could Give Hints Of Its Interior

Artist's conception of a neutron star flare. Credit: University of California Santa Cruz

Why would a spinning star suddenly slow down? Even after writing a scientific paper about the phenomenon, astronomers still appear to be in shock-and-awe mode about what they saw.

“I looked at the data and was shocked — the … star had suddenly slowed down,” stated Rob Archibald, a graduate student at McGill University in Montreal. “These stars are not supposed to behave this way.”

Archibald led a group that was observing a neutron star, a type of really, really dense object created after huge stars run out of gas and collapse. The studied star (called 1E 2259+586, if you’re curious) has a massive magnetic field that places it in a subcategory of neutron stars called magnetars.

Anyway, the astronomers were watching over the magnetar with the NASA Swift X-ray telescope, just to get a sense of the star’s rotation and also to keep an eye out for the odd X-ray explosion commonly seen in stars of this type. But to see its spin rate reduce — that was definitely something unexpected.

An artistic impression of a magnetar with a very complicated magnetic field at its interior and a simple small dipolar field outside. Credits: ESA - Author: Christophe Carreau
An artistic impression of a magnetar with a very complicated magnetic field at its interior and a simple small dipolar field outside. Credits: ESA – Author: Christophe Carreau

Previous neutron star observations have showed them suddenly rotating faster (as if spinning up to several hundred times a second wasn’t enough.) This maneuver is called a glitch, and is thought to happen because the neutron has some sort of fluid (sometimes called a “superfluid”) inside that drives the rotation.

So now, the astronomers had evidence of an “anti-glitch”, a star slowing down instead of speeding up. It wasn’t by much (just a third of a part per million in the seven-second rotation rate), but while it happened they also saw X-rays substantially increase from the magnetar. Astronomers believe that something major happened either inside, or near the surface of the star.

The magnetic field surrounding the mysterious magnetar (NASA)
The magnetic field surrounding a magnetar (NASA)

And, astronomers added, if they can figure out what is happening, it could shed some light on what exactly is going on in that dense interior. Maybe the fluid is rotating at different rates, or something else is going on.

“Such behaviour is not predicted by models of neutron star spin-down and, if of internal origin, is suggestive of differential rotation in the magnetar, supporting the need for a rethinking of glitch theory for all neutron stars,” read a paper on the results.

The work was released today (May 29) at the Canadian Astronomical Society (CASCA)’s annual meeting, held this year in Vancouver.

You can read the entire paper in Nature.

Credit: CASCA/McGill University

An Amazing Deep-Field View of Centaurus A

The Centaurus A Extreme Deep Field. (Image Courtesy of Astrophotography byRolf Oslen. Used with Permision).

Sometimes, you just have to say “Wow!”

The view you’re looking at above is of Centaurus A (NGC 5128), a galaxy about 10-16 million light years distant in the southern hemisphere sky. It’s a favorite of astrophotographers and professional observatories alike.

But what makes this image so special is that it was taken by an amateur astrophotographer.

To construct this amazing image, New Zealand-based astrophotographer Rolf Wahl Olsen exposed the field of view for 120 hours over 43 nights spanning February to May of this year.

Rolf recently shared his motivation to construct this image;

“Over the past few months I have been on a mission to achieve a long time dream of mine: taking a deep sky image with more than 100 hours of exposure.”

Rolf also noted that the stars in the frame are visible down to magnitude +25.45, which “appears to go deeper than the recent ESO release” and believes that it may well be “the deepest view ever obtained of Centaurus A,” As well as “the deepest image ever taken with amateur equipment.”

Not only is the beauty and splendor of the galaxy revealed in this stunning mosaic, but you can see the variations in the populations of stars in the massive regions undergoing an outburst of star formation.

One can also see the numerous globular clusters flocking around the galaxy, as well as the optical counterparts to the radio lobes and the faint trace of the relativistic jets. The extended halo of the outer shell of stars is also visible, along with numerous foreground stars visible in the star rich region of Centaurus.

Finally, we see the dusty lane bisecting the core of this massive galaxy as seen from our Earthly vantage point.

To our knowledge, many of these features have never been captured visually by backyard observers before, much less imaged. Congrats to Rolf Wahl Olsen on a spectacular capture and sharing his view of the universe with us!

Read more on the Centaurus A deep field on Google+.

-Check out the comparison images of the Centaurus A deep field showing the relativistic jet (!) background galaxies and clusters.

-Explore more of Rolf’s outstanding work at his website.

Early Galaxies Churned Out Stars Like Crazy

The Southern Cross, the Milky Way, and the Large Magellanic Cloud shine above the Atacama Large Millimeter/submillimeter Array (ALMA) as it observes on a clear night sky during its Early Science phase. Image credit: C. Padilla, NRAO/AUI/NSF

Talk about an assembly line! Some early-stage galaxies created stars thousands of times faster than our Milky Way does today, according to new research. And it’s puzzling astronomers.

“We want to understand how and why these galaxies are forming stars at such incredibly fast rates, so soon after the Big Bang,” stated Scott Chapman of Dalhousie University, one of the researchers behind the discovery. “This could partially answer how our own galaxy, the Milky Way, was born billions of years ago.”

This is just a hint of the high-definition view we’ll receive from Chile’s Atacama Large Millimeter/submillimeter Array (ALMA), its astronomers promise, since the array of dozens of telescopes was officially inaugurated this spring. (ALMA has been working for years, but slowly adding telescopes and definition as it goes.)

There were actually three papers released today about ALMA. So what did the observatory find out this time? Here’s the nut graf:

Gravitational microlensing method requires that you have two stars that lie on a straight line in relation to us here on Earth. Then the light from the background star is amplified by the gravity of the foreground star, which thus acts as a magnifying glass.

The observed galaxies are “gravitationally lensed”. Galaxies are so massive that they can bend light from other galaxies, if put in the right spot with respect to Earth. We’ve seen this effect over and over again with the Hubble Space Telescope, but observations are less well-known in the millimeter spectrum of light in which ALMA observes. “Models of lens geometries in the sample indicate that the background objects are ultra-luminous infrared galaxies, powered by extreme bursts of star formation,” stated a Nature paper on the discovery.

These galaxies are further away than we thought. By measuring the time it takes light from carbon monoxide molecules to reach us, the astronomers concluded these galaxies are much further away than previously measured, with some reaching as far back as 12 billion light-years away. (That’s just 1.7 billion years after the Big Bang created the universe.)

– The galaxies put star creation on fast-forward. Looking back that far is like looking in a time machine — we can see things that were happening only 1 billion years after the Big Bang. At the time, those galaxies were as bright as 40 trillion suns and created new stars at an extreme rate of 4,000 suns per year. (That, by the way, is 4,000 times faster than what our own galaxy does.)

You can read more about these results in Nature and the Astrophysical Journal (here and here.)

Source: Canadian Astronomical Society (CASCA)

How to Spot Near-Earth Asteroid 1998 QE2 This Week

1998 QE2 on closest approach to Earth this Friday on May 31st. (Credit: NASA/JPL-Caltech).

A large asteroid visits our fair corner of the solar system this week, and with a little planning you may just be able to spot it.

Near Earth Asteroid (NEA) 285263 (1998 QE2) will pass 5.8 million kilometres from the Earth on Friday, May 31st at 20:59 Universal Time (UT) or 4:59PM EDT. Discovered in 1998 during the LIncoln Near-Earth Asteroid Research (LINEAR) sky survey looking for such objects, 1998 QE2 will shine at magnitude +10 to +12 on closest approach. Estimates of its size vary from 1.3 to 2.9 kilometres, with observations by the Spitzer Space Telescope in 2010 placing the ballpark figure towards the high end of the scale at 2.7 kilometres in diameter.

1998 QE2 would fit nicely with room to spare in Oregon’s 8 kilometre-wide Crater Lake.

Though this passage is over 15 times as distant as the Earth’s Moon, the relative size of this space rock makes it of interest. This is the closest approach of 1998 QE2 for this century, and there are plans to study it with both the Arecibo and Goldstone radio telescopes to get a better description of its size and rotation as it sails by. Expect to see radar maps of 1998 QE2 by this weekend.

“Asteroid 1998 QE2 will be an outstanding radar imaging target… we expect to obtain a series of high-resolution images that could reveal a wealth of surface features,” said astronomer and principal JPL investigator Lance Benner.

A recent animation of 1998 QE2 from earlier this month. (Credit: Nick Howes & Ernesto Guido).
A recent animation of 1998 QE2 from earlier this month.
(Credit: Nick Howes & Ernesto Guido).

An Amor-class asteroid, 1998 QE2 has an orbit of 3.77 years that takes it from the asteroid belt between Mars and Jupiter to just exterior of the Earth’s orbit. 1998 QE2 currently comes back around to our vicinity roughly every 15 years, completing about 4 orbits as it does so. Its perihelion exterior to our own makes it no threat to the Earth. This week’s passage is the closest for 1998 QE2 until a slightly closer pass on 0.038 Astronomical Units on May 27th, 2221. Note that on both years, the Earth is just over a month from aphelion (its farthest point from the Sun) which falls in early July.

Of course, the “QE2” designation has resulted in the inevitable comparisons to the size of the asteroid in relation to the Queen Elizabeth II cruise liner. Asteroid designations are derived from the sequence in which they were discovered in a given year. 1998 QE2 was the 55th asteroid discovered in the period running from August 1st to 16th 1998.

Perhaps we could start measuring asteroids in new and creative units, such as “Death Stars” or “Battlestars?”

But the good news is, you can search for 1998 QE2 starting tonight. The asteroid is currently at +12th magnitude in the constellation Centaurus and will be cruising through Hydra on its way north into Libra Friday on May 31st. You’ll need a telescope to track the asteroid as it will never top +10th magnitude, which is the general threshold for binocular viewing under dark skies. Its relative southern declination at closest approach means that 1998 QE2 will be best observed from northern latitudes of +35° southward. The farther south you are, the higher it will be placed in the sky after dusk.

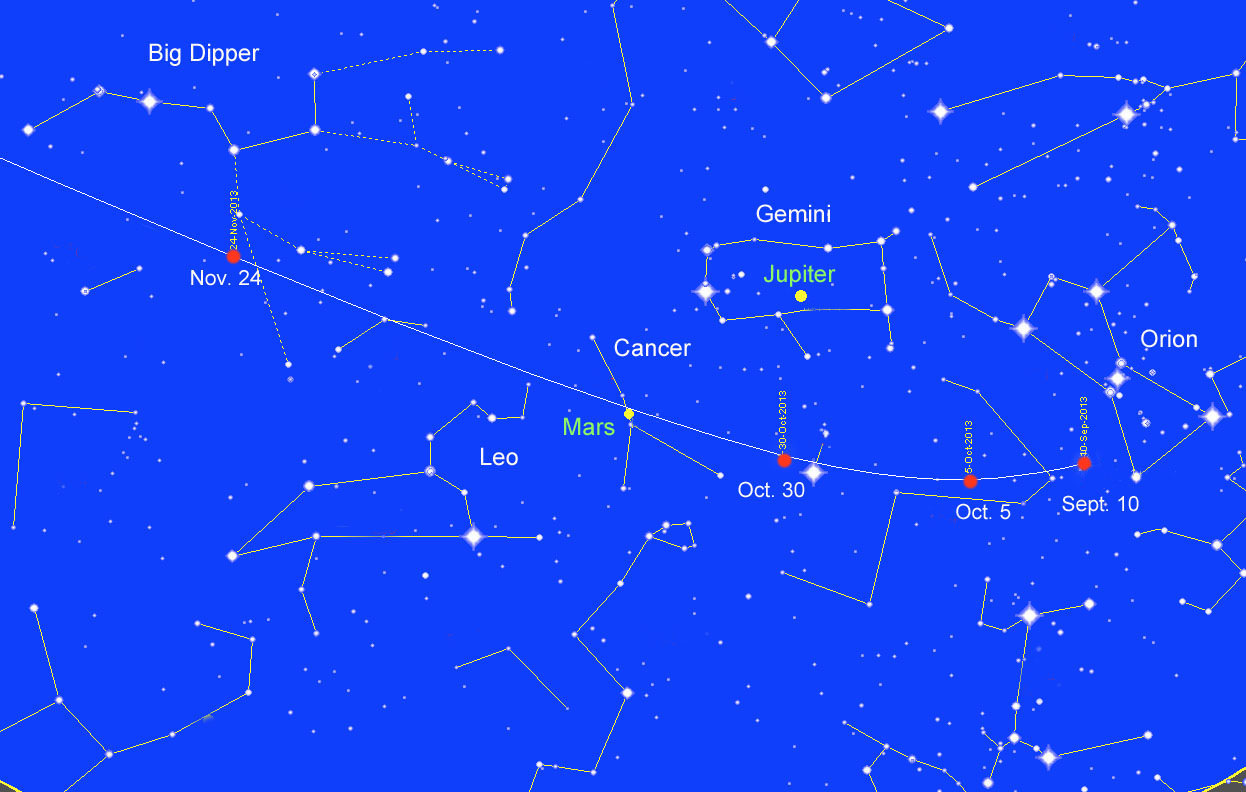
A wide field view of the passage of 1998 QE2 this week, from May 27th through June 2nd. (Created by the author in Starry Night).

Still, if you can spot the constellation Libra, it’s worth a try. Many observers in the southern U.S. fail to realize that southern hemisphere sites like Omega Centauri in the constellation Centaurus are visible in the evening low to the south at this time of year. Libra sits on the meridian at local midnight due south for northern hemisphere observers, making it a good time to try for the tiny asteroid.

Visually, 1998 QE2 will look like a tiny, star-like point in the eye-piece of a telescope. Use low power and sketch or photograph the field of view and compare the positions of objects about 10 minutes apart. Has anything moved? We caught sight of asteroid 4179 Toutatis last year using this method.

A closeup look at the passage of 1998 QE2, covering a 48 hour span centered on closest approach on May 31st. (Created by the author in Starry Night).

1998 QE2 will also pass near some interesting objects that will serve as good “guideposts” to track its progress.

We find the asteroid about 5° north of the bright +2.5 magnitude star Iota Centauri on the night of May 28th. It then crosses the border into the constellation Hydra about 6° south of the +3 magnitude star Gamma Hydrae (Star Trek fans will recall that this star lies in the Neutral Zone) on May 29th. Keep a careful eye on 1998 QE2 as it passes within 30’ (about the diameter of a Full Moon) of the +8th magnitude galaxy Messier 83 centered on May 28th at 19:00 UT/3:00 PM EDT. This will provide a fine opportunity to construct a stop-motion animated .gif of the asteroid passing by the galaxy.

Another good opportunity to pinpoint the asteroid comes on the night on Thursday, May 30th as it passes within 30’ of the +3.3 magnitude star Pi  Hydrae.

From there, it’s on to closest approach day. 1998 QE2 crosses into the constellation Libra early on Friday May 31st. The Moon will be at Last Quarter phase and won’t rise until well past local midnight, aiding in your quest.

At its closest approach, 1998 QE2 have an apparent motion of about 1 angular degree every 3 hours, or about 2/3rds the diameter of a Full Moon every hour. This isn’t quite fast enough to see in real time like asteroid 2012 DA14 was earlier this year, but you should notice its motion after about 10 minutes at medium power. Passing at ~465 Earth diameters distant, 1998 QE2 will show a maximum parallax displacement of just a little over 7 arc minutes at closest approach.

For telescopes equipped with setting circles, knowing the asteroid’s precise position is crucial. This allows you to aim at a fixed position just ahead of its path and “ambush” it as it drifts by. For the most precise positions in right ascension and declination, be sure to check out JPL’s ephemeris generator for 1998 QE2.

After its closest passage, 1998 QE2 will pass between the +3.3 & +2.7 magnitude stars Brachium (Sigma Librae) and Zubenelgenubi (Alpha Librae) around 4:00 UT on June 1st. Dedicated observers can continue to follow its northeastward trek into early June.

Slooh will also be carrying the passage of 1998 QE2 on Friday, May 31st starting at 5:00 PM EDT/21:00 UT.

Of course, the hypothetical impact of a space rock the size of 1998 QE2 would spell a very bad day for the Earth. The Chicxulub impact basin off of the Yucatán Peninsula was formed by a 10 kilometre impactor about 4 times larger than 1998 QE2 about 65 million years ago. We can be thankful that 1998 QE2 isn’t headed our way as we watch it drift silently by this week. Hey, unlike the dinosaurs, WE have a space program…   perhaps, to paraphrase science fiction author Larry Niven, we can hear the asteroid whisper as we track its progress across the night sky, asking humanity “How’s that space program coming along?”