How Much Light Has The Universe Created Since the Big Bang?

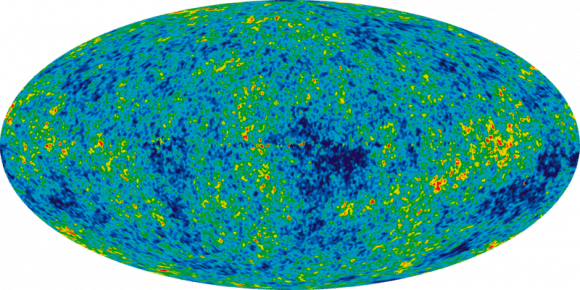
This all-sky Fermi view includes only sources with energies greater than 10 GeV. From some of these sources, Fermi's LAT detects only one gamma-ray photon every four months. Brighter colors indicate brighter gamma-ray sources. Credit: NASA/DOE/Fermi LAT Collaboration

The universe, most cosmologists tell us, began with a bang. At some point, the lights turned on. How much light has the universe produced since it was born, 13.8 billion years ago?

It seems a difficult answer at first glance. Turn on a light bulb, turn it off and the photons appear to vanish. In space, however, we can track them down. Every light particle ever radiated by galaxies and stars is still travelling, which is why we can peer so far back in time with our telescopes.

A new paper in the Astrophysical Journal explores the nature of this extragalactic background light, or EBL. Measuring the EBL, the team states, “is as fundamental to cosmology as measuring the heat radiation left over from the Big Bang (the cosmic microwave background) at radio wavelengths.”

Turns out that several NASA spacecraft have helped us understand the answer. They peered at the universe in every wavelength of light, ranging from long radio waves to short, energy-filled gamma rays. While their work doesn’t go back to the origin of the universe, it does give good measurements for the last five billion years or so. (About the age of the solar system, coincidentally.)

Artist's conception of how gamma rays (dashed lines) bump against photons of electromagnetic background light, producing electrons and positrons. Credit: Nina McCurdy and Joel R. Primack/UC-HiPACC; Blazar: Frame from a conceptual animation of 3C 120 created by Wolfgang Steffen/UNAM
Artist’s conception of how gamma rays (dashed lines) bump against photons of electromagnetic background light, producing electrons and positrons. Credit: Nina McCurdy and Joel R. Primack/UC-HiPACC; Blazar: Frame from a conceptual animation of 3C 120 created by Wolfgang Steffen/UNAM

It’s hard to see this faint background light against the powerful glow of stars and galaxies today, about as hard as it is to see the Milky Way from downtown Manhattan, the astronomers said.

The solution involves gamma rays and blazars, which are huge black holes in the heart of a galaxy that produce jets of material that point towards Earth. Just like a flashlight.

These blazars emit gamma rays, but not all of them reach Earth. Some, astronomers said, “strike a hapless EBL photon along the way.”

When this happens, the gamma ray and photon each zap out and produce a negatively charged electron and a positively charged positron.

More interestingly, blazars produce gamma rays at slightly different energies, which are in turn stopped by EBL photons at different energies themselves.

So, by figuring out how many gamma rays with different energies are stopped by the photons, we can see how many EBL photons are between us and the distant blazars.

Scientists have now just announced they could see how the EBL changed over time. Peering further back in the universe, as we said earlier, serves as a sort of time machine. So, the further back we see the gamma rays zap out, the better we can map out the EBL’s changes in earlier eras.

The Fermi Gamma-ray Space Telescope (formerly called GLAST).  Credit: NASA
The Fermi Gamma-ray Space Telescope (formerly called GLAST). Credit: NASA

To get technical, this is how the astronomers did it:

– Compared the gamma-ray findings of the Fermi Gamma-ray Space Telescope to the intensity of X-rays measured by several X-ray observatories, including the Chandra X-Ray Observatory, the Swift Gamma-Ray Burst Mission, the Rossi X-ray Timing Explorer, and XMM/Newton. This let astronomers figure out what the blazars’ brightnesses were at different energies.

– Comparing those measurements to those taken by special telscopes on the ground that can look at the actual “gamma-ray flux” Earth receives from those blazars. (Gamma rays are annihilated in our atmosphere and produce a shower of subatomic particles, sort of like a “sonic boom”, called Cherenkov radiation.)

The measurements we have in this paper are about as far back as we can see right now, the astronomers added.

“Five billion years ago is the maximum distance we are able to probe with our current technology,” stated the paper’s lead author, Alberto Dominguez.

“Sure, there are blazars farther away, but we are not able to detect them because the high-energy gamma rays they are emitting are too attenuated by EBL when they get to us—so weakened that our instruments are not sensitive enough to detect them.”

Source: University of California High-Performance AstroComputing Center

Rocky Alien Planets: What The Heck Is On Their Surfaces?

NASA's Kepler mission confirmed the discovery of its first rocky planet, named Kepler-10b. Measuring 1.4 times the size of Earth, it is the smallest planet ever discovered outside our solar system.

We don’t have the budget yet to send Star Trek‘s U.S.S. Enterprise to probe the surface of strange new worlds, but luckily for humanity, astronomers are figuring out techniques to do that without even needing to leave Earth.

One of Earth’s prolific planet-hunters, the Kepler Space Telescope, has found a lot of planet candidates with rocky surfaces. That’s exciting for astronomers, as rocky planets tend to be smaller than their gas giant counterparts. Also, learning more about rocky planets could give us more clues as to Earth’s history, and that of other planets in our solar system.

But how the heck, from so far away, can we begin to understand the surface? One idea: Check the heat signature, or in more scientific words, look at exoplanets in the infrared part of the light spectrum.

The visible colors, infrared, radio, X-rays and gamma rays are all forms of light and comprise the electromagnetic spectrum. Here you can compare their wavelengths with familiar objects and see how their frequencies (bottom numbers) increase with decreasing wavelength. Credit: ESA

NASA’s Astrobiology Magazine recently published an article about this method, which we encourage you to check out. In summary, the team behind a new research paper (submitted to the Astrophysical Journal) proposes to check out “airless” exoplanets that have surface temperatures below 3,140 degrees Fahrenheit (1,726 Celsius or 2,000 Kelvin.)

Because different kinds of rocks emit “signature” spectrums in different wavelengths, it’s possible we could pick up the signs of silicate rocks or other types of material. There’s a caveat, though.

“With current technology, however, the team cautions that determining surface composition of exoplanets is a very different process than studying their solar system counterparts,” the magazine wrote. “Due to the limits of technology, the team proposes to concentrate on the most prominent mineral signatures detected from exoplanets.”

Check out more details in the scientific journal article here, or the entire Astrobiology Magazine article at this link.

Famed Pair of Stars Closer To Earth Than We Imagined

An artist's conception of the SS Cygni system, with a red dwarf star's material being pulled on to a nearby white dwarf. Credit: Bill Saxton, NRAO/AUI/NSF

If you’re a semi-serious amateur astronomer, chances are you’ve heard of a variable pair of stars called SS Cygni. When you watch the system for long enough, you’re rewarded with a brightness outburst that then fades away and then returns, regularly, over and over again.

Turns out this bright pair is even closer to us than we imagined — 370 light-years away, to be precise.

Before we get into how this was discovered, a bit of background on what SS Cygni is. As the name of the system implies, it’s in the constellation of Cygnus (the Swan). The pair consists of a cooling white dwarf star that is locked in a 6.6-hour orbit with a red dwarf.

The white dwarf’s gravity, which is much stronger than that of the red dwarf, is bleeding material from its neighbor. This interaction causes outbursts — on average, about once every 50 days.

Previously, the Hubble Space Telescope put the distance to these stars much further away, at 520 light-years. But that caused some head-scratching among astronomers.

Hubble Against Earth's Horizon (1997)
Hubble Against Earth’s Horizon (1997)

“That was a problem. At that distance, SS Cygni would have been the brightest dwarf nova in the sky, and should have had enough mass moving through its disk to remain stable without any outbursts,” stated James Miller-Jones, of the Curtin University node of the International Centre for Radio Astronomy Research in Perth, Australia.

Astronomers call SS Cygni a dwarf nova. When comparing it to similar systems, astronomers said the outbursts happen as matter changes its flow speed through the disc of material surrounding the white dwarf.

“At high rates of mass transfer from the red dwarf, the rotating disk remains stable, but when the rate is lower, the disk can become unstable and undergo an outburst,” stated the National Radio Astronomy Observatory. So what was happening?

A star's distance is measured by observing a slight shift in position that occurs, from Earth's perspective, on opposite sides of our planet's orbit. Credit: Bill Saxton, NRAO/AUI/NSF
A star’s distance is measured by observing a slight shift in position that occurs, from Earth’s perspective, on opposite sides of our planet’s orbit. Credit: Bill Saxton, NRAO/AUI/NSF

To again look at the distance of the star, astronomers used two sets of radio telescopes, the Very Large Baseline Array and the European VLBI Network. Each set has a bunch of telescopes working together as an interferometer, allowing for precise measurements of star distances.

Scientists then took measurements at opposite ends of the Earth’s orbit, using the planet itself as a tool. By measuring the star’s distance at opposite sides of the orbit, we can calculate its parallax or apparent movement in the sky from the perspective of Earth. It’s an old astronomical tool used to pin down distances, and still works.

“This is one of the best-studied systems of its type, but according to our understanding of how these things work, it should not have been having outbursts. The new distance measurement brings it into line with the standard explanation,” stated Miller-Jones.

And where did Hubble go wrong? Here’s the theory:

“The radio observations were made against a background of objects far beyond our own Milky Way Galaxy, while the Hubble observations used stars within our galaxy as reference points,” NRAO stated. “The more-distant objects provide a better, more stable, reference.”

The results were published in Science on May 24.

Source: National Radio Astronomy Observatory

Book Review: “Space Chronicles: Facing the Ultimate Frontier” by Neil de Grasse Tyson

For those fans of Carl Sagan’s Pale Blue Dot, there’s finally a successor volume to that.

Neil deGrasse Tyson’s Space Chronicles: Facing The Ultimate Frontier, at times, reads like an updated version of Sagan’s classic book about the history of astronomy and our place in the universe. Like Sagan, Tyson talks about the human perception of astronomy over the years, starting from our belief that everything centered around us and then gradually graduating to the more nuanced perception of the universe that we have today.

Find out how you can win a copy of this book here!

The book is an anthology of interviews, magazine articles and other writings of Tyson, who is currently the director of the Hayden Planetarium at the American Museum of Natural History in New York. His eloquence helps carry the reader through difficult concepts: “Engineering technology replaces muscle energy with machine energy”, he writes in part of the Industrial Revolution. In another part of the book, “Risks cancellations and failures are just part of the game” comes during an explanation of how some astronomical missions die before receiving funding from Congress.

Collecting his writings as an anthology, however, leads to some frustration for the reader who wants to read the book from the front to the back. Though Tyson awes with his knowledge of astronomy, popular culture and history, he sometimes uses the same anecdotes across different essays. There are at least three references concerning gas stations across the universe, for example, and he refers to the same John F. Kennedy speech (albeit different passages, for the most part) a few times as well.

The book is also aimed squarely at an American audience. The appendices are full of useful information on NASA, particularly its budget as it relates to government activities. Additionally, Space Chronicles opens with a new essay concerning NASA funding over the years and how it relates to American presidencies in a sort of echo of Spaceflight and the Myth of Presidential Leadership.

Tyson argues that space is non-partisan and that it takes more than a strong leader to move the program forward. Tyson criticizes NASA for de-emphasizing science in some of its past budgets. He refers to the controversy of Obama’s cancellation of George W. Bush’s 2004 vision for space exploration, and says one great weakness of NASA’s work is that it is continually handed mandates by new presidents with little follow-up on the grand ideas.

Through the book, Tyson talks about his ideas for NASA, mentioning initiatives such as asteroid tracking as high priorities. He also refers to the space committees he has been on and the people he has spoken to, and his efforts to bring space to children to encourage their participation in science, education, technology and mathematics.

Perhaps his most powerful essay comes at the end of the book. Tyson acknowledges the nature of his work sometimes makes him forget about Earthly problems: “When I pause and reflect on our expanding universe … sometimes I forget that uncounted people walk this Earth without food or shelter, and that children are disproportionately represented among them.”

That dilemma may never disappear, but Tyson’s book — at the least — provides powerful words for exploring the universe.

The Birth of a Saros – This Weekend’s Hidden Eclipse

(Photo by Author)

As the first eclipse season of 2013 comes to an end this weekend, an extremely subtle lunar eclipse occurs on the night of Friday, May 24th going into the morning of Saturday, May 25th. And we do mean subtle, as in invisible to the naked eye… this eclipse only lasts 34 minutes in duration and less than 2% of the disk of the Moon enters the bright outer penumbra of the Earth’s shadow!

So, why talk about such a non-event at all?

Great things come from such humble beginnings. And while this weekend’s eclipse is one mostly for the almanacs and astronomical tables rather than a true observational event, it also marks the start of a new lunar saros cycle.

This weekend’s eclipse is one of five for 2013, a year which contains two solars and three lunars. This eclipse marks the end of the first “eclipse season” of the year, a time when the intersection of the Moon’s orbit (known as nodes) and the ecliptic nearly coincide with the position of the Sun (for a solar eclipse at New Moon) and the Earth’s shadow (for a lunar eclipse at Full Moon).

The current season began with a very slight partial eclipse on April 25th, followed by an annular eclipse on May 10th. It will last only 33 minutes and 45 seconds in duration starting at 03:53:11 UTC on May 25th. The Moon will be high over the Americas at the time, but again, shading on the southern limb of the Moon will be too slight to be seen.

Curiously, SLOOH will be providing live coverage of the eclipse, although again, it will be too slight to see.

Starry Night
The Full Moon just nicks the Earth’s penumbra in the early morning hours of May 25th. (Created by the author in Starry Night).

What is a saros? A saros is a period of 18 years 11 days and 8 hours after which an eclipse cycle lines up, producing a similar eclipse to the one that preceded it 18 years before. Note that due to its 8 hour offset, the Earth will have rotated 120° and the visibility region will have shifted westward.

In said period, three lunar cycles very nearly line up;

The Anomalistic month (the period the Moon takes to go from one perigee to another) = 27.555 days.

The Draconic month (the period the Moon takes to return to the same node) = 27.212 days.

The Synodic month (the most familiar one, the period between similar phases) = 29.531 days.

Note that:

239 Anomalistic months = 239×27.555= 6585.645 days.

242 Draconic months = 242×27.212=6585.304 days.

223 Synodic months = 223×29.531=6585.413 days.

There’s that mis-alignment of a third of a day again (8 hours) for every 18 years and 11 days. This also causes the node of each eclipse in the cycle to drift eastward by 0.5° along the ecliptic. Thus, each eclipse isn’t exactly the same. A lunar saros series starts with a very brief penumbral like this weekend’s, becomes deeper and deeper every 18+ year period until partial and total eclipses begin centuries down the road. Thereafter, the cycle reverses, until a final faint penumbral marks the end of the lunar saros.

diagram
The progression of selected eclipses of the same saros cycle. (Credit: Matthew Zimmerman. Wikimedia Commons graphic in the Public Domain).

After this weekend’s eclipse, the next start of a lunar saros won’t occur until November 8th 2060 with the start of saros 156. The last new saros series (number 149) began on June 13th, 1984.

There are numbered saros series for both lunar and solar eclipses. There are currently 41 saroses (the plural of saros) active with the inclusion of this weekend’s start of lunar saros 150.

Saros 150, of which this eclipse is the 1st of 71, will last for just over 1,262 years. It will begin to produce partial eclipses on August 20th, 2157 and produce its 1st total on its 32nd lunar eclipse on April 29th, 2572.

It amazes me that ancient cultures such as the Chaldeans new of saros cycles and could predict eclipses. Being geographically isolated, lunar eclipse cycles would have been easier to decipher than solar ones, as you only have to be on the Moonward facing hemisphere of the Earth to witness the eclipse. They may well have stumbled upon the saros while attempting to calculate a slightly longer 19 year period known as a Metonic cycle to align ancient luni-solar calendars.

And yes, that 8 hour offset also means that after a triple saros period, lunar and solar eclipses of the same saros series do return to roughly the same longitude every 54 years & 34 days. This is known as an exeligmos, and if you get this on a triple-word score in Scrabble, you can safely retire from the game.

NASA
The theoretical visibility circumstances for this week’s penumbral eclipse. (Credit: F. Espenak/NASA/GSFC).

And while this eclipse is more of academic than observational interest, you can always enjoy the light of a brilliant Full Moon. The May Full Moon is referred to as the Flower, Milk, and Corn Planting Moon by the Algonquian Indians of North America, alluding the latent season of Spring.

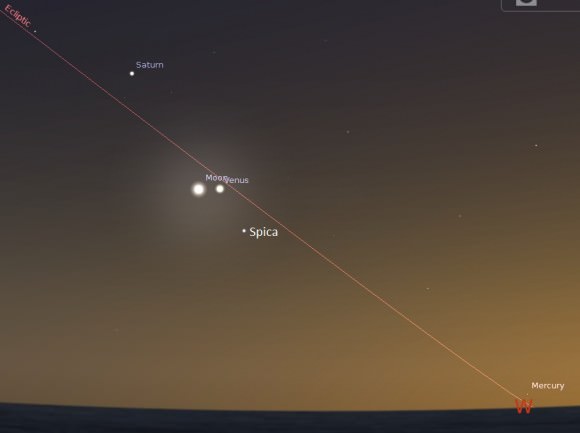
Also, keep an eye out for several conjunctions and occultations this week by the Moon with bright stars and planets.

The first up is the bright star Spica (Alpha Virginis) which gets occulted by the waxing gibbous Moon around ~11:00 UT on Wednesday, May 22nd for viewers across northern Australia, southern Asia and the South Pacific. Spica is one of four stars brighter than magnitude +1.5 that the Moon can occult, the others being Antares, Aldebaran and Regulus. This is the 6th occultation in a cycle of 13 of Spica by the Moon spanning 2013.

The planet Saturn will lie about 4° north of the waxing gibbous Moon on the following evening of May 23rd.

Also, watch for an occultation of the +2.6th magnitude star Beta Scorpii on the evening of May 24th around the time of the lunar eclipse. This will be a difficult one, as the Moon will be near 100% illumination. Conjunction of the Moon and Beta Scorpii in right ascension occurs at 3:04 UT on May 25th, about 2.5 hours after Full. The occultation will span the southeastern US, Caribbean, northern South America and western Africa.

Created by Author
Visibility path of the occultation of Beta Scorpii by the Moon. (Credit: Occult 4.1.0.2).

2013 isn’t a grand year for eclipses. We’ve got two more in the late season of the year, another slightly deeper penumbral on October 18th and a hybrid solar eclipse on November 3rd. And when, may you ask, will we FINALLY have another total lunar eclipse? Stick around ‘til U.S. Tax Day next year (April 15th 2014) for a total lunar eclipse spanning the Americas!


Seeing the Red of ‘La Superba,’ a Magnificent Springtime Carbon Star

Finder chart for La Superba. (Photo by Author).

The Universe can be a very gray place. But this week, we’ll look at a fine example of a class of objects that defies this trend.

Many first time stargazers are surprised when the Trifid or the Orion Nebula fails to exhibit the bright splashy colors seen in Hubble photos. The fault lies not with the Universe, but in our very own eyes.

This is because the light sensitive fovea of our eye has two different types of photoreceptor cells; rods and cones. These act like slow and fast speed film (for those of us old enough to remember actual film!) Under low light conditions, objects have a very black-and-white appearance. It’s only with an increase in brightness that the color receptors in the cone cells of our eye begin to kick in.

One class of stars can induce this effect. They’re known as carbon stars.

A fine example of just such an object rides high in the late spring sky for northern hemisphere observers. This is the variable star Y Canum Venaticorum, also abbreviated as Y CVn or “La Superba” (The magnificent). This name was given to the star by Father Angelo Secchi in the mid-19th century. It is one of the reddest stars in the sky.

Astronomers gauge the “redness” of a star by measuring its magnitude contrast through a blue and visible (green peaking) filters. This is what is known as its B-V index, and the higher the value, the redder the star.

La Superba has a B-V value of +2.5. For contrast, the familiar orange-red stars Antares and Betelgeuse have a B-V value of +1.83 & +1.85, respectively.

Some other classic carbon stars and their B-V values are;

TX Piscium: +2.5

Herschel’s Garnet Star: +2.35

V Hydrae: +4.5

R Leporis (Hind’s Crimson Star): +2.7

Many of these are also variable stars, and they can appear redder visually near their minimum brightness. In the case of La Superba, it ranges from magnitude +4.8 to +6.3 over a span of 160 days, with a longer super-imposed cycle of about 6 years. We’re just coming off of a peak cycle in late May 2013, and La Superba is easy to spot with binoculars about a third of the way between the brilliant double star Cor Caroli (visited by the Enterprise in the Star Trek: The Next Generation Episode “Allegiance”) and Delta Ursa Majoris.

I’ve shown off carbon stars such as La Superba and Hind’s Crimson Star at public star parties to great effect. They can be an excellent star party “secret weapon” when every other ‘scope down the line is aimed at the Orion nebula.

For a faint constellation, Canes Venatici has lots to offer. One of the best globular clusters in the sky M3 can be found within its borders, as can a handful of decent galaxies. La Superba lies in a rather empty region of the constellation high above the galactic plane. In fact, an area about 15° degrees north of location in the adjoining constellation Ursa Major was picked for the famous Hubble Deep Field image for this very reason.

Burnham’s Celestial Handbook describes La Superba as “one of the reddest of all the naked eye stars, (with) a truly odd and vivid tint in large telescopes.” Astronomer Agnes Clerke described its appearance in 1905 as an “extraordinary vivacity of prismatic rays, separated into dazzling zones of red, yellow, and green by broad spaces of profound obscurity.”  (Note: the “spaces” referred to gaps in its spectra).

Through the telescope at low power, we see La Superba as an orange-red ember with shades of white. It’s an easy catch with binoculars, and one of the very few carbon stars that is visible to the naked eye under dark skies. We’d judge that only TX Piscium rivals it in brightness, and only V Hydrae and Hinds appear ruddier. I always like to ask first time observers of colored stars what they see… human eye-brain perception can vary greatly!

The coordinates of La Superba are:

Right Ascension: 12 Hours 45’ 08”

Declination: +45 26’ 25”

La Superba is about 600-800 light years distant. Physically, it is a massive star at three times the mass of our Sun. It’s also a monster in terms of diameter, at four astronomical units in size.  If you placed it within our solar system, it would swallow up the orbits of the interior planets out to Mars!

La Superba is thus much less dense than our own Sun, and at a surface temperature of about 2,800K, relatively cool. It is also the brightest “J-type” carbon star in the sky, a rare sub-type characterized by the presence of the isotope carbon-13 in its atmosphere.  A carbon star is a sun near the end of its life, accumulating carbon compounds in its outer atmosphere as it fuses heavier elements in one last “hurrah” before shedding its outer layers and forming a white dwarf embedded inside a planetary nebula. Carbon stars are much brighter in the infrared, and we see the very tail end of this absorption in the visible red end of the spectrum. In fact, La Superba is a full 9 magnitudes (nearly 4,000 times) brighter in the near-infrared than in the ultraviolet!

All amazing facts to ponder as we view a star near the end of its career, seeding the cosmos with the very element that makes life possible. Next time you’re out observing, be sure to go “into the red” and check out the fine carbon star!


An Awesome Annular Eclipse! Images and Videos from Earth and Space

@Beyond_Beneath Geoff Sims Plutonic Gold Mine, Australia

A spectacular annular eclipse of the Sun was witnessed across Australia and the southern Pacific region early today. Morning dawned mostly clear across the Australian continent, and those who journeyed out to meet the antumbra of the Moon as the Sun rose across the Great Sandy Desert and the Cape York Peninsula were not disappointed. The rest of us watched worldwide on as Slooh and a scattering of other ad-hoc broadcasts delivered the celestial event to us via the web.

This was a challenging one. Although partial phases of the eclipse was visible across the entirety of Australia, Hawaii, and as far north as the Philippines and as far south as New Zealand, the track of annularity passed over some very remote locales. Stable Internet connections were scarce, and many photos and videos are still trickling in as die-hard eclipse chasers return “from the Bush.”

One lucky witness to the eclipse was Druce Horton (Xylopia on flickr) who caught the eclipse from Kuranda, Australia just north of Cairns. “It was completely clouded over here in Kuranda and I didn’t even bother going to a place where I could get a clear view.” Druce told Universe Today. “I then noticed the sky lightening a little and I rushed out with the camera and desperately tried to set an appropriate exposure and frame it while avoiding getting an eyeful of sunlight and/or a tree branch in the way.”

As seen by Druce Horton near Kurunda, Australia.
A rising crescent eclipse as seen by Druce Horton near Kurunda, Australia. (Credit and Copyright: Druce Horton. Used with Permission).

As pointed out the us by Michael Zeiler (@EclipseMaps) earlier this week, the town of Newman and surrounding regions in Western Australia were a great place to witness the rising annular eclipse. Geoffrey Sims ventured out and did just that:

eclipse...
The rising annular eclipse. (Credit: Geoff Sims).

Note how the atmospheric haze is distorting the solar annulus into a flattened ring… pure magic! Mr. Sims got some truly stunning pictures of the eclipse, and was one of the first to manage to get them out onto the Internet, though he stated on Twitter that it “will likely take weeks to sort through the images!”

All get reasons to keep a close eye on Mr. Sims’ Facebook page

Mr. Joerg Schoppmeyer also ventured about 70 kilometres south of Newman to catch the rising “Ring of Fire”:

Annularity just moments after internal contact of the antumbra. Credit:
Annularity just moments after internal contact of the antumbra. Credit: Joerg Schoppmeyer).

We also mentioned earlier this week how you can use the “strainer effect” to create a flock of crescent Suns during a partial solar eclipse.

Amanda Bauer (@astropixie) of Sydney, Australia did just this to create her name in “eclipse pacmans”:

eclipse
An Astropixie Eclipse… (Credit: Amanda Bauer).

And speaking of which, eclipse crescents can turn up in the most bizarre of places, such as a lens flare caught by a webcam based at the Canberra Deep Space Network:

Credit: NASA
A lens flare eclipse. (Credit: CDSCC/NASA).

Trevor Sellman (@tsellman) based in northern Melbourne preferred to catch sight of the partial phase of the eclipse “the old fashioned way,” via a simple pinhole projection onto a white sheet of paper:

Pinhole
A pinhole eclipse. (Credit: Trevor Sellman).

In addition to Slooh, the Mead West Vaco Observatory in conjunction with the Columbus State University’s Coca-Cola Space Science Center provided an excellent webcast of the full phases of the eclipse, and in multiple wavelengths to boot:

CCSS
The solar annulus as seen near mid-eclipse in hydrogen alpha. (Credit: the CCSSC).

And they also provided a view in Calcium-K:

Screen cap in Cal-K
A screen capture of the final stage of the eclipse as seen in Cal-K. (Credit: the CCSSC).

But Earth bound-observers weren’t the only ones on hand to witness this eclipse. Roskosmos also released a video animation of the antumba of the Moon crossing the Earth as seen from the Elektro-L satellite:

“These images interest Russian space enthusiasts because we asked  Roskosmos to optimize (the) work of satellite for best pictures of eclipse,” Vitaliy Egorov told Universe Today.

There’s no word as of yet if the NASA/JAXA spacecraft Hinode or if ESA’s Proba-2 caught the eclipse, although they were positioned to take advantage of the opportunity.

There were also some active sunspot regions on the Earthward face of the Sun, as captured by Monty Leventhal in this outstanding white-light filtered image:

Eclipse

Another fine video animation of the eclipse turned up courtesy of Steve Swayne of Maleny in Queensland, Australia;

And finally, Vanessa Hill caught the partial stage of the eclipse while observing from the CSIRO Astrophysics & Space Sciences viewing event:

eclipse
A partially eclipsed Sun. (Credit: @nessyhill).

Partial stages of the eclipse were also captured by Carey Johnson (@TheTelescopeGuy) from Hawaii and can be viewed on his flickr page.

If this eclipse left you jonesin’ for more, there’s a hybrid solar eclipse across the Atlantic and central Africa on November 3rd 2013. Maximum totality for this eclipse is 1 minute and 40 seconds. Unfortunately, after two solar eclipses in 6 months, another total solar eclipse doesn’t grace the Australian continent until July 22nd, 2028!

But such are the ways of the cosmos and celestial mechanics… hey, be glad we occupy a position in space and time where solar eclipses can occur.

Thanks to all who sent in photos… if you’ve got a picture of today’s eclipse, an anecdote, or just a tale of triumph and/or eclipse chasing tribulations drop us a line & share those pics up to the Universe Today flickr group. See you next syzygy, and may all your eclipse paths be clear!


This Diagram is Better than 183,487 Images

Hertzsprung-Russell Diagram. Credit: ESO.

When it comes to immediate and widespread appeal, astronomical diagrams have it tough. There’s a reason we have Most Awesome Space Images of 2012, but not “Astronomy’s coolest diagrams 2012.” But arguably, diagrams (more concretely: plots that help us visualize one or more physical quantities) are the key to understanding what’s up with all those objects whose colorful images we know and love.

To be sure, some diagrams have become quite famous. Take the Hubble diagram plotting galaxies’ redshifts against their distances: Its earliest version marks the discovery that we live in an expanding universe. A more recent incarnation, which shows how cosmic expansion is accelerating, won its creators the 2011 Nobel prize in physics.

Another famous diagram is the Hertzsprung-Russell diagram (HR diagram, for short, shown above.) A single star doesn’t tell you all that much about stars in general. But if you plot the brightnesses and colors of many stars, patterns begin to emerge – such as the distinctive broad band of the “main sequence” bisecting the HR diagram diagonally, the realm of the giants and supergiants to its upper right and the White Dwarfs below on the left.

When astronomers first recognized those patterns, they took the first steps towards our modern understanding of how stars evolve over time.

The first HR diagram was published by the US astronomer Henry Norris Russell in 1913 (or at least described in words, if you look at the article); Hubble’s first diagram in 1929. Off the top of my head, I cannot think of any famous astronomical plot with more recent roots.

But that doesn’t mean there aren’t some plots that by rights should be famous. Here’s my rendition of what, back in 2003, must have been one of the first comprehensive examples of its kind (from this article by Blanton et al. 2003). The diagram shows the colors of many different galaxies, and how frequently or less frequently one encounters galaxies with those particular colors:

fig1a

If you’re not familiar with this type of plot, it’s best to think of the vertical lines as dividing the diagram into bins – think “glass cylinders you can put stuff in.” Next, obtain a sample of images of distant galaxies. Here are some that I retrieved with the Skyserver Tool kindly provided by the folks who produced the Sloan Digital Sky Survey (SDSS) — a huge survey that, in its latest data release, lists more than 1.4 million galaxies:

Galaxies from the Sloan Digital Sky Survey.

If these images are less detailed than what you’re used to, it’s because the galaxies are very far away even by extragalactic standards — their light takes almost 1.3 billion years to reach us. Even so, you can readily distinguish the galaxies’ different colors.

With that information, back to our (glass) bins. Think of the differently colored galaxies as differently colored marbles. Each bin accepts galaxies of one particular shade of color – so put each marble into the appropriate bin! As you do, some of the bins will fill up more, some less. The colored bars indicate each bin’s filling level. On the scale to the left, you can read off the corresponding numbers. For instance, the best-filled bin contains a little more than 5 percent of all the galaxy-marbles.

Now that you know how to read the diagram, let’s remove the extra vertical lines. In a paper published in an astronomical research journal, this is what a “histogram” of this kind would look like:

Galaxy distribution by color. Credit: Markus Pössel

I’ve left the coloring in even though you’d probably not find it in an astronomical paper. The astronomers’ own measure of color, denoted “g-r” on the horizontal axis, is a bit technical — let’s ignore those details and stick with the colors we see in the diagram.

To fill the bins in this particular diagram, the astronomers from the SDSS collaboration sorted 183,487 galaxies from their survey by color.

So what does the diagram tell us? Evidently, there are two peaks: one near the bluish end on the left, one near the reddish end on the right. That indicates two distinct types of galaxies. Galaxies of the first kind are, on average, of a bluish-white color, with some specimens a little more and some a little less blue (which is why the peak is a little broad). Galaxies of the other kind are, on average, much redder.

A galaxy’s color derives from its stars. A bluish galaxy is one with bluish stars. Bluish stars are hotter than reddish ones. (Think of heating metal: It starts out a dull red, becomes orange, then white-hot; if you could make metal even hotter, it would radiate bluish.) Hot stars are more massive than cooler stars, and they live fast and die young — the most massive ones die after much less than a million years, a fleeting moment compared with our Sun’s estimated lifetime of ten billion years. For a galaxy to glow an overall blue, it must have a steady supply of these short-lived bluish stars, producing new blue stars in sufficient quantities as the old ones burn out. So evidently, the galaxies of the bluish kind are continually producing new bluish stars. Since there is no known mechanism that makes a galaxy produce only bluish stars, we can drop the qualifier: these galaxies are continually producing new stars.

The reddish galaxies, on the other hand, produce hardly any new stars. If they did, then by all we know about star formation there should be sufficient bluish stars around to give these galaxies an overall bluish tint. Without any new stars, all that is left are long-lived, less massive stars, and those tend to be cooler and more reddish.

The existence of two distinct classes of galaxies — star-forming vs. “red and dead” — is a driving force behind current research on galaxy evolution in much the same way the HR diagram was for stellar evolution. Why are there two distinct kinds? What makes the bluish galaxies produce stars, and what prevents the reddish ones? Do galaxies move from one camp to the other over time? And if yes, how and in which direction? When you read an article like this about the care and feeding of teenage galaxies, or this one about galaxies recycling their gas, it’s all about astronomers trying to find pieces of the puzzle of why there are these two populations.

This diagram clearly deserves wider public recognition. And no doubt there are many other, equally under-appreciated astronomical plots. Please help me give them some of the recognition they deserve: Which diagrams have done the most to increase your understanding of what’s out there? Which have surprised you? Which have sent a thrill down your spine? Please post a link or a description, and let’s see if we can create a “Top 10” list of astronomical diagrams. And who knows: We might even try for an “Astronomy’s coolest diagrams 2013” at the end of the year.

__________________________________________

Additional information about how the two-peak galaxy diagram was made, including different versions for download and the python script that produced it, can be found here. If you do want to know about the technical details about the color: The values on the x axis correspond to g-r, where g is the star’s brightness (expressed in the usual astronomical magnitude system) through one particular greenish filter and r the brightness through one particular reddish filter. Details about the ugriz filter system used can be found on this SDSS page. And in case you’re worrying about the effect cosmic redshift might have had on the galaxies in the sample: the astronomers took care to compensate for that particular effect, correcting the colors to appear as they would if each of the galaxies were so far away that its light would take 1.29 billion years to reach us (that is, at a cosmic redshift of z=0.1).

Many thanks to Kate H.R. Rubin for pointing me to the galaxy diagram and for helpful discussions.

Amateur Astronomer Catches Record Setting Gamma-Ray Burst

Vigilance and a little luck paid off recently for an amateur astronomer.

On April 27th, 2013 a long lasting gamma-ray burst was recorded in the northeastern section of the constellation Leo. As reported here on Universe Today, the burst was the most energetic ever seen, peaking at about 94 billion electron volts as seen by Fermi’s Large Area Telescope. In addition to Fermi’s Gamma Ray Burst Monitor, the Swift satellite and a battery of ground based instruments also managed to quickly swing into action and record the burst as it was underway.

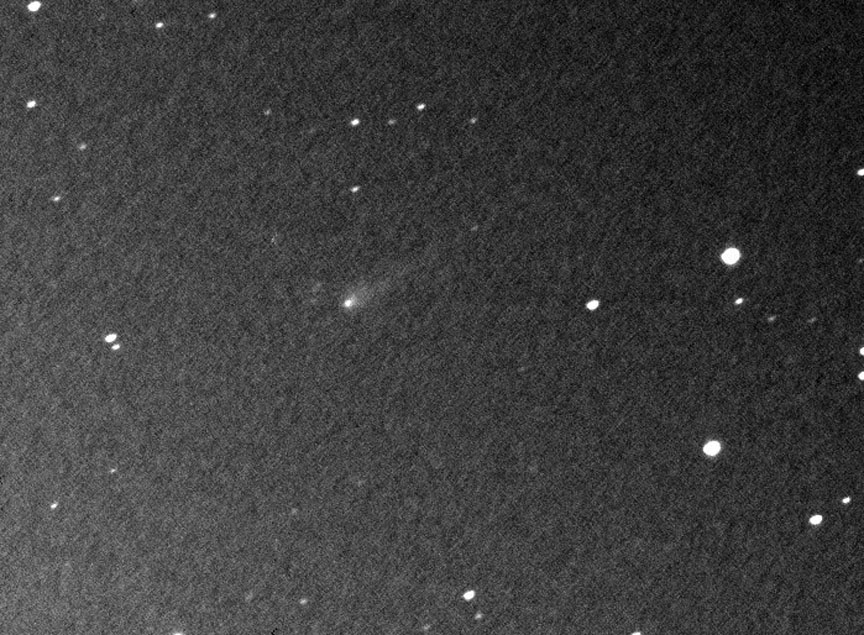
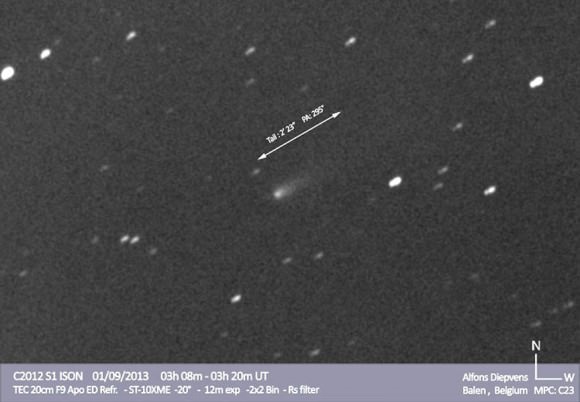
Patrick Wiggins' capture of the optical counterpart to GRB 130427A with extrapolated light curve. Note that the Moon was just two days past Full in the direction of the constellation Libra at the time, hence the sky glow! (Credit: Patrick Wiggins).
Patrick Wiggins’ capture of the optical counterpart to GRB 130427A with extrapolated light curve. Note that the Moon was just two days past Full in the direction of the constellation Libra at the time, hence the sky glow! (Credit: Patrick Wiggins).

But professionals weren’t the only ones to capture the event. Amateur astronomer Patrick Wiggins was awake at the time, doing routine observations from his observatory based near Toole, Utah when the alert message arrived. He quickly swung his C-14 telescope  into action at the coordinates of the burst at 11 Hours 32’ and 33” Right Ascension and +27° 41’ 56” declination.

Wiggins then began taking a series of 60-second exposures with his SBIG ST-10XME imager and immediately found something amiss. A 13th magnitude star had appeared in the field. At first, Wiggins believed this was simply too bright to be a gamma-ray burst transient, but he continued to image the field into the morning of April 27th.

Wiggins had indeed caught his optical prey, the very first gamma-ray burst he’d captured. And what a burst it was. At only 3.6 billion light years distant, GRB 130427A (gamma-ray bursts are named after the year-month-day of discovery) was one for the record books, and in the top five percent of the closest bursts ever observed.

Mr. Wiggins further elaborated the fascinating story of the observation to Universe Today:

“I was imaging an area near where the burst occurred and received an email GCN Circular and a GCN/SWIFT Notice of the event within minutes of it happening.  As bad luck would have it I was in the kitchen fixing a late night snack when both arrived so I was about 10 minutes late reading them.

I figured that 10 minutes was way too late as these things typically only last a minute or two but I slewed to the coordinates indicated in the notices and shot a quick picture.  There was a bright “something” in the middle of the frame as shown here with the POSS comparison image:”

POSS comparison image of the field of GRB 130427A. (Credit: Partick Wiggins).

But I thought it looked way too bright for a GRB so I moved the telescope slightly (to see if the object was a ghost or an artifact in the system) and shot again but it was still there.

A quick check of the POSS showed nothing should be there so I started shooting pictures at five minute intervals until dawn and it was those images I used to put together the light curve:”

Expanded light curve of GRB 130427A. (Credit: Patrick Wiggins).

Amazingly, the RAPTOR (RAPid Telescopes for Optical Response) array recorded a peak brightness in optical wavelengths of magnitude +7.4 just less than a minute before the Swift spacecraft swung into action. This is just below the dark sky limiting naked-eye magnitude of +6. This is also just below the record optical brightness set by GRB 080319B, which briefly reached magnitude +5.3 back in 2008.

RAPTOR-K & RAPTOR-T based at the Fenton Hill Observatory in New Mexico. (Credit: NNSA/Los Alamos National Laboratory/Dept. of Energy).

RAPTOR is run by the Los Alamos National Laboratory and is based at Fenton Hill Observatory in the Jemez Mountains of New Mexico 56 kilometres west of Los Alamos.

The Catalina Real-Time Transient Survey based outside of Tucson Arizona also detected the burst independently, giving it the designation CSS130502: 113233+274156. The burst occurred less than a degree from the +13th magnitude galaxy NGC 3713, and the galaxy SDSS J113232.84+274155.4 is also very close to the observed position of the burst.

Mr. Wiggins’ observation also raises an intriguing possibility. Did anyone catch a surreptitious image of the burst? Anyone wide-field imaging right around the three-way junction of the constellations Ursa Major, Leo & Leo Minor at the correct time might just have caught GRB 130427A in the act. Make sure to review those images!

Follow up observations of gamma-ray bursts are just one of the ways that amateur backyard observers continue to contribute to the science of astronomy. Observers such as Mr. Wiggins and James McGaha based at the Grasslands Observatory near Sonita, Arizona routinely swing their equipment into action chasing after optical transients as alert messages for gamma-ray events are received.

Gamma-ray bursts where first discovered in 1967 by the Vela spacecraft designed to monitor nuclear weapons testing during the Cold War. They come in two varieties: short period and long duration bursts. Short period bursts of less than two seconds duration are thought to occur when a binary pulsar pair merges, while long duration bursts such as GRB 130427A occur when a massive red giant star undergoes a core collapse and shoots a high energy jet directly along its poles in a hypernova explosion. If the burst is aimed in our direction, we get to see the event. Thankfully, no possible progenitors of a long duration gamma-ray burst lie aimed at us in our galaxy, though the Wolf-Rayet stars Eta Carinae and WR 104 both about 8,000 light years distant are worth keeping an eye on. Luckily, neither of these massive stars is known to have rotational poles tipped in our general direction.

Scary stuff to consider as we hunt for the next “Big One” in the night sky. In the meantime, we’ve got much to learn from gamma-ray bursts such as GRB 130427A. Congrats to Mr. Wiggins on his first gamma-ray burst observation… the event was made all the more special by the fact that it occurred on his birthday!

-Mr Patrick Wiggins is NASA/JPL Ambassador to the state of Utah.

– Read the American Association of Variable Star Observers (AAVSO) report of the light curve of GRB 130427A as reported by Mr. Wiggins here.

– NASA’s Goddard Space Flight Center maintains a clearing house of the latest GRB alerts in near-real-time here.

– You can also now receive GRB alerts via @Gammaraybursts on Twitter, as well as follow NASA’s Swift and Fermi missions.

– And of course, “there’s an App for that” in the world of GRB alerts in the form of the free Swift Explorer App for the Iphone.

Milky Way’s Black Hole Munches On Supercooked Gas

Artist's concept of a supermassive black hole at the center of a galaxy. Credit: NASA/JPL-Caltech

It’s a simple menu, but smoking hot. The black hole at the center of the Milky Way galaxy is sucking in ultra-hot molecular gas, as seen through the eyes of the Herschel space telescope.

“The biggest surprise was quite how hot the molecular gas in the innermost central region of the galaxy gets. At least some of it is around 1000ºC [1832º F], much hotter than typical interstellar clouds, which are usually only a few tens of degrees above the –273ºC [-460ºF] of absolute zero,” stated the European Space Agency.

Herschel, which is out of coolant and winding down its scientific operations, will continue producing results in the next few years as scientists crunch the results. The telescope has found a bunch of basic molecules in the Milky Way that include water vapour and carbon monoxide, and has been engaged in looking to learn more about the gas that surrounds the massive black hole at our galaxy’s center.

In a region called Sagittarius* (Sgr A*), this huge black hole — four million times the mass of the sun — is thankfully a safe distance from Earth. It’s 26,000 light years away from the solar system.

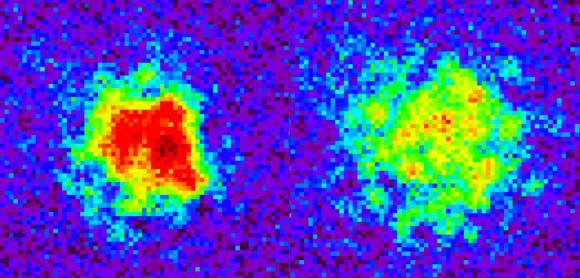
At left, ionized gas in the galaxy as seen in radio wavelengths; at right, the spectrum at the center seen by Herschel. Credit: Radio-wavelength image: National Radio Astronomy Observatory/Very Large Array (courtesy of C. Lang); spectrum: ESA/Herschel/PACS & SPIRE/J.R. Goicoechea et al. (2013).

Trouble is, there’s a heckuva lot of dust blocking our view to the center of the galaxy. Herschel got around that problem by taking pictures in the far-infrared, seeking heat signatures that can bely intense activity in and around the black hole.

“Herschel has resolved the far-infrared emission within just 1 light-year of the black hole, making it possible for the first time at these wavelengths to separate emission due to the central cavity from that of the surrounding dense molecular disc,” stated Javier Goicoechea of the Centro de Astrobiología, Spain, lead author of a paper reporting the results.

The science team supposes that there are strong shocks within the gas (which is magnetized) that help turn up the heat. The shocks could occur when gas clouds butt up against each other, or material shoots out Fast and Furious-style between stars and protostars (young stars.)

“The observations are also consistent with streamers of hot gas speeding towards Sgr A*, falling towards the very center of the galaxy,” stated Goicoechea. “Our galaxy’s black hole may be cooking its dinner right in front of Herschel’s eyes.”

Source: ESA