
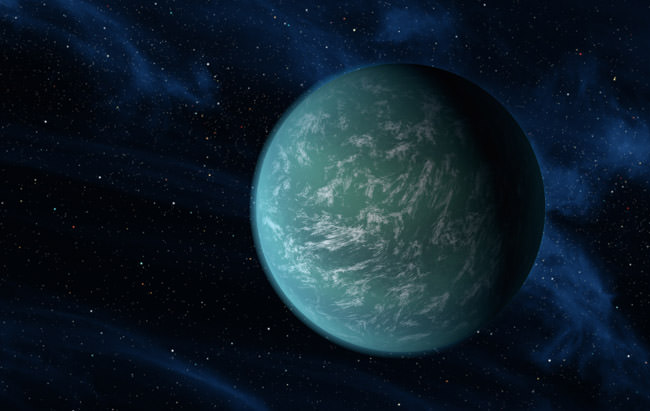
A simple, yet elegant method of measuring the surface gravity of a star has just been discovered. These computations are important because they reveal stellar physical properties and evolutionary state – and that’s not all. The technique works equally well for estimating the size of hundreds of exoplanets. Developed by a team of astronomers and headed by Vanderbilt Professor of Physics and Astronomy, Keivan Stassun, this new technique measures a star’s “flicker”. Continue reading “Flicker… A Bright New Method of Measuring Stellar Surface Gravity”
Earthlings Wave at Saturn as Cassini Images Us

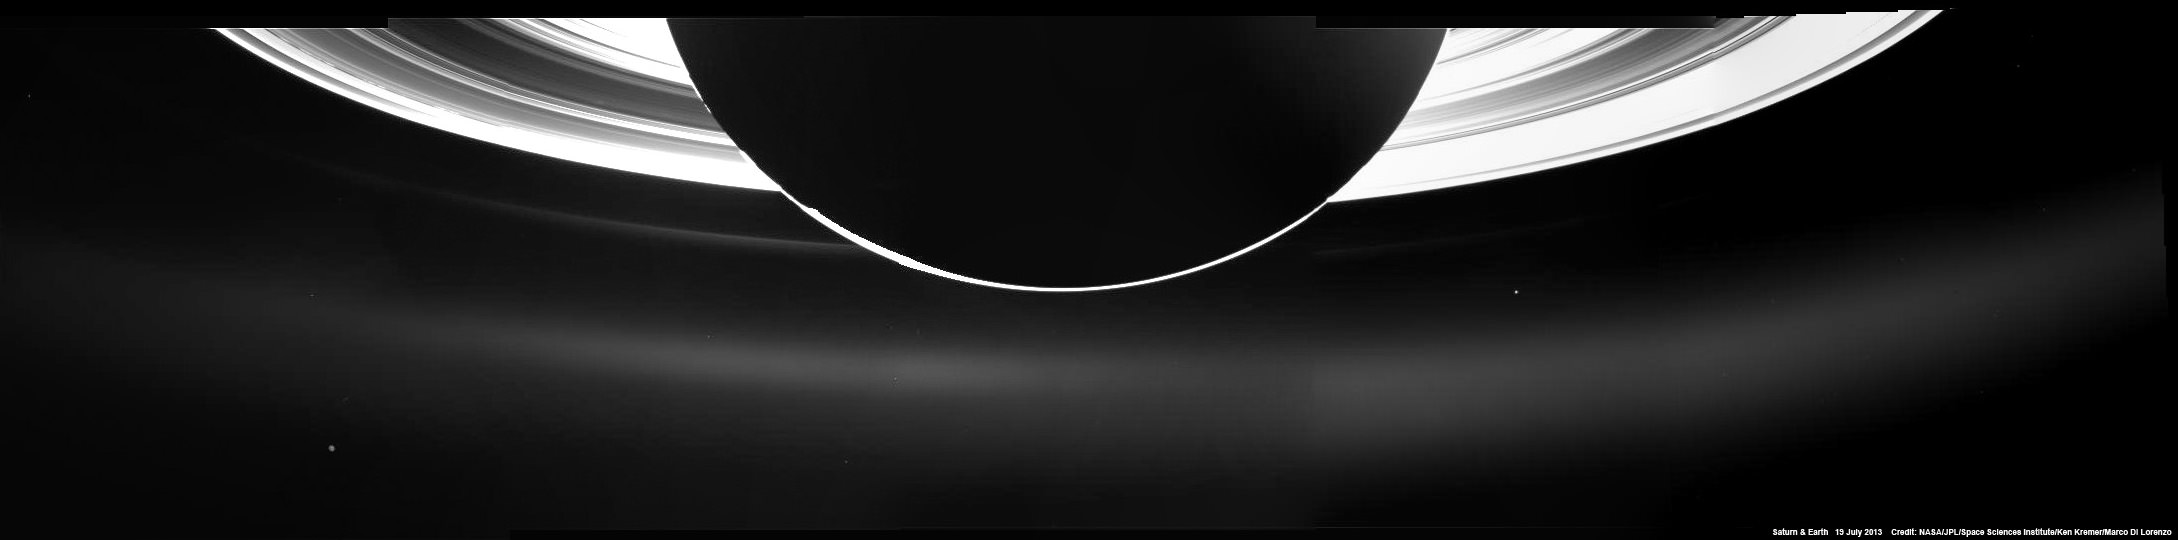
Earth Waves at Saturn and Cassini on July 19, 2013
From more than 40 countries and 30 U.S. states, people around the world shared more than 1,400 images of themselves as part of the Wave at Saturn event organized by NASA’s Cassini mission on July 19, 2013. The Cassini team created this image collage as a tribute to the people of Earth
Credit: NASA/JPL-Caltech/People of Earth
See link below to the absolutely gigantic full resolution version [/caption]
On July 19, millions of Earthlings worldwide participated in NASA’s ‘Wave at Saturn’ campaign as the NASA Cassini Saturn orbiter turned about and imaged all of us.
Earthlings from 40 countries and 30 U.S. states heeded NASA’s call to photograph themselves while smiling and waving at Saturn and Cassini across 1 billion miles of interplanetary space and shared over 1400 images.
The results of all those images has now been assembled into a fabulous collage in the shape of our planet and released today (Aug. 21) by NASA and the Cassini team as a tribute to the People of Earth.
“Did you wave at Saturn and send us your photo? Then here’s looking at you!” NASA announced on the Cassini Facebook page.
This event was the first time that the citizens of Earth knew in advance that a distant interplanetary spacecraft was photographing portraits of our home planet and our Moon. NASA invited everyone to participate.
Photos flooded into NASA via Twitter, Facebook, Flickr, Instagram, Google+ and email.
Click here for the full resolution version. But be forewarned – it weighs in at over 26 MB and it’s far too big to post here.
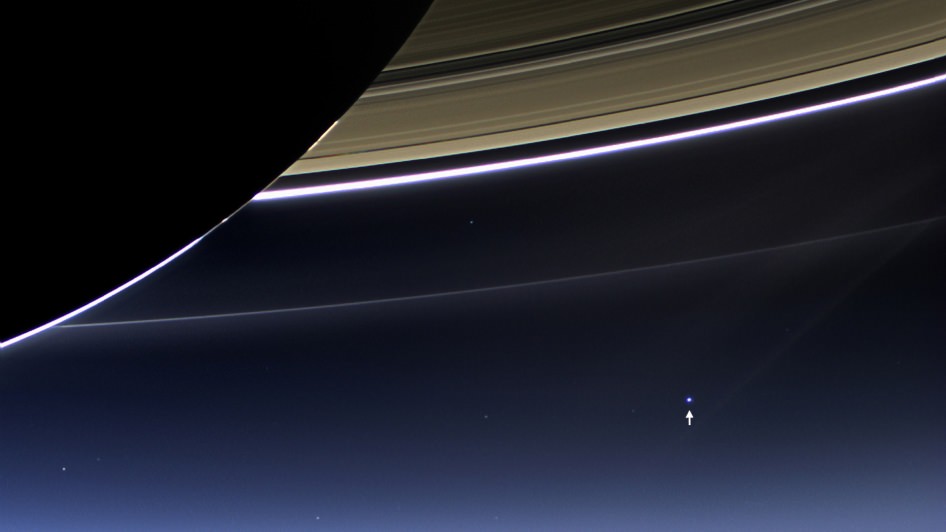
In this rare image taken on July 19, 2013, the wide-angle camera on NASA’s Cassini spacecraft has captured Saturn’s rings and our planet Earth and its moon in the same frame. Image Credit: NASA/JPL-Caltech/Space Science Institute
“Thanks to all of you, near and far, old and young, who joined the Cassini mission in marking the first time inhabitants of Earth had advance notice that our picture was being taken from interplanetary distances,” said Linda Spilker, Cassini project scientist at NASA’s Jet Propulsion Laboratory, Pasadena, Calif, in a statement.
“While Earth is too small in the images Cassini obtained to distinguish any individual human beings, the mission has put together this collage so that we can celebrate all your waving hands, uplifted paws, smiling faces and artwork.”
The Cassini imaging science team is still assembling the hundreds of images of Saturn and Earth snapped by the spacecraft as we were waving, to create individual color composites and a panoramic view of the ‘pale blue dot’ and the entire Saturnian system.
To capture all of Saturn and its wide swath of rings, Cassini’s wide angle camera snapped a mosaic of 33 footprints on July 19, 2013.
“At each footprint, images were taken in different spectral filters for a total of 323 images,” says Carolyn Porco, Cassini Imaging Team leader, Space Science Institute in Boulder, Colo.
Cassini took the pictures of Earth from a distance of about 898 million miles (1.44 billion kilometers) away from the home to every human being that has ever lived.
Here is our partial version of Cassini’s mosaic.
Cassini was launched from Florida in 1997.
It achieved orbit at Saturn in 2004 and has transmitted breathtaking images and science that revolutionized our understanding of the Saturnian system.
The mission is scheduled to continue until 2017 when it will commit a suicide death dive into the humongous gas giant.
Coincidentally, the first humans (Neil Armstrong and Buzz Aldrin) set foot on the Moon 44 years ago nearly to the day of Cassini’s Earth-Moon portrait on July 20, 1969 aboard Apollo 11.
And likewise on July 19, 2013, billionaire space enthusiast Jeff Bezos announced that his dive teams had recovered components of an Apollo 11 first stage F-1 rocket engine from the Saturn V moon rocket that propelled the first humans to the Moon.

Geek Out! How to Build Your Own Nova Delphini Light Curve
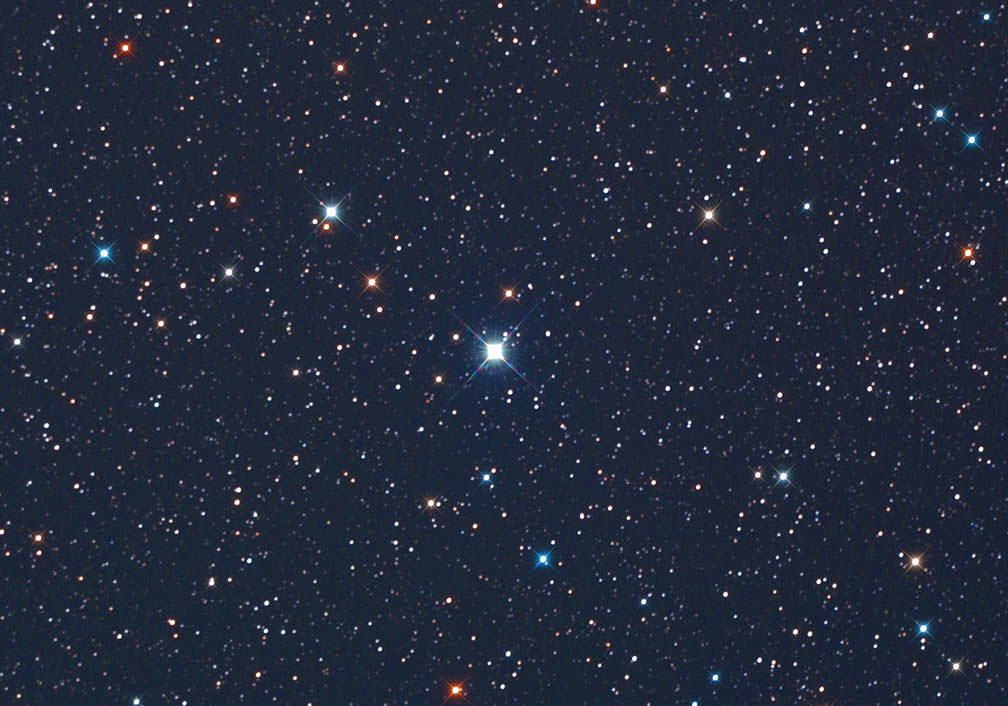
And now for something to appeal to your inner geek. Or, if you’re like me, your outer geek. Many of you have been watching the new nova in Delphinus with the naked eye and binoculars since it burst onto the scene early Aug. 14. In a moment I’ll show how to turn your observations into a cool representation of the nova’s behavior over time.
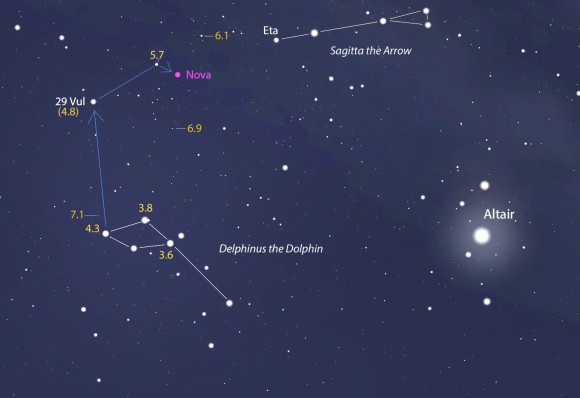
Where I live in northern Minnesota, we’ve had a lucky run of clear nights since the outburst began. Each night I’ve gone out with my 8×40 binoculars and star chart to estimate the nova’s brightness. The procedure is easy and straightforward. You find comparison stars near the nova with known magnitudes, then select one a little brighter and one a little fainter and interpolate between the two to arrive at the nova’s magnitude.
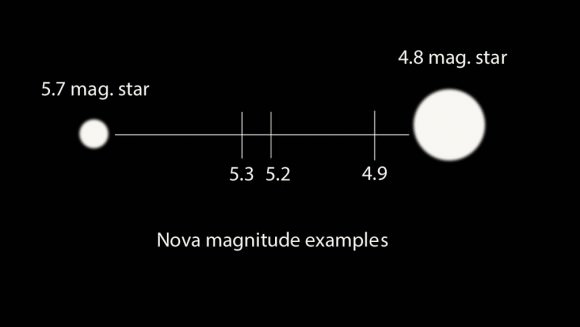
For example, if the nova’s brightness lies halfway between the magnitude 4.8 and 5.7 stars it’s about magnitude 5.3. The next night you might notice it’s not exactly halfway but a tad brighter or closer to the 4.8 star. Then you’d measure 5.2. Remember that the smaller the number, the brighter the object. I’ve found that defocusing the stars into disks makes it a bit easier to estimate these differences.
In time, you’ll come up with a list of magnitudes or brightness estimates for Nova Delphini. Here’s mine to date:
* Aug. 14: 5.8
* Aug. 15: 4.9
* Aug. 16: 5.0
* Aug. 17: 5.0
* Aug. 18: 5.0
* Aug. 19: 5.2
* Aug. 20: 5.5
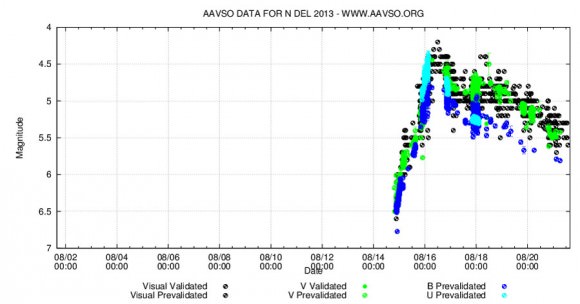
So far just numbers, but there’s a way to turn this into a satisfying visual picture of the nova’s long-term behavior. Graph it! That’s what astronomers do, and they call it a light curve.
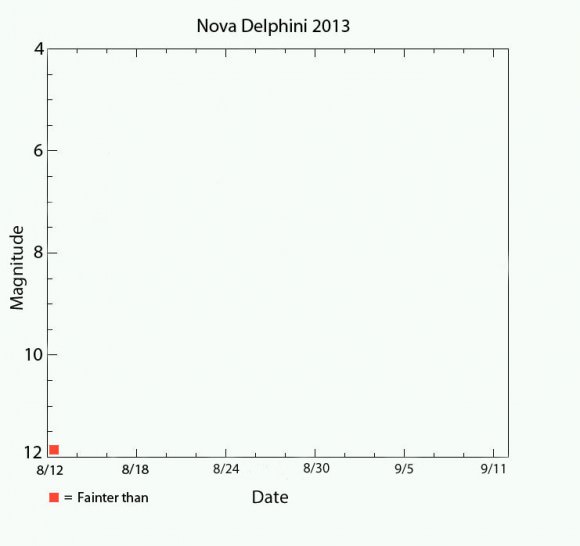
I dug around and came up with this very basic template. The horizontal or x-axis measures time in days, the vertical or y-axis plots the nova’s brightness measured in magnitudes. You can either right-click and save the image above or grab the higher-res version HERE.
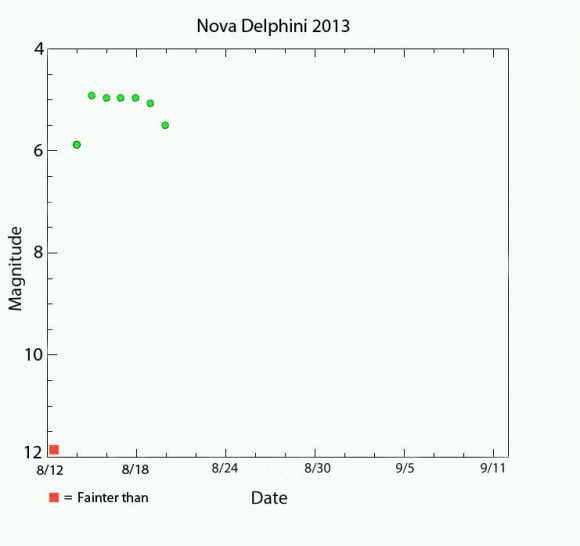
Next, print out a copy and lay in your data points with pencil and ruler the old-fashioned way or use an imaging program like Photoshop or Paint to do the same on the computer. I use a very basic version of Photoshop Elements to plot my observations. Once your observations are marked, connect them to build your light curve.
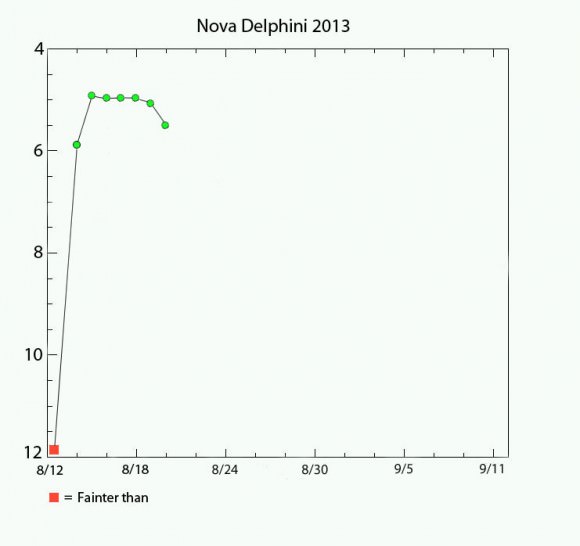
Right away you’ll notice a few interesting things. The nova shot up from approximately 17th magnitude on Aug. 13 to 6.8 on Aug. 14 – a leap of more than 10 magnitudes, which translates to a nearly 10,000 fold increase in brightness.
I wasn’t able to see the Nova Del top out at around 4.4 magnitude – that happened when I was asleep the next morning – but I did catch it at 4.9. The next few days the nova hits a plateau followed by what appears for the moment like a steady decline in brightness. Will it rocket back up or continue to fade? That’s for you and your binoculars to find out the next clear night.
If you’d like to take the next step and contribute your observations for scientific use, head over to the AAVSO (American Assn. of Variable Star Observers) and become a member. Even if you don’t sign up, access to data, charts and light curves of novae and other variable stars is completely free.

I get a kick out of comparing my basic light curves with those created with thousands of observations contributed by hundreds of observers. The basic AAVSO curve looks all scrunched up for the moment because their time scale (x-axis) is much longer term than in my simple example. But guess what? You can change the scale using their light curve generator and open up the view a little more as I did in the curve above.

Here are a couple other typical novae light curves. By the time you’re done looking at the examples here as well as creating your own, you’ll gain a familiarity that may surprise you. Not only will be able to interpret trends in Nova Delphini’s brightness, but you’ll better understand the behavior of other variable stars at a glance. It’s as easy as connecting the dots.
Haiku for Mars: Winners Selected for MAVEN Mission
Fans of Mars and spaceflight waxed poetic as the haiku selected to travel to Mars aboard the MAVEN spacecraft were announced earlier this month.
The contest received 12,530 valid entries from May 1st through the contest cutoff date of July 1st. Students learned about Mars, planetary exploration and the MAVEN mission as they composed haiku ranging from the personal to the insightful to the hilarious.
“The contest has resonated with people in ways that I never imagined! Both new and accomplished poets wrote poetry to reflect their views of Earth and Mars, their feelings about space exploration, their loss of loved ones who have passed on, and their sense of humor,” said Stephanie Renfrow, MAVEN Education & Public Outreach & Going to Mars campaign lead.
A total of 39,100 votes were cast in the contest; all entries receiving more than 2 votes (1,100 in all) will be carried on a DVD affixed to the MAVEN spacecraft bound for Martian orbit.
Five poems received more than a thousand votes. Among these were such notables as that of one 8th grader from Denver Colorado, who wrote;
Phobos & Deimos
Moons orbiting around Mars
Snared by Gravity
Another notable entry which was among the poems sited for special recognition by the MAVEN team was that of Allison Swets of Michigan;
My body can’t walk
My mouth can’t make words but I
Soar to Mars today
377 artwork entries were also selected to fly aboard MAVEN as well.
Didn’t get picked? There’s still time to send your name aboard MAVEN along with thousands that have already been submitted. You’ve got until September 10!
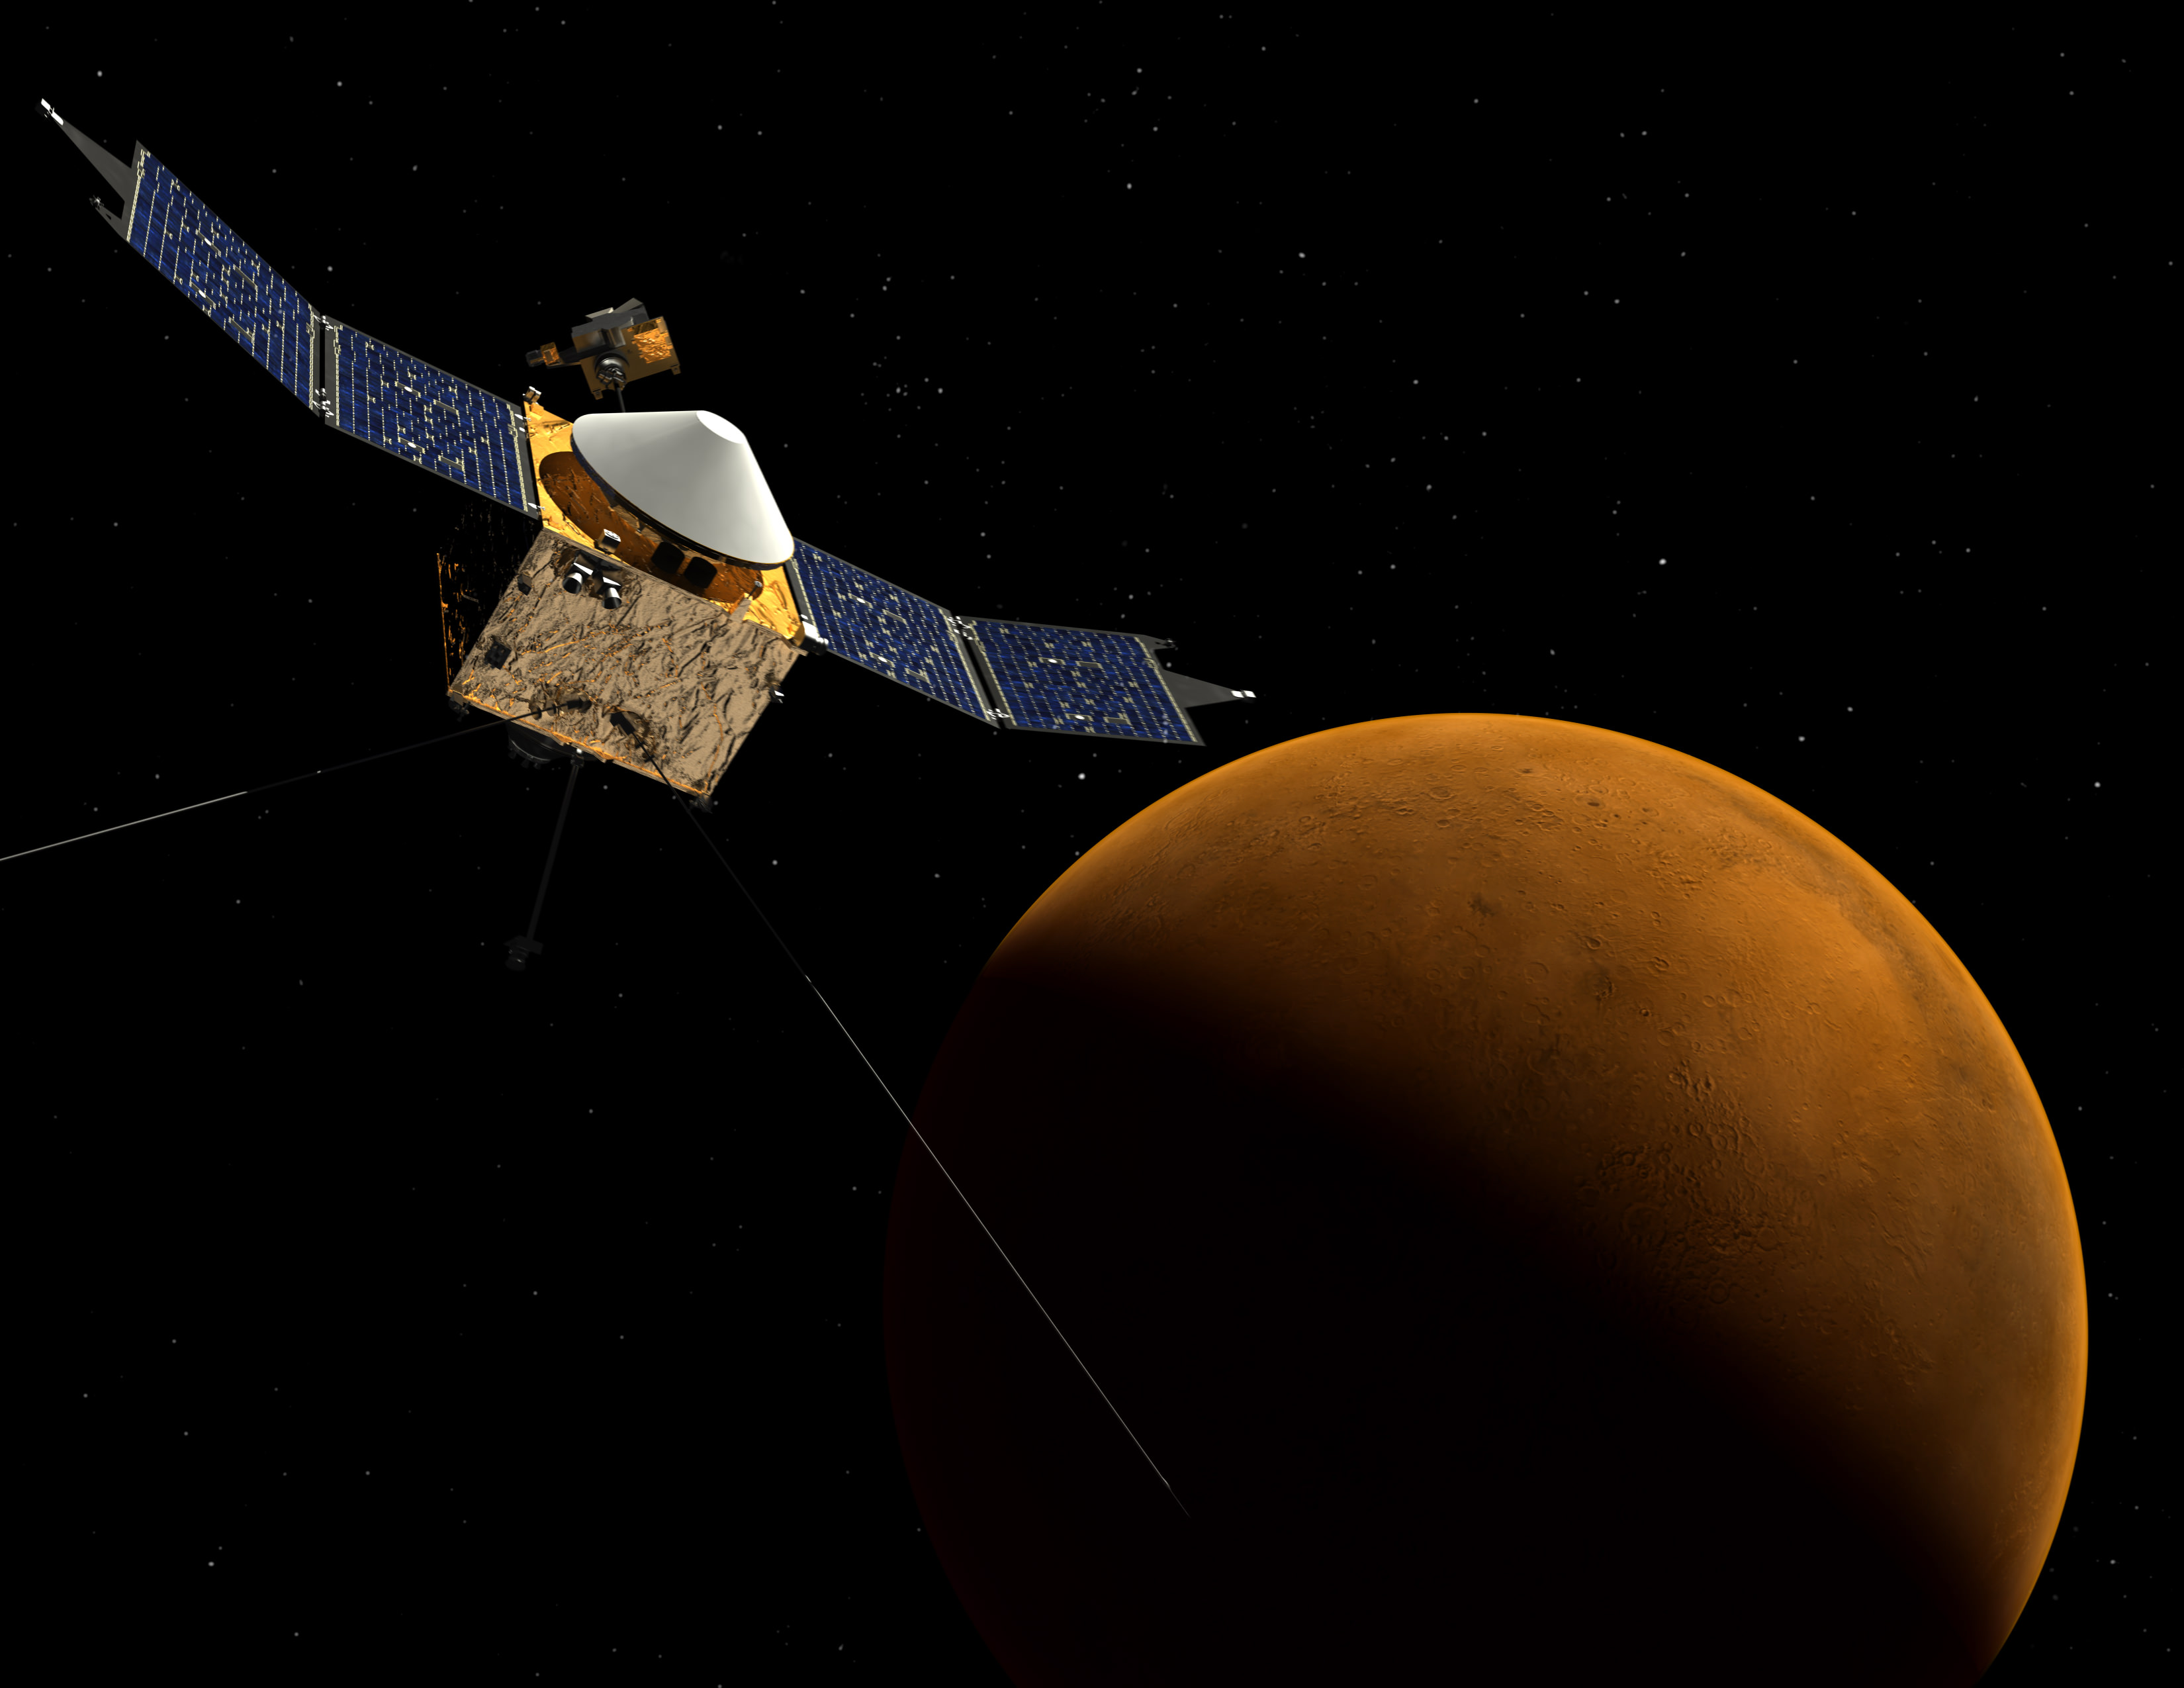
Part of NASA’s discontinued Scout-class of missions, the Mars Atmosphere and Volatile EvolutioN mission, or MAVEN, is due to launch out of Cape Canaveral on November 18th, 2013. Selected in 2008, MAVEN has a target cost of less than $500 million dollars US, not including launch carrier services atop an Atlas V rocket in a 401 flight configuration.
The Phoenix Lander was another notable Scout-class mission that was extremely successful, concluding in 2008.
Principal investigator for MAVEN is the University of Boulder at Colorado’s Bruce Jakosky of the Laboratory for Atmospheric and Space Physics (LASP).
The use of poetry to gain public interest in the mission is appropriate, as MAVEN seeks to solve the riddle that is the Martian atmosphere. How did Mars lose its atmosphere over time? What role does the solar wind play in stripping it away? And what is the possible source of that anomalous methane detected by Mars Global Surveyor from 1999 to 2004?
MAVEN is based on the design of the Mars Odyssey and Mars Reconnaissance Orbiter spacecraft. It will carrying an armada of instruments, including a Neutral Gas & Ion Mass Spectrometer, a Particle and Field Package with several analyzers, and a Remote Sensing Package built by LASP.
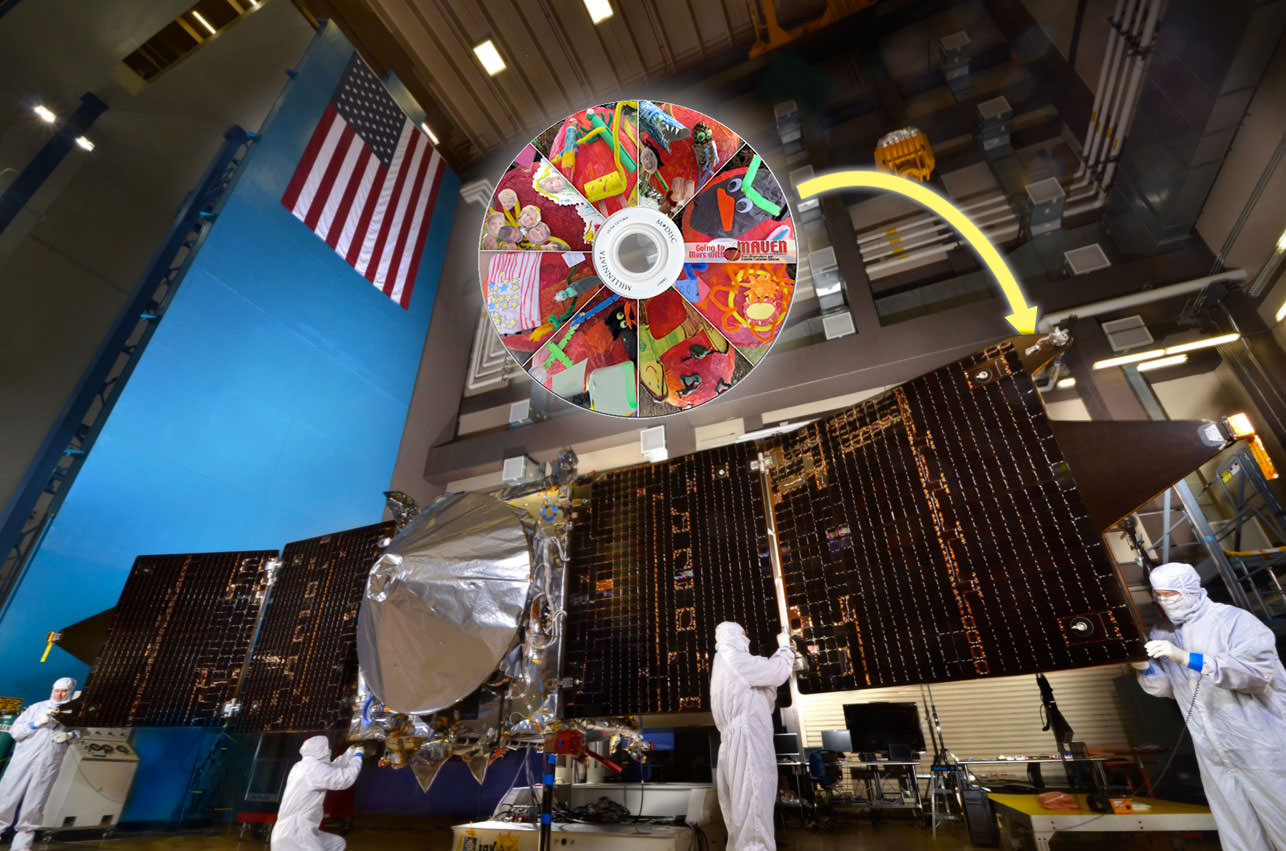
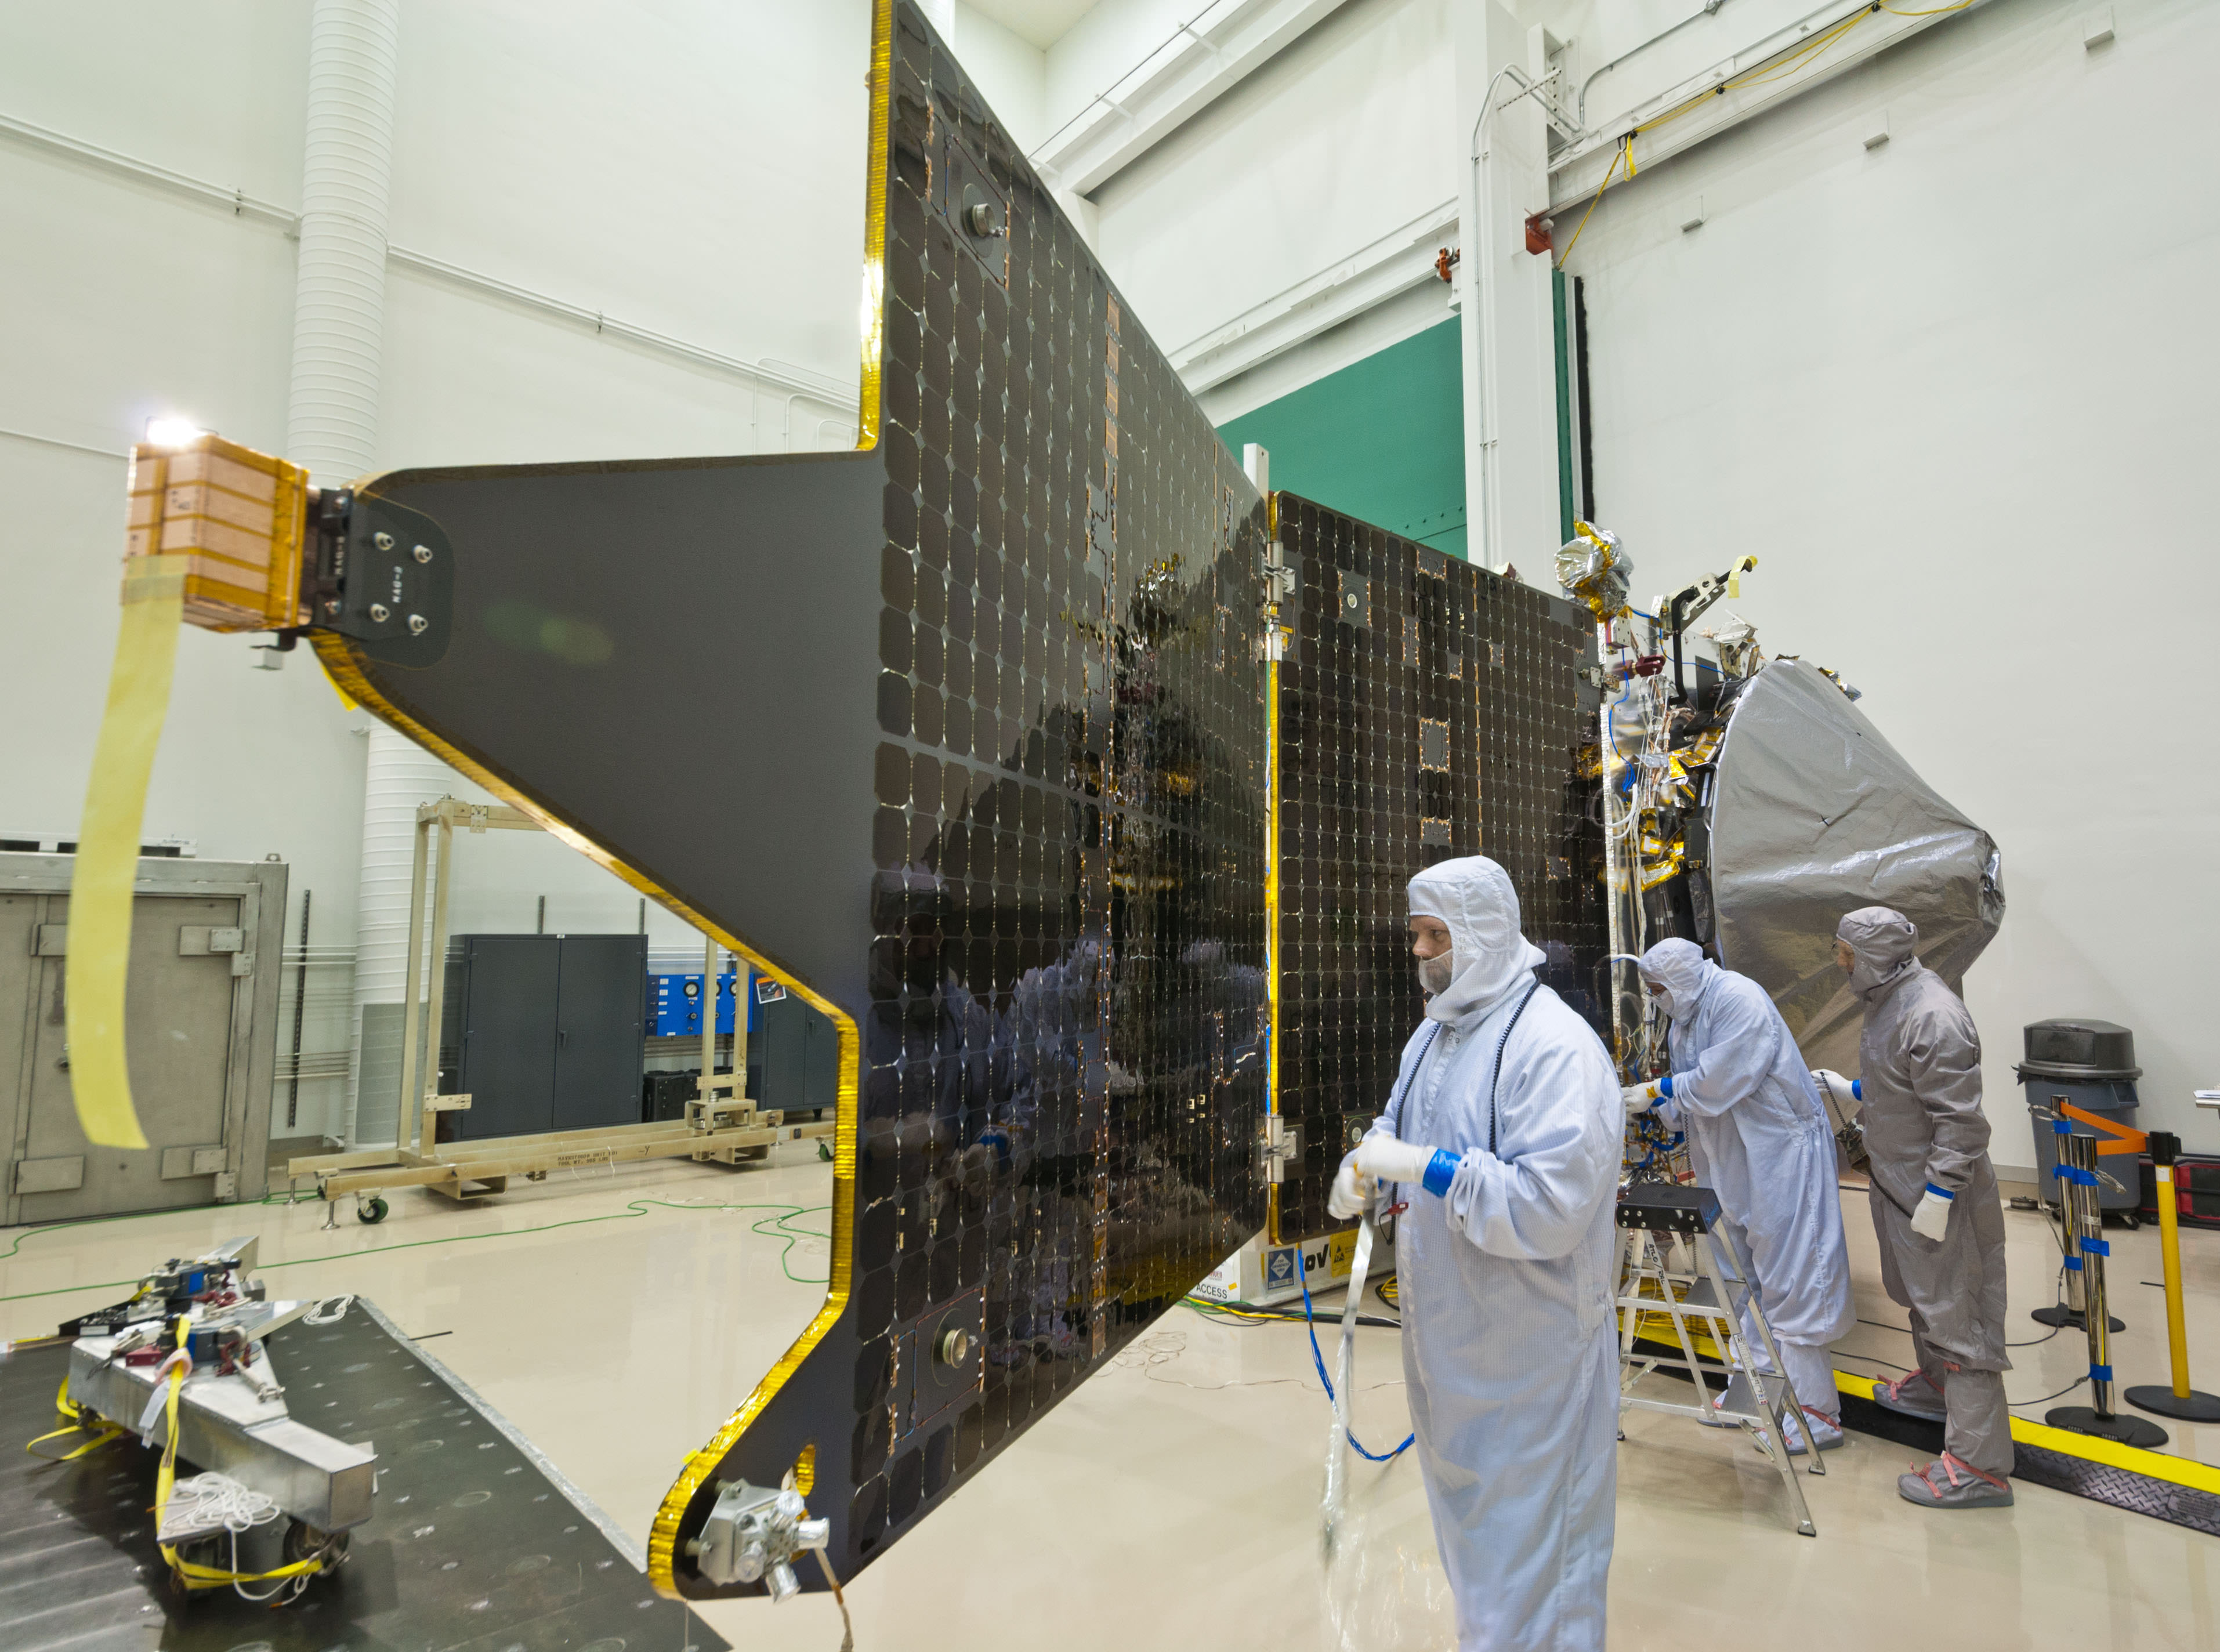
MAVEN just arrived at the Kennedy Space Center earlier this month for launch processing and mating to its launch vehicle. Launch will be out of Cape Canaveral Air Force Station on November 18th with a 2 hour window starting at 1:47 PM EST/ 18:47 UT.
Assuming that MAVEN launches at the beginning of its 20 day window, it will reach Mars for an orbital insertion on September 22, 2014. MAVEN will orbit the Red Planet in an elliptical 150 kilometre by 6,200 kilometre orbit, joining the Mars Reconnaissance Orbiter, the European Space Agencies’ Mars Express and the aging Mars Odyssey orbiter, which has been surveying Mars since 2001.
The window for an optimal launch to Mars using a minimal amount of fuel opens every 24 to 26 months. During the last window of opportunity in 2011, the successful Mars Curiosity rover and the ill-fated Russian mission Phobos-Grunt sought to make the trip.
This time around, MAVEN will be joined by India’s Mars Orbiter Mission, launching from the Satish Dhawan Space Center on October 21st. If successful, the Indian Space Research Organization (ISRO) will join Russia, ESA & NASA in nations that have successfully launched missions to Mars.
This window comes approximately six months before Martian opposition, which next occurs on April 8th, 2014. In 2016, ESA’s ExoMars Mars Orbiter and NASA’s InSight Lander will head to Mars. And 2018 may see the joint ESA/NASA ExoMars rover and… if we’re lucky, Dennis Tito’s proposed crewed Mars 2018 flyby.
Interestingly, MAVEN also arrives in Martian orbit just a month before the close 123,000 kilometre passage of comet C/2013 A1 Siding Spring, although as of this time, there’s no word if it will carry out any observations of the comet.
These launches will also represent the first planetary missions to depart Earth since 2011. You can follow the mission as @MAVEN2Mars on Twitter. We’ll also be attending the MAVEN Conference and Workshop this weekend in Boulder and tweeting our adventures (wi-fi willing) as @Astroguyz. We also plan on attending the November launch in person as well!
And in the end, it was perhaps for the good of all mankind that our own rule-breaking (but pithy) Mars haiku didn’t get selected:
Rider of the Martian Atmosphere
Taunting Bradbury’s golden-bee armed Martians
While dodging the Great Galactic Ghoul
Hey, never let it be said that science writers make great poets!
How to See Planet Neptune: Our Guide to Its 2013 Opposition
If you do your own stargazing or participate in our Sunday night Virtual Star Parties, you’ve probably noticed we’re starting to lose planetary targets in the night-time sky. August and September of this year sees Venus and Saturn to the west at dusk, with the planets Mars and Jupiter adorning the eastern dawn sky just hours before sunrise.
That means there is now a good span of the night that none of the classic naked eye planets are above the horizon. But the good news is, with a little persistence, YOU can spy the outermost planet in our solar system in the coming weeks: the elusive Neptune. (Sorry, Pluto!)
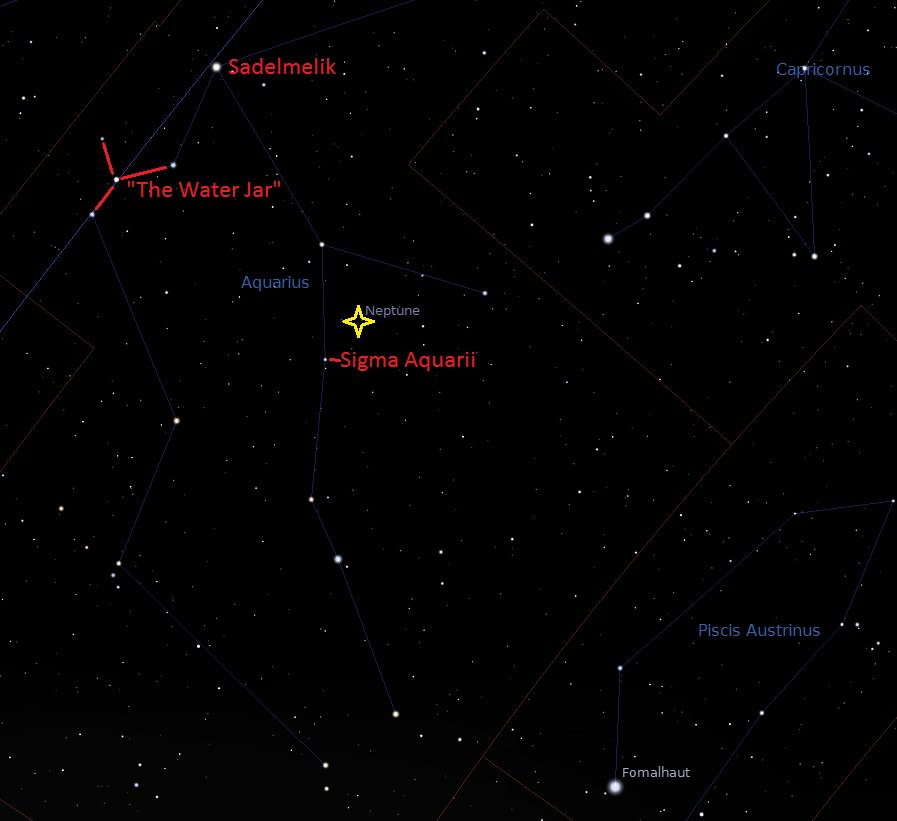
The planet Neptune reaches opposition late this month in the constellation Aquarius on August 27th at 01:00 UT (9:00 PM EDT on the 26th). This means that it will rise to the east as the Sun sets to the west and will remain above the local horizon for the entire night.
If you’ve never caught sight of Neptune, these next few weeks are a great time to try. The Moon passes 6° north of the planet’s location this week on August 21st, just 10 hours after reaching Full.

Shining at magnitude +7.8, Neptune is an easy catch with binoculars from a dark sky site. Even in a large telescope, Neptune appears as a tiny blue dot, almost looking like a dim planetary nebula that refuses to come to a sharp focus. Visually, Neptune is only 2.3” across at opposition; you could stack 782 Neptunes across the breadth of the Full Moon!
It’s sobering to think that Neptune only just returned in 2011 to the position of its original discovery back in 1846. The calculation of Neptune’s position by Urbain Le Verrier was a triumph for Newtonian mechanics, a moment where the science of astronomy began to demonstrate its predictive power.
Astronomers knew of the existence of an unseen body due to the perturbations of the planet Uranus, which was discovered surreptitiously by William Herschel 65 years earlier. Using Le Verrier’s calculations, Johann Galle and Heinrich d’Arrest spied the planet on the night of September 23rd, 1846 using the Berlin observatory’s 9.6” refractor. Neptune was within a degree of the position described in Le Verrier’s prediction.
Neptune orbits the Sun once every 164.8 years, and comes back into opposition once every successive calendar year about 2 days later than the last. Those observers of yore were lucky that Neptune and Uranus experienced a close and undocumented conjunction in 1821; otherwise, Neptune may have gone undetected for a much longer span of time. And ironically, Galileo sketched the motion of Neptune near Jupiter in 1612 and 1613, but failed to identify it as a planet!
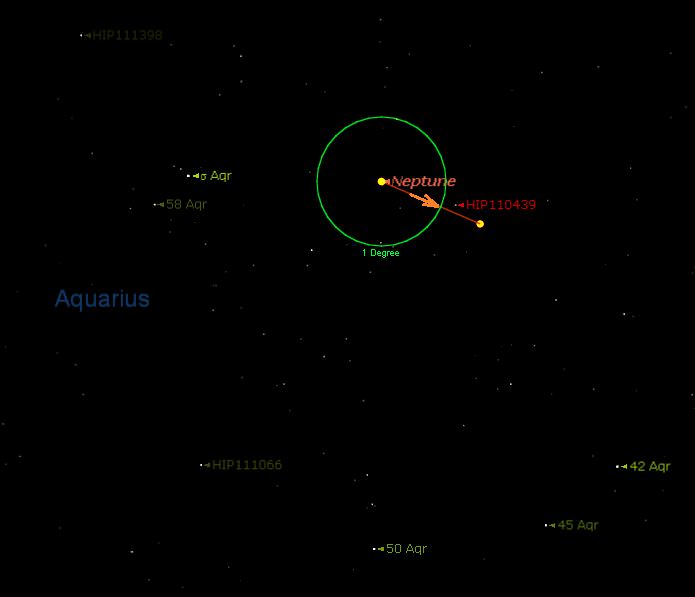
Neptune descended through the ecliptic in 2003 and won’t reach its southernmost point below it until 2045. This month, Neptune lies 1.5 degrees west of the +4.8 magnitude double star Sigma Aquarii. Neptune passes less than 4’ from +7.5 magnitude star HIP 110439 on September 9th as it continues towards eastern quadrature on November 24th.
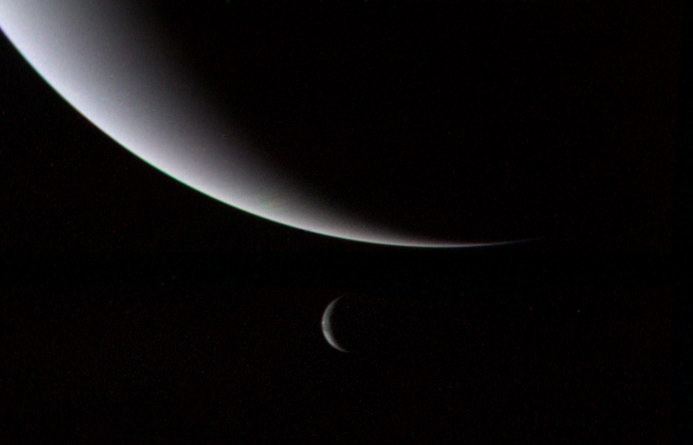
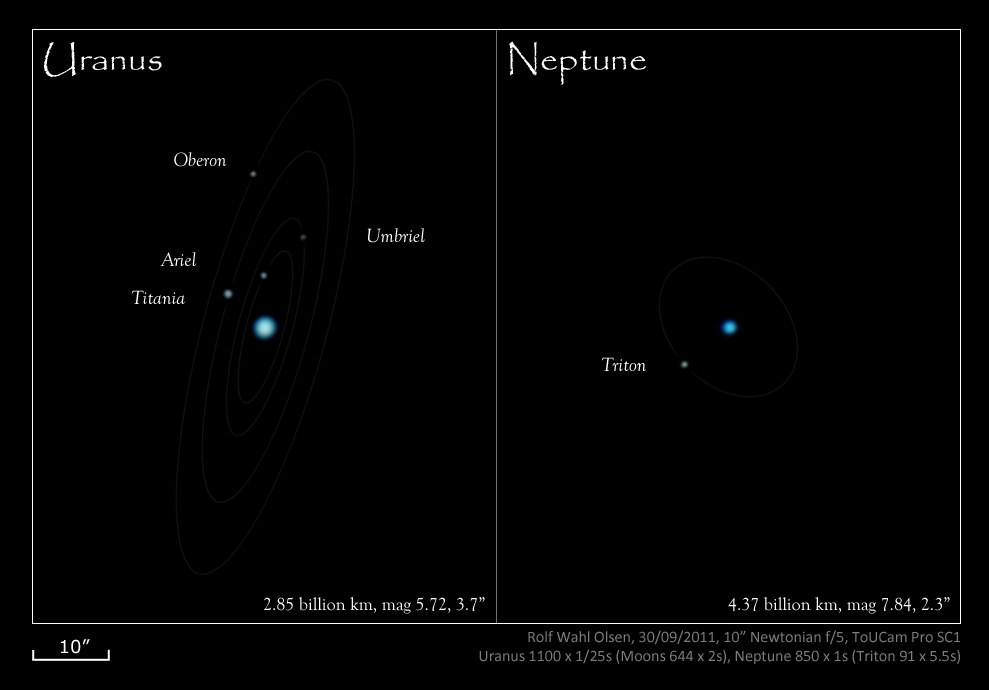
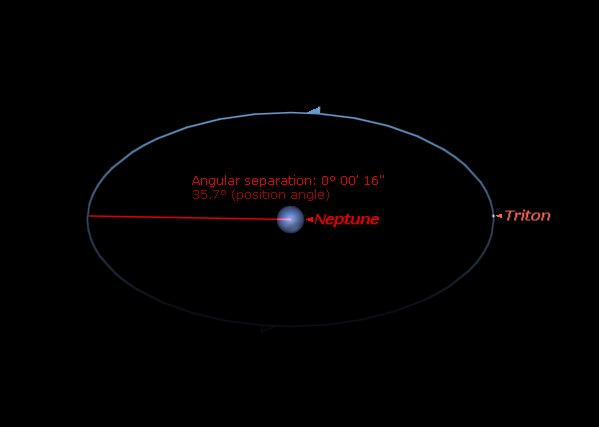
Up for a challenge? Neptune also has a large moon named Triton that is just within range of a moderate (8” in aperture or larger) telescope. Shining at magnitude +13.4, Triton is similar in brightness to Pluto and is 100 times fainter than Neptune. In fact, there’s some thought that Pluto may turn out to be similar to Triton in appearance when New Horizons gets a close-up look at it in July 2015.
Triton never strays more than 18” from Neptune during eastern or western elongations. This presents the best time to cross the moon off your astronomical “life list…” experienced amateurs have even managed to image Triton!
Triton was discovered just 17 days after Neptune by William Lassell using a 24” reflector. Triton is also an oddball among large moons in the solar system in that it’s in a retrograde orbit.
A second moon named Nereid was discovered by Gerard Kuiper in 1949. To date, Neptune has 14 moons, including the recently discovered S/2004 N1 unearthed in Hubble archival data.
To date, Voyager 2 is the only spacecraft that has studied Neptune and its moons up close. Voyager 2 conducted a flyby of the planet in 1989. A future mission to Neptune would face the same dilemma as New Horizons: a speedy journey would still take nearly a decade to complete, which would rule out an orbital insertion around the planet. (Darn you, orbital mechanics!) In fact, New Horizons just crosses the orbit of Neptune at a distance of 30 astronomical units from the Earth in 2014.
Neptune is about four light hours away from the Earth, a distance that varies less than 20 minutes in light travel time from solar conjunction to opposition. And while Neptune and Triton may not appear like much more than dim dots through a telescope, what you’re seeing is an ice giant 3.8 times the diameter of the Earth, with a large moon 78% the size of our own.
Make sure to cross Neptune and Triton off of your bucket list… and next month, we’ll be able to do the same for the upcoming opposition of Uranus!
Venus And Moon Caught In A Crazy, Phase-y Coincidence Tonight
Curious coincidences occur in the sky just as they do on Earth. Take tonight for instance. The moon is in gibbous phase or about 3/4 full – 78% to be exact – while Venus, which also undergoes phases identical to the moon, is likewise gibbous and 78% full.
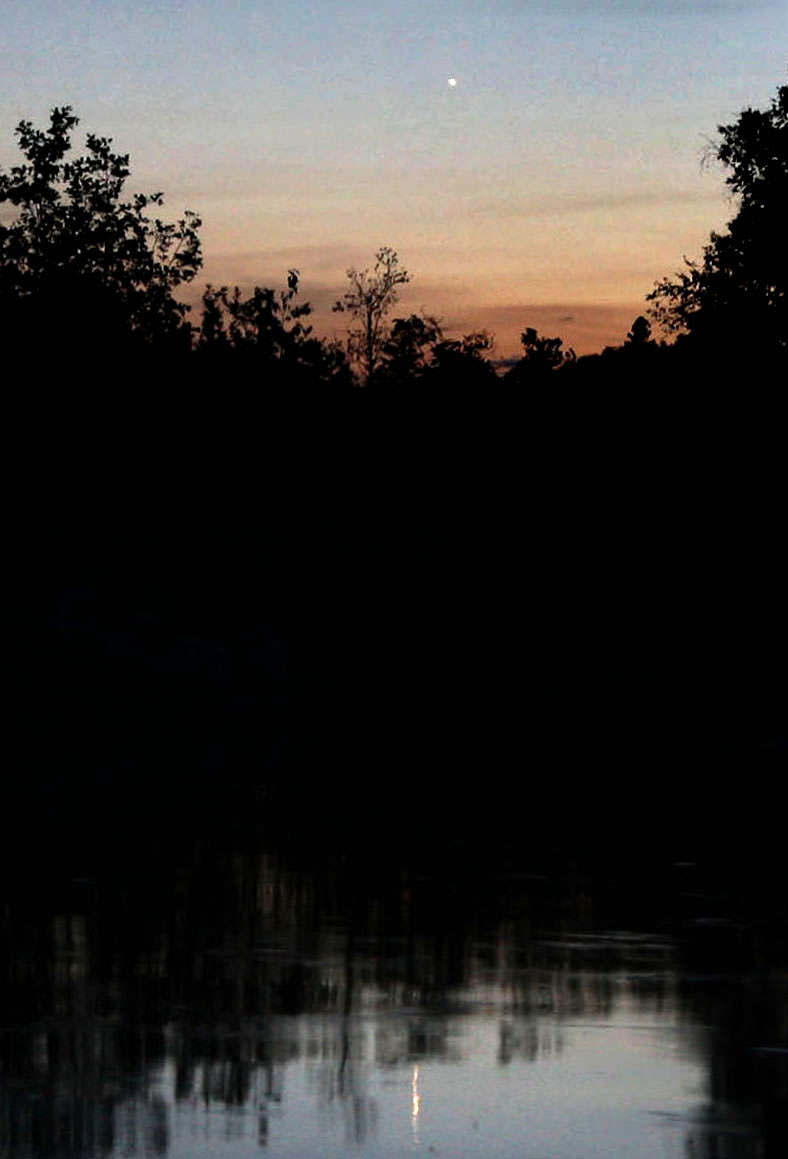
That’s just cool. If you have telescope, focus on Venus low in the western sky just after sunset and see a perfect replica in miniature of tonight’s moon.
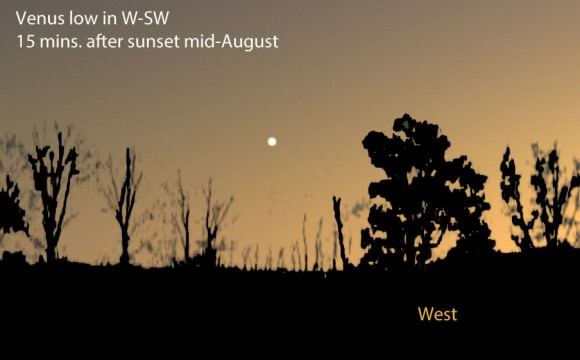
Be sure you’re out early as the planet is low to begin with and drops lower in the west with each passing minute. Provided the sky is haze-free, Venus isn’t difficult to spot even 5 minutes after sunset. Look about 10 degrees (one fist held at arm’s length) above the west-southwest horizon.
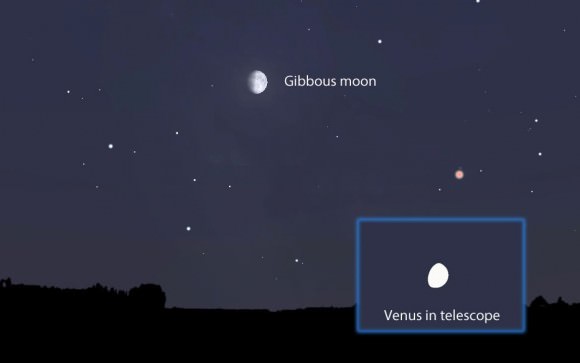
The moon shows spectacular craters and mountains, but Venus hides its equally spectacular scenery of volcanic mountains, craters and cracked plains beneath a permanent cover of sulfur-dioxide-laced clouds. Clouds are excellent reflectors of sunlight. Not only is the planet brilliant because of them but looks as white as a shiny cue ball.
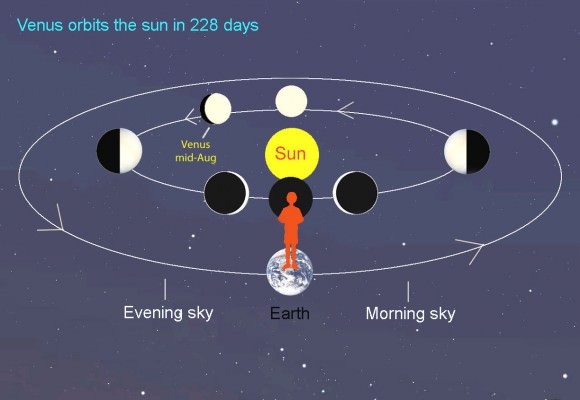
Tomorrow night the moon and Venus will go their own phase-y way, the moon fattening up toward full and Venus slowly slimming its waistline as it works its way toward the Earth. For now enjoy their temporary bond.
Newly Discovered Fast Radio Bursts May be Colliding Neutron Stars
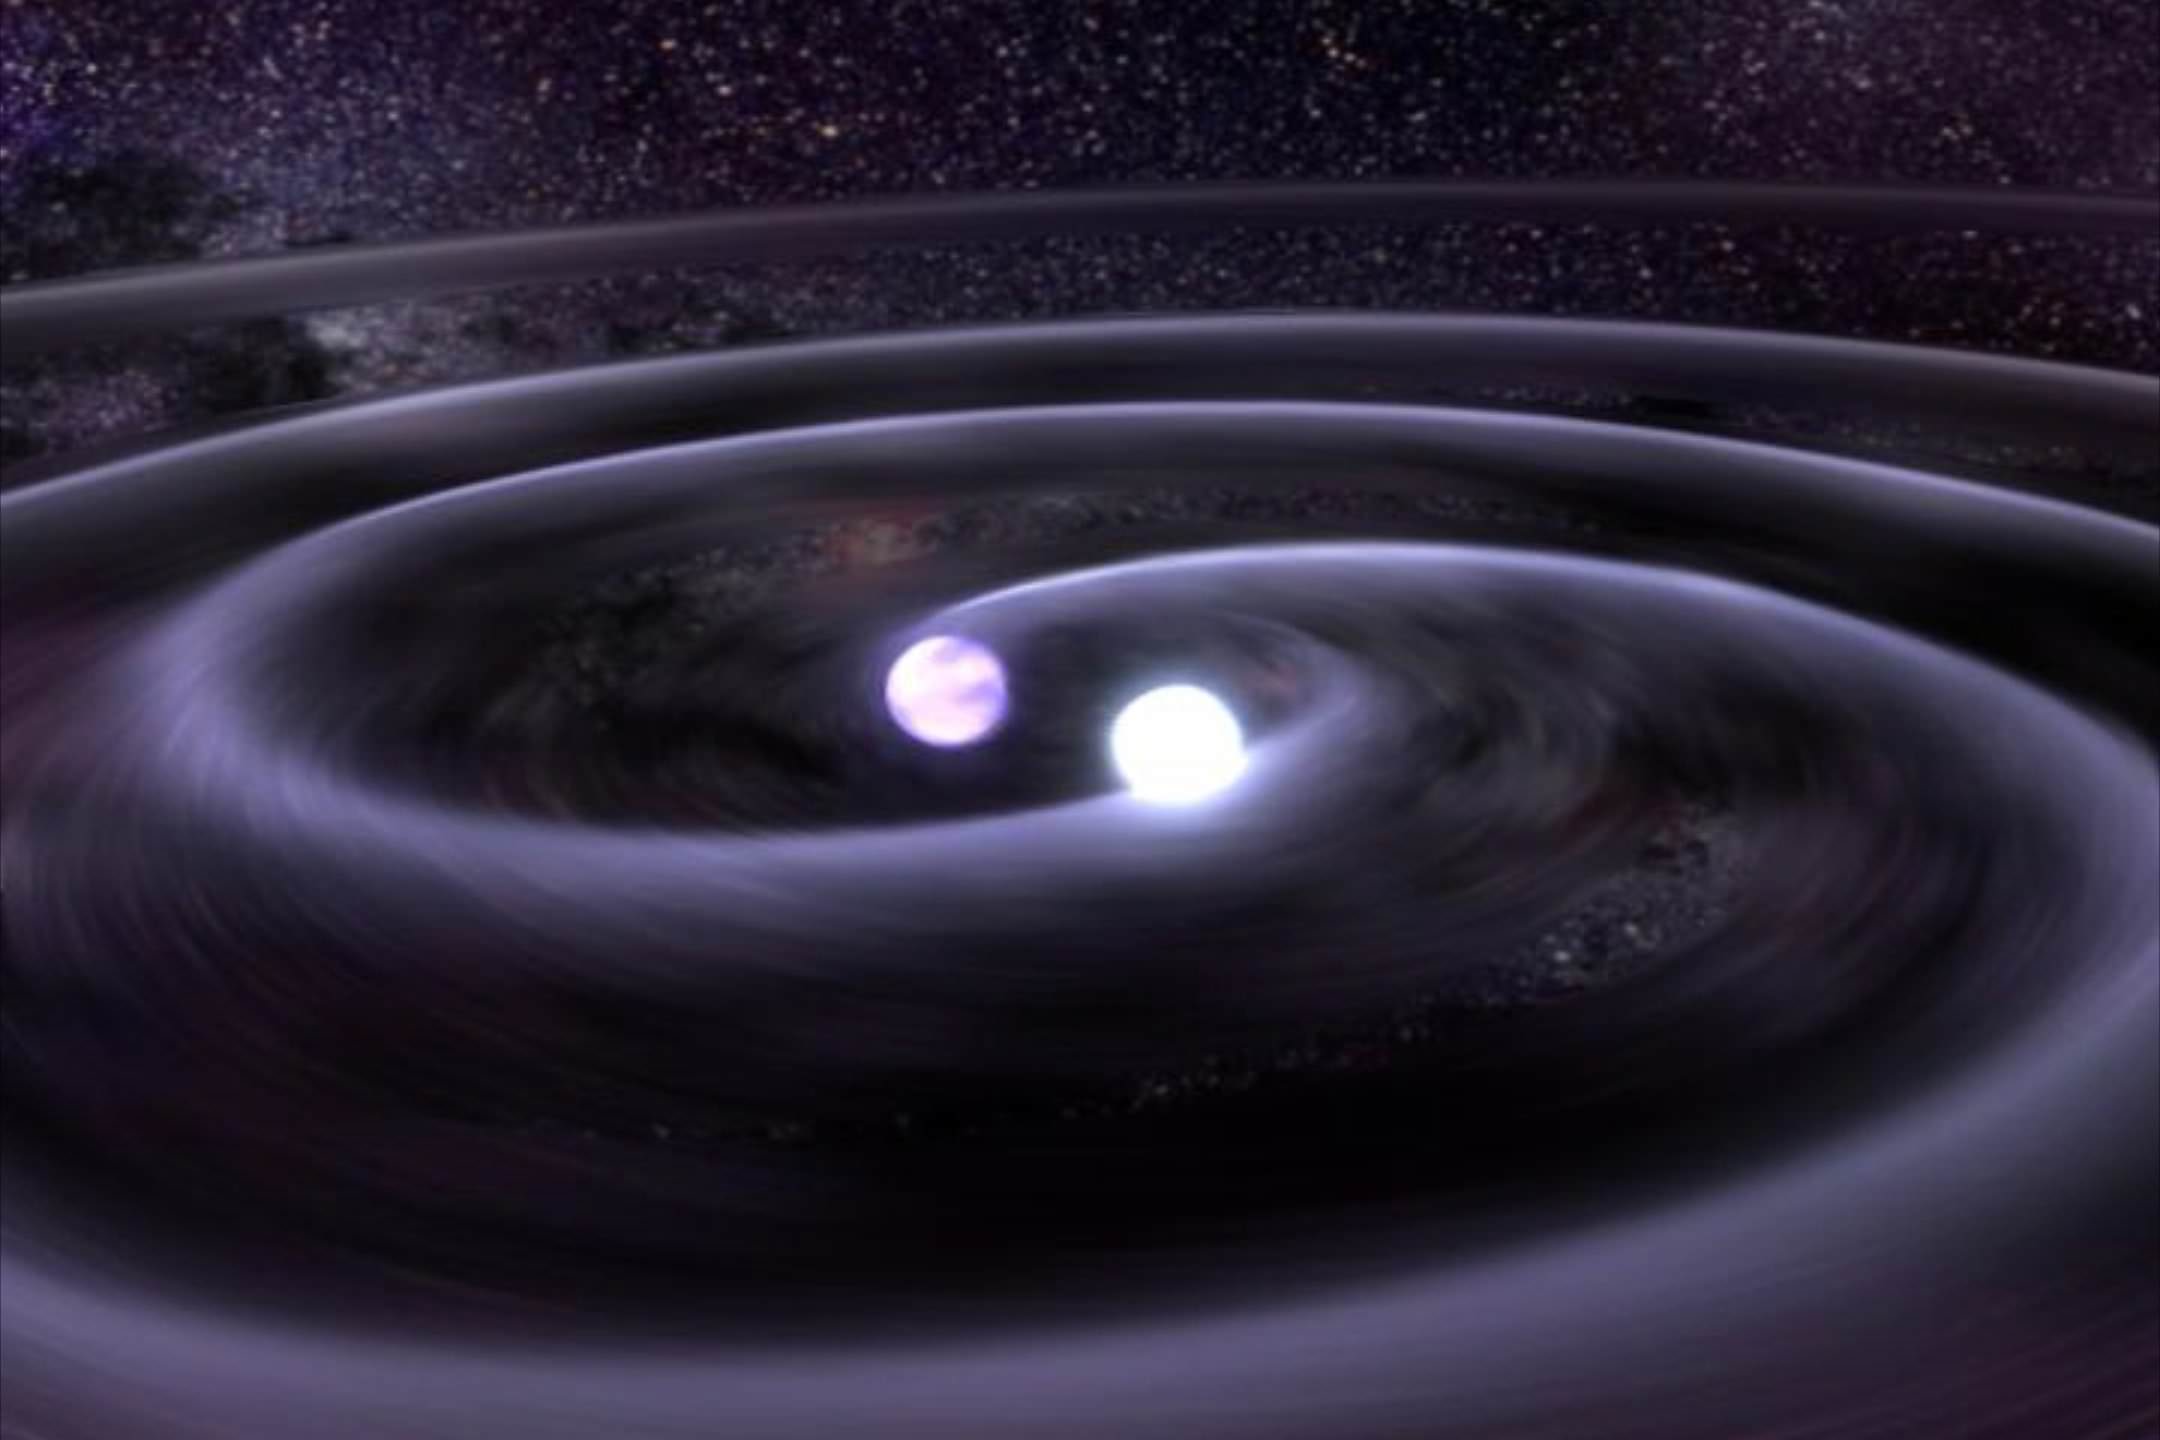
The Universe is sizzling with undiscovered phenomena. Only last month astronomers heard four unexpected bumps in the night. These Fast Radio Bursts released torrents of energy, each occurred only once, and lasted a few thousandths of a second. Their origin has since mystified astronomers.
Dismissing my first guess, which includes a feverish Jodie Foster verifying the existence of extraterrestrial life, astronomers have found a more likely answer. Two neutron stars collide, but before doing so produce a quick burst of radio emission, which we later observe as a Fast Radio Burst.
Our first hint? These Fast Radio Bursts are extra-galactic in origin. The exact distance is quantifiable from a “dispersion measure – the frequency dependent time delay of the radio signal,” Dr. Tomonori Totani, lead author on the paper, told Universe Today. “This is proportional to the number of electrons along the line of sight.”
For all bursts, the short-wavelength component arrived at the telescope a fraction of a second before the longer wavelengths. This is due to an effect known as interstellar dispersion: through any medium, longer-wavelength light moves slightly slower than short-wavelength light.
Light from extra-galactic objects will have to travel through intergalactic space, which is teeming with electrons in clouds of cold plasma. The farther the light travels, the more electrons it will have to travel through, and the greater the time delay between arriving wavelength components. By the time light reaches the Earth, it has been dispersed, and the amount of dispersion is directly correlated with distance.
These Fast Radio Bursts are likely to have originated anywhere from 5 to 10 billion light years away.
While the exact source of these Fast Radio Bursts has been highly debated, a recent hypothesis concludes that they are the result of merging neutron stars in the distant Universe.
In the final milliseconds before merging, the rotation periods of the two neutron stars synchronize – they become tidally locked to one another as the Moon is tidally locked to the Earth. At this point their magnetic fields also synchronize. Energetic charged particles spiral along the strong magnetic field lines and emit a beam of radio synchrotron emission.
Known neutron star magnetic field strengths are consistent with the radio flux observed in these Fast Radio Bursts. The emission then ceases in a few milliseconds when the two neutron stars have collided, which explains the short duration of these Fast Radio Bursts.
Not only does this mechanism describe both the high energy and the time duration of these bursts, but they’re inferred occurrence rate as well. It’s likely that 100,000 Fast Radio Bursts occur each day. This matches the likely neutron star merger rate.
Merging neutrons stars will also create gravitational waves – ripples in the curvature of spacetime that propagate away from the event. Dr. Totani emphasized that the next step will be to perform a correlated search of gravitational waves and Fast Radio Bursts. Such a fast rate estimate is certainly good news for scientists hoping to detect gravitational waves in the nearby future.
The Universe is bursting with energy – literally – every 10 seconds, and until recently we simply had no idea. This recently discovered phenomenon is likely to be the center of a new active area of research. And I have no doubt that it will lead to exciting discoveries that just may break trends and burst into new territories.
The discovery paper may be found here, while the paper analyzing neutron stars as a likely source may be found here.
Voyager 1: Is It In or Is It Out?
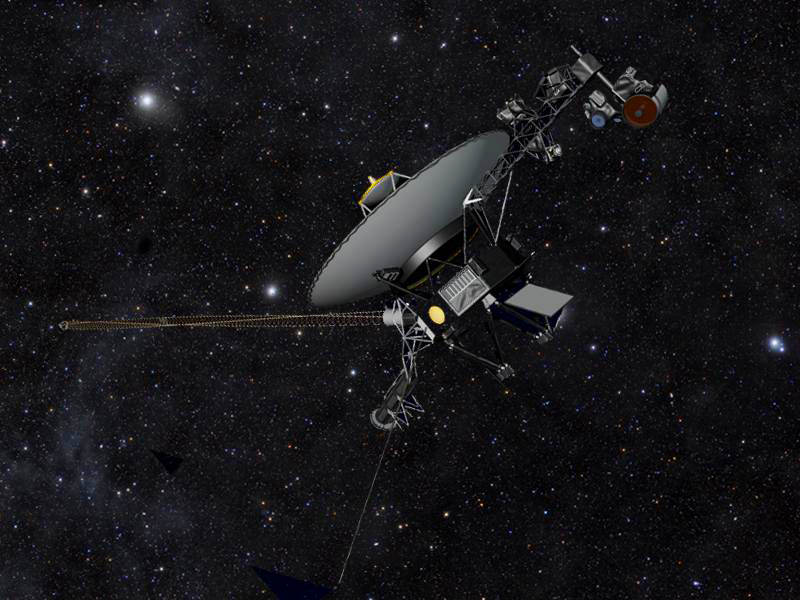
Nearly 18.7 billion kilometers from Earth — about 17 light-hours away — NASA’s Voyager 1 spacecraft is just about on the verge of entering interstellar space, a wild and unexplored territory of high-energy cosmic particles into which no human-made object has ever ventured. Launched in September 1977, Voyager 1 will soon become the first spacecraft to officially leave the Solar System.
Or has it already left?
I won’t pretend I haven’t heard it before: Voyager 1 has left the Solar System! Usually followed soon after by: um, no it hasn’t. And while it might all seem like an awful lot of flip-flopping by supposedly-respectable scientists, the reality is there’s not a clear boundary that defines the outer limits of our Solar System. It’s not as simple as Voyager rolling over a certain mileage, cruising past a planetary orbit, or breaking through some kind of discernible forcefield with a satisfying “pop.” (Although that would be cool.)
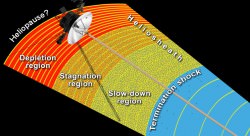
Rather, scientists look at Voyager’s data for evidence of a shift in the type of particles detected. Within the transitionary zone that the spacecraft has most recently been traveling through, low-energy particles from the Sun are outnumbered by higher-energy particles zipping through interstellar space, also called the local interstellar medium (LISM). Voyager’s instruments have been detecting dramatic shifts in the concentrations of each for over a year now, unmistakably trending toward the high-energy end — or at least showing a severe drop-off in solar particles — and researchers from the University of Maryland are claiming that this, along with their model of a porous solar magnetic field, indicates Voyager has broken on through to the other side.
Read more: Voyagers Find Giant Jacuzzi-like Bubbles at Edge of Solar System
“It’s a somewhat controversial view, but we think Voyager has finally left the Solar System, and is truly beginning its travels through the Milky Way,” said Marc Swisdak, UMD research scientist and lead author of a new paper published this week in The Astrophysical Journal Letters.
According to Swisdak, fellow UMD plasma physicist James F. Drake, and Merav Opher of Boston University, their model of the outer edge of the Solar System fits recent Voyager 1 observations — both expected and unexpected. In fact, the UMD-led team says that Voyager passed the outer boundary of the Sun’s magnetic influence, aka the heliopause… last year.
Read more: Winds of Change at the Edge of the Solar System
But, like some of last year’s claims, these conclusions aren’t shared by mission scientists at NASA.
“Details of a new model have just been published that lead the scientists who created the model to argue that NASA’s Voyager 1 spacecraft data can be consistent with entering interstellar space in 2012,” said Ed Stone, Voyager project scientist at Caltech, in a press release issued today. “In describing on a fine scale how magnetic field lines from the sun and magnetic field lines from interstellar space can connect to each other, they conclude Voyager 1 has been detecting the interstellar magnetic field since July 27, 2012. Their model would mean that the interstellar magnetic field direction is the same as that which originates from our sun.
“Other models envision the interstellar magnetic field draped around our solar bubble and predict that the direction of the interstellar magnetic field is different from the solar magnetic field inside. By that interpretation, Voyager 1 would still be inside our solar bubble.”
Stone says that further discussion and investigation will be needed to “reconcile what may be happening on a fine scale with what happens on a larger scale.”
Whether still within the Solar System — however it’s defined — or outside of it, the bottom line is that the venerable Voyager spacecraft are still conducting groundbreaking research of our cosmic neighborhood, 36 years after their respective launches and long after their last views of the planets. And that’s something nobody can argue about.
“The Voyager 1 spacecraft is exploring a region no spacecraft has ever been to before. We will continue to look for any further developments over the coming months and years as Voyager explores an uncharted frontier.”
– Ed Stone, Voyager project scientist
Built by JPL and launched in 1977, both Voyagers are still capable of returning scientific data from a full range of instruments, with adequate power and propellant to remain operating until 2020.
Read the full UMD news release here, and find out more about the Voyager mission on the NASA/JPL website here.
_____________
Note: The definition of “Solar System” used in this article is in reference to the Sun’s magnetic influence, the heliosphere, and all that falls within its outermost boundary, the heliopause (wherever that is.) Objects farther out are still gravitationally held by the Sun, such as distant KBOs and Oort Cloud comets, but orbit within the interstellar medium.
Hobbled Kepler Space Telescope Now On The Hunt For A New Mission
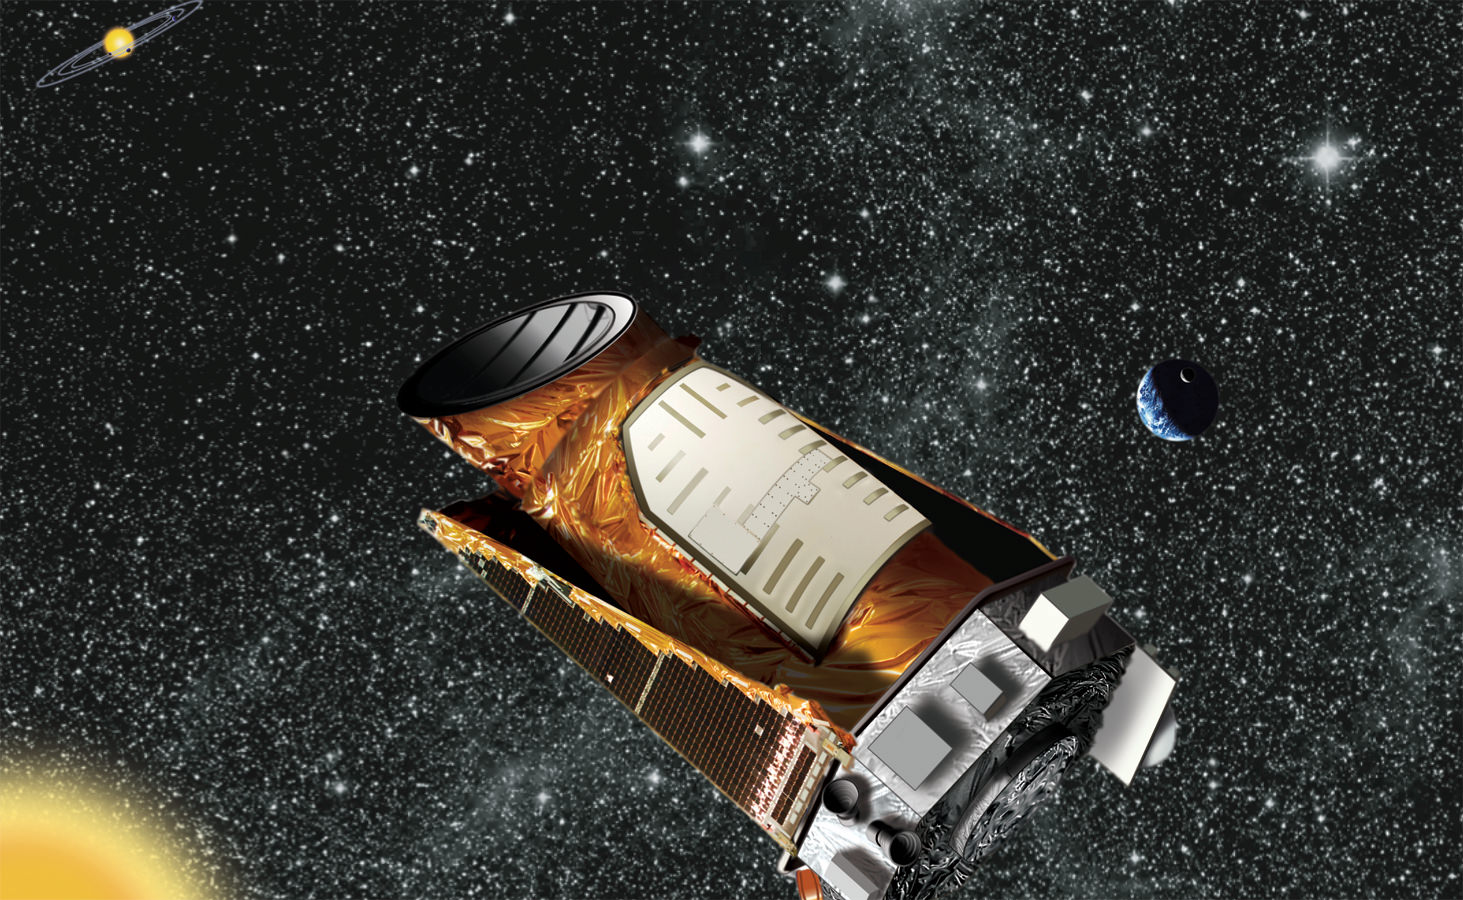
It’s unclear how the Kepler space telescope’s science operations will continue, if at all, as NASA weighs what to do with the crippled spacecraft. But the agency says not to count Kepler out yet.
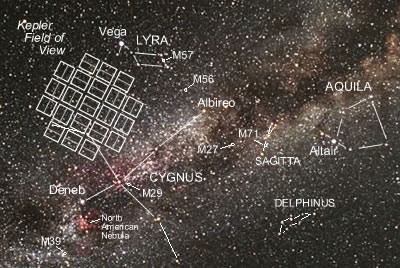
What’s known for sure is NASA cannot recover the two failed reaction wheels that stopped Kepler from doing its primary science mission, which was searching for exoplanets (with a focus on Earth-sized exoplanets) in a small area in the constellation Cygnus.
“We do not believe we can recover three-wheel operation or Kepler’s original science mission,” said Paul Hertz, NASA astrophysics division director, in a telephone press conference with reporters Thursday (Aug. 15).
But the spacecraft, which is already working years past when its prime mission ceased in 2010, is still in great shape otherwise, added Charles Sobeck, Kepler’s deputy project manager.
As such, NASA is now considering other science missions, which could be anything from searching for asteroids to a technique called microlensing, which could show Jupiter-sized planets around other stars with the spacecraft’s more limited pointed ability. More information should be available in the fall on these points, once Kepler’s team reviews some white papers with science proposals.
There are limiting factors. The first is the health of the spacecraft, but it is so far listed as good (except for the two damaged reaction wheels). While radiation can degrade components over time, and a stray micrometeorid could (as a small chance) cause damage on the spacecraft, right now Kepler is able to work on something new, Sobeck said.
“We have it in a point rest state right now,” Sobeck said, referring to a state where the spacecraft uses as little fuel as possible. This will extend the fuel “budget” for years, although Sobeck was unable to say just how many years yet.
Another concern is NASA’s limited budget, which (like other government departments) has undergone sequestration and other measures as the U.S. government grapples with its debt. Kepler has an estimated $18 million budget in fiscal 2013, agency officials said, adding they would need to weigh any future science mission against those of other projects being done by the agency.
The public drama began on May 15, when NASA announced that a second of Kepler’s four reaction wheels — devices that keep the telescope pointed in the right direction — had failed.
“We need three wheels in service to give us the pointing precision to enable us to find planets,” said Bill Borucki, Kepler principal investigator, during a press briefing that day. “Without three wheels, it is unclear whether we could continue to do anything on that order.”
Around the same time, Scott Hubbard — a consulting professor of aeronautics and astronautics at Stanford’s School of Engineering — wrote an online Q&A about Kepler’s recovery process. He emphasized the potential loss, although sad, is not devastating to the science.
“The science returns of the Kepler mission have been staggering and have changed our view of the universe, in that we now think there are planets just about everywhere,” he wrote.
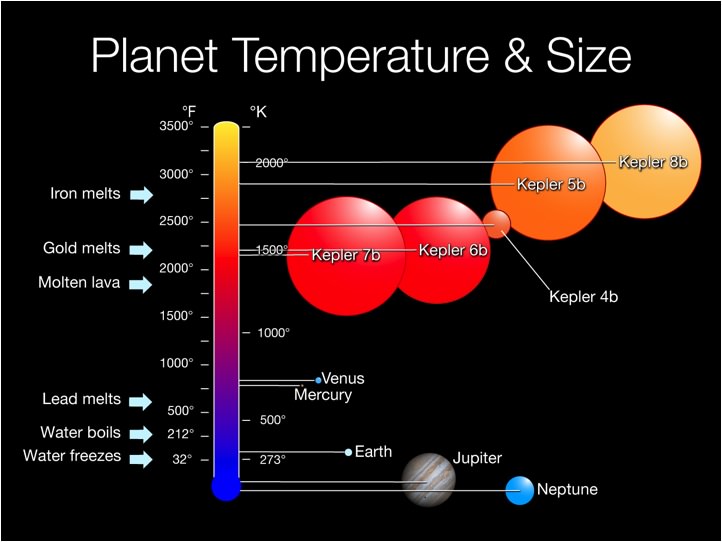
“It will be very sad if it can’t go on any longer, but the taxpayers did get their money’s worth. Kepler has, so far, detected more than 2,700 candidate exoplanets orbiting distant stars, including many Earth-size planets that are within their star’s habitable zone, where water could exist in liquid form.” (You can read about some of Kepler’s more unusual finds here.)

NASA made several attempts to resurrect the wheels. On July 18, team members tested reaction wheel four, which spun in a counterclockwise direction but would not budge in the clockwise direction. Four days later, a test with reaction wheel two showed it moving well to the test commands in both directions.
“Over the next two weeks, engineers will review the data from these tests and consider what steps to take next,” mission manager Roger Hunter said. “Although both wheels have shown motion, the friction levels will be critical in future considerations. The details of the wheel friction are under analysis.”
Mission managers successfully spun reaction wheel 4 in both directions on July 25, an Aug. 2 update said. While warning that friction could affect the usability of the wheels in the long term, the team expressed optimism as more tests continued.
“With the demonstration that both wheels will still move, and the measurement of their friction levels, the functional testing of the reaction wheels is now complete,” Hunter wrote in the update, the last one to go out before Thursday’s press conference.”The next step will be a system-level performance test to see if the wheels can adequately control spacecraft pointing.”
That was expected to begin Aug. 8. You can read more technical details of the tests here. Those tests, however, showed that the friction built up beyond what the spacecraft could handle. Kepler entered safe mode, it was recovered, and it is now essentially in standby awaiting more instructions.
Meanwhile, probing the data Kepler produced thus far is still revealing new planetary candidates. The current count is now 3,548 — an increase from the approximately 2,700 quoted in May — even though Kepler was sidelined in the intervening time.
There’s also a follow-up spacecraft planned: the Transiting Exoplanet Survey Satellite, which is expected to start around 2017 or 2018. It will look for alien planets in the brightest and closest stars in the entire sky, in locations that are (in relative terms) close to Earth.
Hubble Looks Back In Time To See Shape Of Galaxies 11 Billion Years Ago
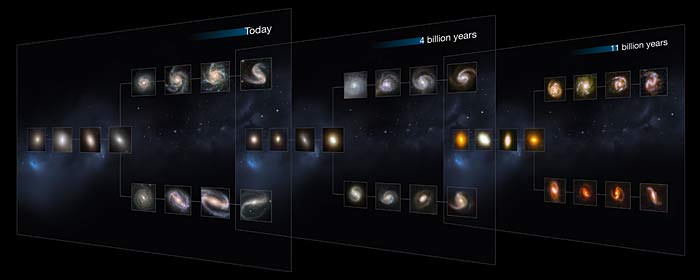
What we’re gonna’ do here is go back. Way back into time. Back to when the only thing that existed was… galaxies? When astronomers employed the power of Hubble’s CANDELS survey to observe different galaxy types from the distant past, they expected to see a variety of spiral, elliptical, lenticular and peculiar structures, but what they didn’t expect was that things were a whole lot more “peculiar” a long time ago!
Known as the Hubble Sequence, astronomers use this classified system for listing galaxy sizes, shapes and colors. It also arranges galaxies according to their morphology and star-forming activity. Up to the present, the Hubble Sequence covered about 80% of the Universe’s history, but the latest information shows that the sequence was valid as much as 11 billion years ago! Out of what we currently know, there are two dominant galaxy types – spiral and elliptical – with the lenticular structure as a median. Of course, this is constrained to the regions of space which we can readily observe, but how true did the sequence hold back when the Universe theoretically began?
“This is a key question: when and over what timescale did the Hubble Sequence form?” says BoMee Lee of the University of Massachusetts, USA, lead author of a new paper exploring the sequence. “To do this you need to peer at distant galaxies and compare them to their closer relatives, to see if they too can be described in the same way.”
Using the Hubble Space Telescope, astronomers took on the sequence challenge to peer back 11 billion years in time to study galaxy structure. Up until now, researchers could confirm the sequence was valid as long ago as 8 billion years, but these new studies pushed CANDELS, the Cosmic Assembly Near-infrared Deep Extragalactic Legacy Survey, to the outer limits. It is simply the largest project ever, and soaked up 902 assigned orbits of observing time. Using the WFC3 and ACS cameras, the team examined structures that existed less than one billion years after the Big Bang. While earlier studies had aimed for lower-mass galaxies in this era, no study had really taken on serious observation of mature structures – ones similar to our own galaxy. Now the new CANDELS observations show us that all galaxies, regardless of size, fit into a totally different classification!
“This is the only comprehensive study to date of the visual appearance of the large, massive galaxies that existed so far back in time,” says co-author Arjen van der Wel of the Max Planck Institute for Astronomy in Heidelberg, Germany. “The galaxies look remarkably mature, which is not predicted by galaxy formation models to be the case that early on in the history of the Universe.”
Just what did this study see that’s so different? Just the power of two. Galaxies were either complex, with blue star forming regions and irregular structures, or they were like our nearby neighbors: massive red galaxies that exhibit no new star-formation. In the early Universe, galaxies like the Milky Way were uncommon. With so little to study, it was nearly impossible to get a large enough sample to sufficiently catalog their characteristics. Early research could only peer back in visible light, a format which emphasized star formation and revealed the red-shifted ultraviolet emission of the galaxies. This information was inconclusive because galaxy structure appeared disrupted and unlike the formations we see near to us. Through the use of infra-red, astronomers could observe the now red-shifted massive galaxies in their visible rest frame. Thanks to CANDELS lighting the way, astronomers were able to thoroughly sample a significantly larger amount of mature galaxies in detail.
“The huge CANDELS dataset was a great resource for us to use in order to consistently study ancient galaxies in the early Universe,” concludes Lee. “And the resolution and sensitivity of Hubble’s WFC3 is second to none in the infrared wavelengths needed to carry out this study. The Hubble Sequence underpins a lot of what we know about how galaxies form and evolve — finding it to be in place this far back is a significant discovery.”
Original Story Source: ” Hubble Explores the Origins of Modern Galaxies” – Hubble News Release.