Missing Black Holes

Artists concept of a black hole.

[/caption]

As astronomers began working out how stars die, they expected that the mass of remnants, whether white dwarfs, neutron stars, or black holes, should be essentially continuous. In other words, there should be a smooth distribution of remnant masses from a fraction of a solar mass, up to nearly 100 times the mass of the sun. Yet observations have shown a distinct lack of objects at the borderline of neutron stars and black holes weighing 2-5 solar masses. So where have they all gone and what might this imply about the explosions that create such objects?

The gap was first noted in 1998 and was originally attributed to a lack of observations of black holes at the time. But in the past 13 years, the gap has held up.

In an attempt to explain this, a new study has been conducted by a team of astronomers led by Krzystof Belczynski at Warsaw University. Following the recent observations, the team assumed the paucity was not caused by a lack of observations or selection effect, but rather, there simply weren’t many objects in this mass range.

Instead, the team looked at the engines of supernovae that would create such objects. Stars less than ~20 solar masses are expected to explode into supernovae, leaving behind neutron stars, while ones greater than 40 solar masses should collapse directly into black holes with little to no fanfare. Stars between these ranges were expected to fill this gap of 2-5 solar mass remnants.

The new study proposes that the gap is created by a fickle switch in the supernova explosion process. In general, supernovae occur when the cores are filled with iron which can no longer create energy through fusion. When this happens, the pressure supporting the star’s mass disappears and the outer layers collapse onto the immensely dense core. This creates a shockwave which is reflected by the core and rushes outwards, slamming into more collapsing material and creates a stalemate, where the outwards pressure balances the infalling material. For the supernova to proceed, that outwards shockwave needs an extra boost.

While astronomers disagree on exactly what might cause this revitalization, some suggest that it is generated as the core, superheated to hundreds of billions of degrees, emits neutrinos. Under normal densities, these particles travel right past most matter, but in the superdense regions inside the supernova, many are captured, reheating the material and driving the shockwave back out to create the event we observe as a supernova.

Regardless of what causes it, the team suggests that this point is critical for the final mass of the object. If it explodes, much of the mass of the progenitor will be lost, pushing it towards a neutron star. If it fails to push outwards, the material collapses and enters the event horizon, piling on mass and driving the final mass upwards. It’s an all or nothing moment.

And moment is a good description of how fast this occurs. At most, astronomers suggest that this interplay between the outwards shock and the inwards collapse takes a single second. Other models place the timescale at a tenth of a second. The new study notes that the more quickly the decision takes place, the more pronounced the gap is in the resulting objects. As such, the fact that the gap exists may be taken as evidence for this being a split second decision.

Early Galaxies – Clearing The “Cosmic Fog”

Scientists have used ESO’s Very Large Telescope to probe the early Universe at several different times as it was becoming transparent to ultraviolet light. This brief but dramatic phase in cosmic history — known as reionisation — occurred around 13 billion years ago. By carefully studying some of the most distant galaxies ever detected, the team has been able to establish a timeline for reionisation for the first time. They have also demonstrated that this phase must have happened quicker than astronomers previously thought.

[/caption]

The seasons are changing for both hemispheres and it’s not uncommon to wake up to wonderful, mysterious swirls of fog. What we experience here on Earth is water vapor, but the Universe was once filled with a fog of hydrogen gas. As the hours progress, the Sun slowly burns it off – quietly revealing trees, houses and the road ahead. In time after expansion began, the electrically neutral hydrogen gas was slowly swept away by the light of ultraviolet radiation from early galaxies…

Using the Very Large Telescope (VLT) like a “time machine”, a team of astronomers cut through the cosmic cloud layer to view some of the most distant galaxies recorded so far – a look back between 780 million and a billion years after the Big Bang. These antediluvian galaxies excited the gas, making it electrically charged (ionised), it gradually became transparent to ultraviolet light. While you may argue this process is technically known as reionization, there is theorized to be a brief timeline when hydrogen was also ionised.

“Archaeologists can reconstruct a timeline of the past from the artifacts they find in different layers of soil. Astronomers can go one better: we can look directly into the remote past and observe the faint light from different galaxies at different stages in cosmic evolution,” explains Adriano Fontana, of INAF Rome Astronomical Observatory who led this project. “The differences between the galaxies tell us about the changing conditions in the Universe over this important period, and how quickly these changes were occurring.”

As we know from spectroscopy, each element has its own signature – the emission lines – and the strongest in ultraviolet is the Lyman-alpha line generated from hydrogen. This bold spectral signature is easily recognizable – even at a vast distance. By observing the Lyman-alpha line for five very remote galaxies, the team was able to establish two critical factors: their distance through redshift and how soon they could be detected. Through this process, the astronomers were then able to establish how much the Lyman-alpha emission was reabsorbed by the neutral hydrogen fog and create a timeline… A whole lot like recording what minute each landmark reappears when terrestrial fog clears and seeing the long road ahead.

“We see a dramatic difference in the amount of ultraviolet light that was blocked between the earliest and latest galaxies in our sample,” says lead author Laura Pentericci of INAF Rome Astronomical Observatory. “When the Universe was only 780 million years old this neutral hydrogen was quite abundant, filling from 10 to 50% of the Universe’ volume. But only 200 million years later the amount of neutral hydrogen had dropped to a very low level, similar to what we see today. It seems that reionization must have happened quicker than astronomers previously thought.”

As always, there’s a bit more to the story. In this case, by understanding the rate at which the ancient absorbent obstruction began fading, scientists could also deduce the source of the powerful ultraviolet radiation. Could it be first generation stars – or even the work of primeval black holes?

“The detailed analysis of the faint light from two of the most distant galaxies we found suggests that the very first generation of stars may have contributed to the energy output observed,” says Eros Vanzella of the INAF Trieste Observatory, a member of the research team. “These would have been very young and massive stars, about five thousand times younger and one hundred times more massive than the Sun, and they may have been able to dissolve the primordial fog and make it transparent.”

To prove anything, it’s going to take a lot more research and some very accurate measurements – ones that are already in the planning stage for the future ESO European Extremely Large Telescope. But, in the meantime, the team used the great light-gathering power of the 8.2-metre VLT to carry out spectroscopic observations, targeting galaxies first identified by the NASA/ESA Hubble Space Telescope and in deep images from the VLT.

Original Story Source: ESO Press Release. For Further Reading: Probing The Earliest Galaxies And The Epoch Of Reionization.

Free Range Brown Dwarfs

Brown dwarfs in the young star cluster NGC 1333. This photograph combines optical and infrared images taken with the Subaru Telescope. Brown dwarfs newly identified by the SONYC Survey are circled in yellow, while previously known brown dwarfs are circled in white. The arrow points to the least massive brown dwarf known in NGC 1333; it is only about six times heftier than Jupiter. Credit: SONYC Team/Subaru Telescope

[/caption]

Using two of the world’s largest optical-infrared telescopes, the Subaru Telescope in Hawaii and the Very Large Telescope (VLT) in Chile, an international team of astronomers has discovered more than two dozen brown dwarf stars floating around in two galactic clusters. During the Substellar Objects in Nearby Young Clusters (SONYC) survey, these “failed stars” came to their attention by showing up in extremely deep images of the NGC 1333 and rho Ophiuchi star clusters at both optical and infrared wavelengths. To make the findings even more exciting, these stellar curiosities outnumbered the “normal” stars in one cluster!

“Our findings suggest once again that objects not much bigger than Jupiter could form the same way as stars do. In other words, nature appears to have more than one trick up its sleeve for producing planetary mass objects,” says Professor Ray Jayawardhana, Canada Research Chair in Observational Astrophysics at the University of Toronto and leader of the international team. Their discovery will be published in two upcoming papers in the Astrophysical Journal and will be presented this week at a scientific conference in Garching, Germany.

Spectra of several brown dwarfs in the young star cluster NGC1333, taken with the FMOS instrument on the Subaru Telescope. The spectra show a characteristic peak around 1670nm. Water steam in a brown dwarf's atmosphere absorbs radiation on both sides of the peak. The plot shows that the strength of the water absorption increases in cooler objects (from 3000 to 2200K). FMOS allows astronomers to take spectra for many objects simultaneously, a crucial advantage for the SONYC Survey. Credit: SONYC Team/Subaru Telescope

Using spectroscopy, the researchers were able to separate candidate brown dwarfs by their red color. But there’s more to the story than just hues. In this case, it’s the identification of one that’s only about six times more massive than Jupiter. Located in NGC 1333, it is the smallest known free-floating object to date. What does that mean? “Its mass is comparable to those of giant planets, yet it doesn’t circle a star. How it formed is a mystery,” said Aleks Scholz of the Dublin Institute for Advanced Studies in Ireland, lead author of the first paper.

Brown dwarfs are indeed unusual. They walk a fine line between planet and star – and may have once been in stellar orbit, only to be ejected at some point in time. But in this circumstance, all of the brown dwarfs found in this particular cluster have very low mass – only about twenty times that of Jupiter. “Brown dwarfs seem to be more common in NGC 1333 than in other young star clusters. That difference may be hinting at how different environmental conditions affect their formation,” said Koraljka Muzic of the University of Toronto in Canada, lead author of the second paper.

“We could not have made these exciting discoveries if not for the remarkable capabilities of Subaru and the VLT. Instruments that can image large patches of the sky and take hundreds of spectra at once are key to our success,” said Motohide Tamura of the National Astronomical Observatory of Japan.

Free-range brown dwarfs? I’ll take mine over easy…

Original Story Source: Subaru Telescope News.

What is Vision? (A Save The James Webb Support Video)

Promotional poster supporting the JWST

Do you love astronomy? Do you appreciate science? Do you have a curiosity about the nature of our Universe, how it came to be and what our place is within it? If you are even reading this I assume your answers to all of those questions is a resounding “yes!” and so I present to you an excellent video created by Brad Goodspeed in support of the James Webb Space Telescope:

“I made Vision because I thought the argument for science could benefit from a passionate delivery,” Brad told Universe Today. “Deep down we’re all moved by the stars, and that passion needs to be expressed by methods outside of science’s typical toolbox.”

[/caption]

Funding for this next-generation telescope is currently on the line in Washington. While a markup bill was passed last month by the House of Representatives that allows for continued funding of the JWST through to launch, it has not yet been ratified by Congress. It’s still very important to maintain support for the JWST by contacting your state representatives and letting them know that the future of space exploration is of concern to you.

A petition against the defunding of the JWST is currently active on Change.org and needs your signature (if you haven’t signed it already.) Signing ends at midnight tonight so be sure to click here to sign and pass it along as well! (You can share this shortened link on Twitter, Facebook, etc.: http://chn.ge/oy4ibI)

You can also show your support and follow the JWST progress by following Save the James Webb Space Telescope on Facebook and on saveJWST.com.

The JWST will be the premier observatory of the next decade, serving thousands of astronomers worldwide. It will study every phase in the history of our Universe, ranging from the first luminous glows after the Big Bang, to the formation of solar systems capable of supporting life on planets like Earth, to the evolution of our own Solar System. It is currently aiming for a 2018 launch date.

“We don’t get to the future by yielding to our most current fears… by being shortsighted.”

Video courtesy of Brad Goodspeed.

Abuse From Other Universes – A Second Opinion

Concentric circles interpreted as bruises from collisions with alternate universes. Image Credit: Feeney et al.

[/caption]

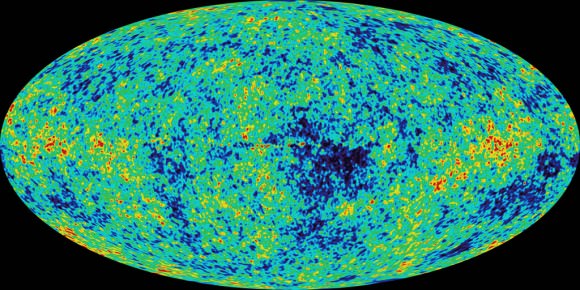
At the end of last year, there was a flurry of activity from astronomers Gurzadyan and Penrose that considered the evidence of alternate universes or the existence of a universe prior to the Big Bang and suggested that such evidence may be imprinted on the cosmic microwave background as bruises of concentric circles. Quickly, this was followed by an announcement claiming to find just such circles. Of course, with an announcement this big, the statistical significance would need to be confirmed. A recent paper in the October issue of the Astrophysical Journal provides a second opinion.

The review was conducted by Amir Hajian at the Canadian Institute for Theoretical Astrophysics. To conduct the study, Hajian selected a large number of circles, similar to the ones reported in the previous studies and asked what the probability was that, randomly, the “edge” of the circles would contain hot-spots, similar to the ones predicted. These were then compared to the bruises reported by the other teams by examining their “variance” which is how much the points on the perimeter were spread around the average temperature.

Hajian notes that, with the resolution considered it would be possible to consider some 5 million circles. The results of his comparison demonstrated that it would be expected that some 0.3% of those should have features similar to the ones reported previously. With so many possibilities, this would imply that some 15,000 potential circles could be flagged as candidates for these cosmic bruises. Even the “best” candidate proposed in the Gurzadyan and Penrose study should still exist statistically.

As such, Hajian concludes that the features Gurzadyan and Penrose reported were not statistically anomalous. Hajian does not comment directly on Feeney et al.’s detection, but given theirs were constructed in a similar manner, it should be expected that they are similarly statistically insignificant. It would appear that if the fingerprints of other universes are embedded in the sky, they have been lost in the noise.

Did The Draconids Perform?

Draconid Meteor Over Somerset UK Credit: Will Gater www.willgater.com

[/caption]

After weeks of speculation of its intensity, the Draconid/Giacobond meteor shower finally arrived. Some astronomers predicted that this normally quiet meteor shower would deliver up to 1000 meteors per hour at its peak – Were they right?

At approximately 20:00 BST (21:00 UT) on October 8th 2011 the shower started in earnest and many in the UK and Europe looked forward to an evening of meteor watching.

Unfortunately, many people were under thick clouds and missed the display, but there were a few places where the clouds cleared and observers were treated to a memorable spectacle.

I have done many meteorwatch evenings in the past, but this one got exciting very quickly and the uncertainty of the amount of meteors was soon doused.

Many people including myself were popping outside and trying to glimpse meteors through the clouds, but most of the time the Meteorwatch Meteor Live View was being used.

Everything was fairly sedate apart from us all moaning about the weather, but then all of a sudden at approximately 20:30 BST (19:30 UT) The Meteor Live View app on the Meteorwatch website went crazy!

Meteor Live View Credit: meteorwatch.org/ Norman Lockyer Observatory UK

Many people started to get good breaks in the clouds including myself and there were reports of dozens of meteors in just a few short minutes, much to the envy and disappointment of those still clouded over.

At this time the International Meteor Organisation (IMO) reported observations of just over 300 meteors per hour (319 ZHR).

The evening continued and to everybody’s delight (to those who could see meteors), there were many. I saw 3 within a couple of seconds and this continued for about an hour.

Eventually rates started to decline, people saw less and the Meteor Live View started to show less activity.

At approximately 22:00 BST (21:00 UT) meteor activity dropped substantially – The show was over!

The IMO results were posted on their website with rates of just under 350 meteors per hour at the peak of the shower, reported by their observing stations.

Credit: IMO

Did the Dracondids/ Giacobonids live up to expectations in the end? I would say yes, a fairly heavy meteor shower, maybe it could be called a mini storm!

What Would Earth Look Like from a Distant Star?

The "pale blue dot" of Earth captured by Voyager 1 in Feb. 1990 (NASA/JPL)

As the number of discovered extrasolar planets grows, astronomers begin looking at the next step: finding rocky Earth-like planets. In addition, astronomers would ideally like to block out the parent star and detect some of the reflected glow from the planet’s atmosphere in an attempt to characterize the chemical makeup. But what would an “Earth-like” planet’s reflected light look like? To answer this, a new paper explores what Earth should have looked like at various points in our planet’s history.

Currently, astronomers have a good understanding on how our planet reflects light. Even before satellites were launched that could observe this directly, we could see the reflected light from our home on the moon, an effect known as “Earthshine”. The amount of light reflected depends on what’s on the surface.

The paper considers five different types of reflecting materials. Water and vegetation tend to be strong absorbers of light at visible and ultraviolet wavelengths whereas ice and deserts are highly reflective. The amount of cloud cover, which also reflects a good deal of light, is the fifth.

With the modern Earth, our planet currently reflects about 32% of all incoming light. This changes by a few percent depending on the season, depending mostly on the amount of cloud cover.

This new study also analyzes what the amount of reflected light should have been for Earth, known as its albedo, during four other historical periods: the Late Cretaceous (90 million years ago), the Late Triassic (230 My ago), the Mississippian (340 My ago), and the Late Cambrian (500 My ago).

Using simulations based on the various surface features, the team from the Instituto de Astrofísica de Canarias owned by Spain, the team reconstructed the expected amount of cloud cover for these various epochs to consider their contributions to the overall albedo.

In general, the historical periods had strikingly similar amounts of reflectiveness due to “similar ocean-land-vegitation distribution” as well as similar distributions of continents between hemispheres and most deserts in low latitudes. The exception to this, was the Late Cambrian. While the average was only slightly higher, this period varied depending on which portion of the Earth was viewed.

At that time, the original supercontinent, Pangea was in the process of breaking up. They were still clustered and almost exclusively in the southern hemisphere. The sea levels were also significantly higher meaning a larger portion of land was submerged, covered by the non-reflective water. Lastly, most of the life was still concentrated in the oceans. Since it had not yet advanced to land, it is expected that the surface was mostly rocky desert terrain which would have high reflectivity. During the times when the breaking up supercontinent was facing an observer, the albedo would jump to as much as 37% only to sink to 32% when it rotated from view.

The team suggests that such a variation may allow astronomers to determine the rotation rates of planets in the future. In an ideal situation, it may even give clues to the geographical arrangement of continents.

Planetary Pinball – Uranus Gets The “Tilt”

Between 3 to 4 billion years ago, a body twice the size of Earth impacted Uranus, knocking the ice giant onto its side. Image Credit: Jacob A. Kegerreis/Durham University
Near-infrared views of Uranus reveal its otherwise faint ring system, highlighting the extent to which it is tilted. Credit: Lawrence Sromovsky, (Univ. Wisconsin-Madison), Keck Observatory.

[/caption]

Popular theory on how Uranus ended up with a highly eccentric axis has always been pretty standard – one giant blow. However, at today’s (October 6) EPSC-DPS Joint Meeting in Nantes, astronomers are thinking things may have occurred slightly differently. Instead of a singular impact, the glowing blue-green gas giant may have been the victim of a series of smaller punches.

At a 98 degree inclination, Uranus and its satellites have always been somewhat of a mystery to planetary scientists. While many of the Solar Systems planets have an inclined axis, none can compare with nearly being on its side. It has always been popular conjecture that Uranus was plastered that way at some point in its evolution by a body a few times larger than Earth. While this seems plausible, only one hole remains in the theory. Why did its moons take on the same inclination instead of staying in their original position?

This long-standing puzzle may have been solved by an international team of scientists led by Alessandro Morbidelli (Observatoire de la Cote d’Azur in Nice, France). Their theory relies on computer modeling – and the thought the impact might have occurred while Uranus was still forming. If the simulations are correct and the strike happened when the planet was still surrounded by a protoplanetary disk, ” the disk would have reformed into a fat doughnut shape around the new, highly-tilted equatorial plane. Collisions within the disk would have flattened the doughnut, which would then go onto form the moons in the positions we see today.”

But that’s not a neat answer. Just like throwing a tilt into pinball, the game changes. In this new scheme, the moons displayed retrograde motion – precisely the opposite of the way things are now. So what’s a player to do? Change the game again by re-arranging the parameters. By adding multiple strikes to Uranus – instead of just one large – the satellites now behave as we observe them.

Of course, when you “tilt” the game is over, and the new research doesn’t jive with current theories of planetary formation. This may mean re-writing the rules again. Morbidelli elaborates: “The standard planet formation theory assumes that Uranus, Neptune and the cores of Jupiter and Saturn formed by accreting only small objects in the protoplanetary disk. They should have suffered no giant collisions. The fact that Uranus was hit at least twice suggests that significant impacts were typical in the formation of giant planets. So, the standard theory has to be revised.”

That deaf, dumb and blind kid… Sure plays a mean pinball!

Original Story Source: Europlanet News Release.

World Space Week ( Oct 4th – 10th ) — Join the Fun!

World Space Week - October 4th - 10th, 2011. Image Credit: World Space Week Association

[/caption]

What is World Space Week?

Founded in 1981, World Space Week Association is one of the world’s oldest space education organizations. As a partner of the United Nations in the global coordination of World Space Week, WSWA recruits and supports a worldwide network of coordinators and participants. WSWA is a non-government, nonprofit, international organization, based in the United States.

World Space Week is an international celebration of science and technology, and how each benefits the human condition. In 1999 The United Nations General Assembly declared that World Space Week will be held each year from October 4-10, commemorating two notable space-related events:

The annual kick-off date of October 4th corresponds with the October 4th 1957 launch of the first human-made Earth satellite, Sputnik 1.

The end date of October 10th corresponds with the October 10th 1967 signing of the Treaty on Principles Governing the Activites of States in the Exploration and Peaceful Uses of Outer Space, including the Moon and Other Celestial Bodies.

Here’s some information from their F.A.Q on how you can participate in World Space Week, either by volunteering or by attending an event.

Where and how is World Space Week celebrated?

World Space Week is open to everyone – government agencies, industry, non-profit organizations, teachers, or even individuals can organize events to celebrate space. WSW is coordinated by the United Nations with the support of WSWA and local coordinators in many countries.

What are the benefits of World Space Week?

WSW educates people around the world about the benefits they receive from space and encourages greater use of space for sustainable economic development. WSW also demonstrates public support for space programs and excites children about learning and their future.
Some of the other benefits include promoting institutions around the world that are involved in space and fostering a sense of international cooperation in space outreach and education.

How can schools participate?

This event is ideal for teachers to promote student interest in science and math. To encourage participation, World Space Week Association gives various educational awards each year.

Sign at NASA's Johnson Space Center announcing World Space Week. Photo Credit: NASA/WSWA

What can I do for World Space Week?

If you’d like to become involved with WSW you can:

  • Volunteer for World Space Week Association
  • Organize an event directly
  • Help expand and coordinate World Space Week
  • Encourage teachers and students to do space-related activities
  • Become a Volunteer
  • Hold an Event During World Space Week
  • If you hold an event, be sure to add your event to the World Space Week calendar and tell the media and your regional WSW coordinator about your planned event. You can also order World Space Week posters and display them in your community.

    If you’d like to find a World Space Week event in your area, visit:http://www.worldspaceweek.org/calendar_2011.php

    You can learn more about World Space Week at: http://www.worldspaceweek.org

    Source: World Space Week Association

    High Precision Study of Exoplanet WASP 10b

    SuperWasp Cameras. Credit: SuperWASP project & David Anderson

    [/caption]

    Originally discovered by the Wide Angle Search for exoPlanets (WASP) survey in 2008, the eclipsing exoplanet WASP 10b has been reluctant to allow its properties to be pinned down. While its mass has been pinned down by two independent groups to right around 3 times the mass of Jupiter, the radius and thus, the overall density which gives hints at the composition, has been harder to determine. Groups have also reported oddities in the timing of the eclipses that may hint at the presence of another planets whose gravitational tug is changing the orbit of 10b. A new study attempts to answer these questions with high precision observations from the Spanish 2.2 meter Calar Alto Observatory.

    The new study, led by astronomers from Nicolaus Copernicus University in Poland, is the first of WASP 10b to take into account the effects of star spots. Since the host star is a K-dwarf such spots should be common. When such spots are present, the planet can eclipse them as well, making the overall brightness increase temporarily. This apparent change in the brightness of the star makes small changes in how astronomers would determine the overall brightness of the star. This brightness is used to determine the properties of the star, such as its radius, which also factor into determining the radius of the planet. As such, these spots should be taken into account for the most accurate understanding possible.

    The team observed four transits of the planet in late 2010. In that time, star spots were present for three of the four transits. With the spots subtracted out, the team agreed with previous estimates of mass, but found an even lower value for the radius than either of the previous studies. Their value was only a few percent wider than Jupiter despite being three times as massive. While this doesn’t make WASP 10b most dense planet known, it does rank among the top contenders.

    These results have implications for how planets may form in general. Since WASP 10 is estimated to be a relatively young star, it would imply that the major planet formed a rocky core early on and that it wasn’t deposited later through collisions. The team estimates that it would require a total mass for the core of roughly 300-400 times the mass of Earth.

    When the team added their new data to previous studies of the system, they found that the timing of the transits have continued to change and these changes could not be the product of other effects, such as star spots on the limb of the star altering the shape of the light curve. As such, they note that “this finding supports a scenario in which the second planet perturbs the orbital motion of WASP 10b.”