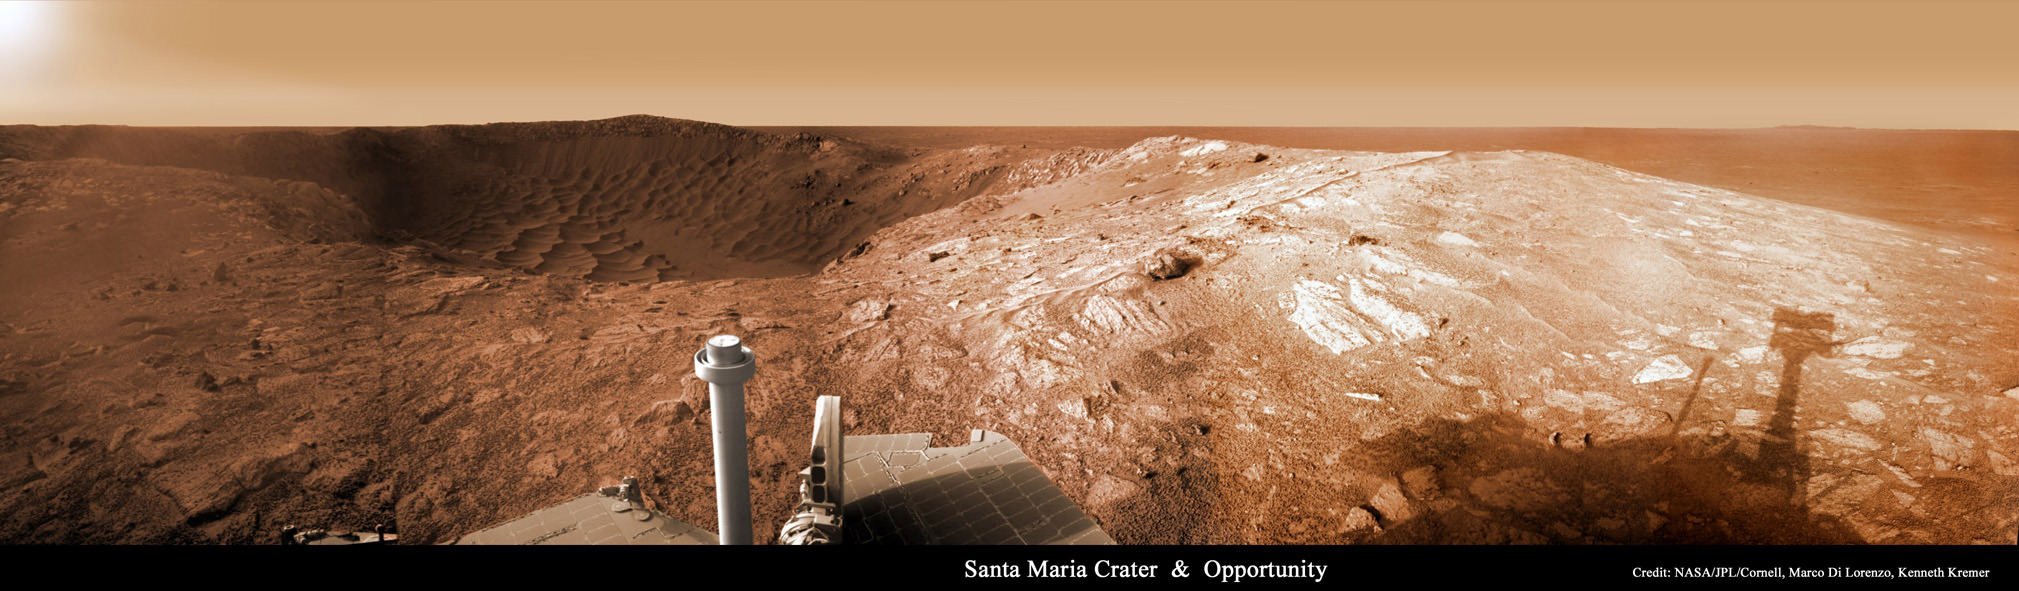
Opportunity at Santa Maria Crater Credit: Mars Exploration Rover Mission, NASA, JPL, Cornell; Image Processing: Marco Di Lorenzo, Kenneth Kremer
[/caption]
Congrats to Universe Today writer Ken Kremer and his image processing partner Marco Di Lorenzo for their handiwork being featured on today’s Astronomy Picture of the Day. It’s one of their great images they have enhanced of the Opportunity Rover peering into its current location at Santa Maria Crater on Mars. Check it out on APOD!
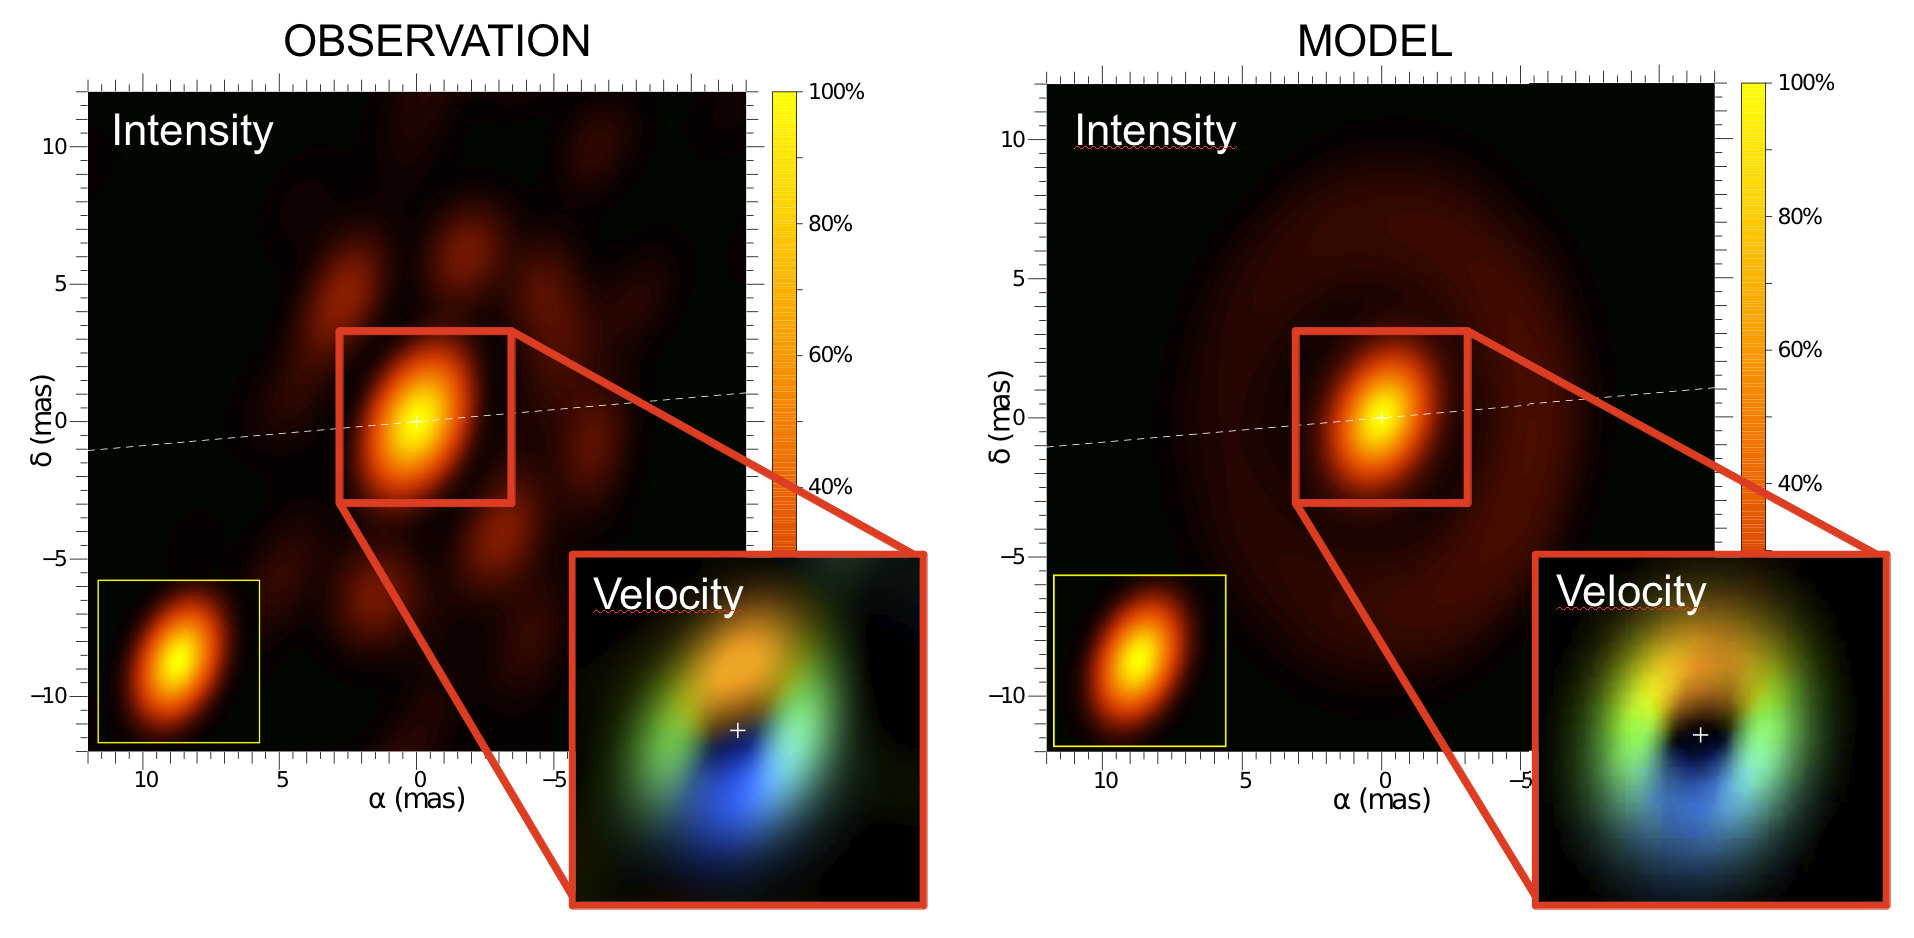
3D images of HD 62623, obtained with the VLTI (left), compared to the model of a rotating disk (right). In the boxes, the gas kinematics is shown (3rd dimension): blue-coloured gas approaches the observer, while red-coloured gas recedes from the observer. The size of the inner gas disk of approx. 2 milli-arcseconds corresponds to 1.3 astronomical units (distance Earth-Sun), while the outer dust ring seen in the images has a radius corresponding to 4 astronomical units, assuming 2100 light years as distance to HD 62623. Images: F. Millour et al.
[/caption]
For several years, astronomers have been trying to get a good look at a peculiar supergiant star that is surrounded by a disk of gas and dust. The star, HD 62623, is one of the very few known supergiant stars to have such a disk. These disks are generally only associated with smaller, young stars, as supergiants have strong stellar winds that would blow away any surrounding plasma and debris. Now, using long-baseline stellar interferometry with the “Amber” instrument at ESO’s Very Large Telescope interferometer, a team of astronomers were able to capture, for the first time, a 3-D view of this strange star and its surrounding environment, which revealed a hidden secret: a companion star is likely responsible for the surrounding disk.
“Thanks to our interferometric observations with Amber we could synthetize a 3-D image of HD 62623 as seen through a virtual 130 m-diameter telescope”, says Florentin Millour, leading author of the study, from Observatoire de la Côte d’Azur. “The resolution is an order of magnitude higher compared with the world’s largest optical telescopes of 8-10 m diameter.”
HD 62623 is an exotic, hot, supergiant star. Supergiants are the most massive stars out there, ranging between 10 to 70 solar masses, and can range in brightness from 30,000 to hundreds of thousands of times the output of our Sun. They have very short lifespans, living from 30 million down to just a few hundred thousand years. Supergiants seem to always detonate as Type II supernovae at the end of their lives.
“Our new 3D image locates the dust-forming region around HD 62623 very precisely, and it provides evidence for the rotation of the gas around the central star,” said co-author Anthony Meilland from Max Planck Institute for Radio Astronomy. “This rotation is found to be Keplerian, the same way the Solar system planets rotate around the Sun.”
The companion star, although not seen directly because its light couldn’t be resolved among the brightness of HD62623, was detected by a central cavity between the gas disk and HD 62623. The companion is thought to be approximately the mass of our Sun, and its presence would explain the exotic characteristics of HD 62623, which has many similar characteristics to a monster among the old stars within our Galaxy, Eta Carinae.
HD 62623 is located in the constellation Cygnus near another bright supergiant, Deneb of the summer triangle. Deneb however, like most other supergiants, has no surrounding disk.
Four domes of the 1.8 m Auxiliary Telescopes (AT), utilized for the Very Large Telescope Interferometer (VLTI). ESO, Cerro Paranal, Chile. Image: F. Millour, OCA, Nice, France.
The images obtained with the Amber instrument combines spatial and velocity information, showing not only the shape of the close environment of HD 62623, but also its kinematics or motion. Up to now, the necessary kinematics information was missing in such images.
The astronomers were able to “disentangle” the dust and gas emission in the HD 62623 circumstellar disc, and measure the dusty disc inner rim. They also constrained the inclination angle and the position angle of the major-axis of the disc.
The new 3D imaging technique used by the team is equivalent to integral-field spectroscopy, but gives access to a 15 times larger angular resolution or capacity to detect fine details in the images. “With these new capacities, the VLTI will be able to provide a better comprehension of many sky targets, too small to be resolved by the largest telescopes,” said Millour. “We could aim at young stellar disks or jets, or even the central regions of active galaxies.”
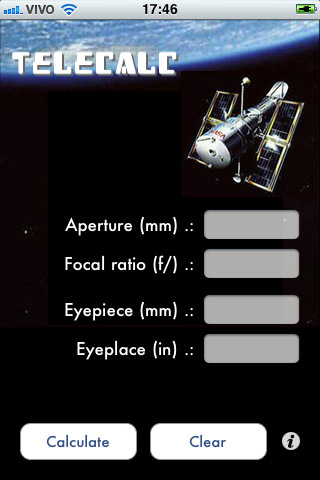
There’s a new observing app for the iPhone, iPod and iPad, called TeleCalc. Enter in two data points about your telescope (aperture and focal ratio) and two about the eyepiece (focal length and diameter) the program calculates angular field of view, best eyepiece magnification, resolution (Dawes, Rayleight), exit pupil, limiting stellar magnitude and light gathering power.
TeleCalc is available in eight languages: English, Spanish, French, Italian, German, Portuguese, Russian and Japanese. Search “TeleCalc” in iTunes to download it or find it on the iTunes store.
Thanks to developer Fabio Rendelucci who has given Universe Today 3 free TeleCalc apps to give away.
The first 3 people to answer the following question will be sent a code for a free TeleCalc app:
To find the magnifying power of any telescope, divide the focal length of the telescope by the focal length of the what other telescope piece?
Hubble images of the Omega Centauri starfield from 2002, left, and from 2009, right.
[/caption]
Classification is key to all sciences, but can often cause debate. Within astronomy, fierce debates have raged over the definition of a planet, both on the low-mass end, as well as the high-mass end. A recent paper explores definitions on a larger scale, pondering the definition of a galaxy, particularly, what separates the smallest of galaxies, the dwarf galaxies, from star clusters.
A working definition for dwarf galaxies was proposed in 1994 based on the brightness of the object in question as well as it’s size. For brightness, the cutoff was taken to be an absolute magnitude (MB) of -16. The size would need to be “more extended than a globular cluster.”
As with many definitions, they seem to work initially, but as new technology became available, objects were discovered around the cutoff line, blurring the distinction. These objects, which were first discovered in the late 90’s, are generally referred to with names like “ultra-faint dwarf spheroidals” (dSphs) and “ultra compact dwarfs” (UCDs). Regarding these small fragments, a 2007 study noted that they may “contain so few stars that they can be fainter than a single bright star and contain less stellar mass than some globular clusters”.
To help reconsider the definition of a galaxy, the authors looked at several commonly used criteria that have been applied (often inconsistently) to these questionable cases previously. This included requirements that the system be gravitationally bound, which would keep stellar streams and other ejected objects from being considered galaxies in their own right. Obviously, most galaxies will slowly bleed away stars due to random interactions, giving rise to hypervelocity stars which will leave the galaxy, so the team proposes a threshold that the galaxy have a “relaxation time” greater than the age of the universe. This would allow dSphs and UCDs to be considered galaxies, but would keep out objects that have generally been considered globular clusters.
Another proposed constraint is based on the size of the object. The team proposes a cutoff where the effective radius be greater than or equal to 100 parsecs. This cutoff would exclude dSphs and UCDs.
The types of stars is another consideration proposed since this can be used to achieve somewhat of an understanding of the history of the object. While clusters usually form in a single instance, galaxies are generally considered to have their own, internal machinations leading to complex stellar populations. Thus, the presence of multiple populations of stars. This would include dSphs and UCDs, but may allow some globular clusters to slip in as well since studies have shown that some of our more massive globular clusters in the Milky Way have interacted with gas clouds, triggering star formation which was absorbed by the clusters.
Dark matter is another criteria that is examined. Since galaxies are proposed to form within dark matter halos and be intrinsically tied into them, the requirement that dark matter be present would fit well with the theory. However, this criteria also poses many difficulties. Firstly, measuring the presence of dark matter in small objects is a challenging task. It is also questionable as to whether or not dSphs and UCDs would contain dark matter as a general rule since their formation is not well understood and the possibility remains that they may have been ejected from our own galaxy during formation and recoalesced, possibly without a dark matter halo.
The last possible criteria is much along the same lines as the nebulous definition for planets that they dominate the local gravitational field. The team considers the possibility that objects would be required to have stellar satellite systems as globular clusters of their own. This would include some dwarf galaxies, but may exclude others.
Even with many of these criteria, classification will still be a treacherous issue. Objects like Omega Centauri may fit some definitions but not others. According to the paper’s lead author, Duncan Forbes, “many amateur astronomers know Omega Cen as massive star cluster, some professional astronomers regard it as a galaxy. This is a stellar system that could be upgraded or downgraded by this exercise, depending on your point of view.”
To help gather opinions on the topic, the authors have set up an online survey to gather opinions on this definition and hope to reach a satisfactory conclusion by collective wisdom. This poll is open to the general public and results will be presented at a future astronomical conferences allowing participants to help take part in the astronomical process. Forbes hopes that this public interaction will help garner public interest in much the same way as the Galaxy Zoo project has.
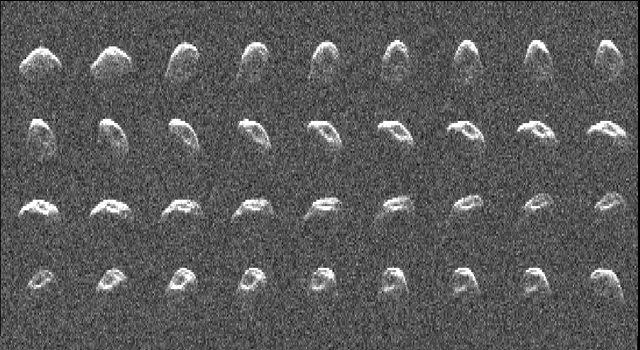
A radar image of asteroid 2010 JL33, generated from data taken by NASA's Goldstone Solar System Radar on Dec. 11 and 12, 2010. Image credit: NASA/JPL-Caltech
[/caption]
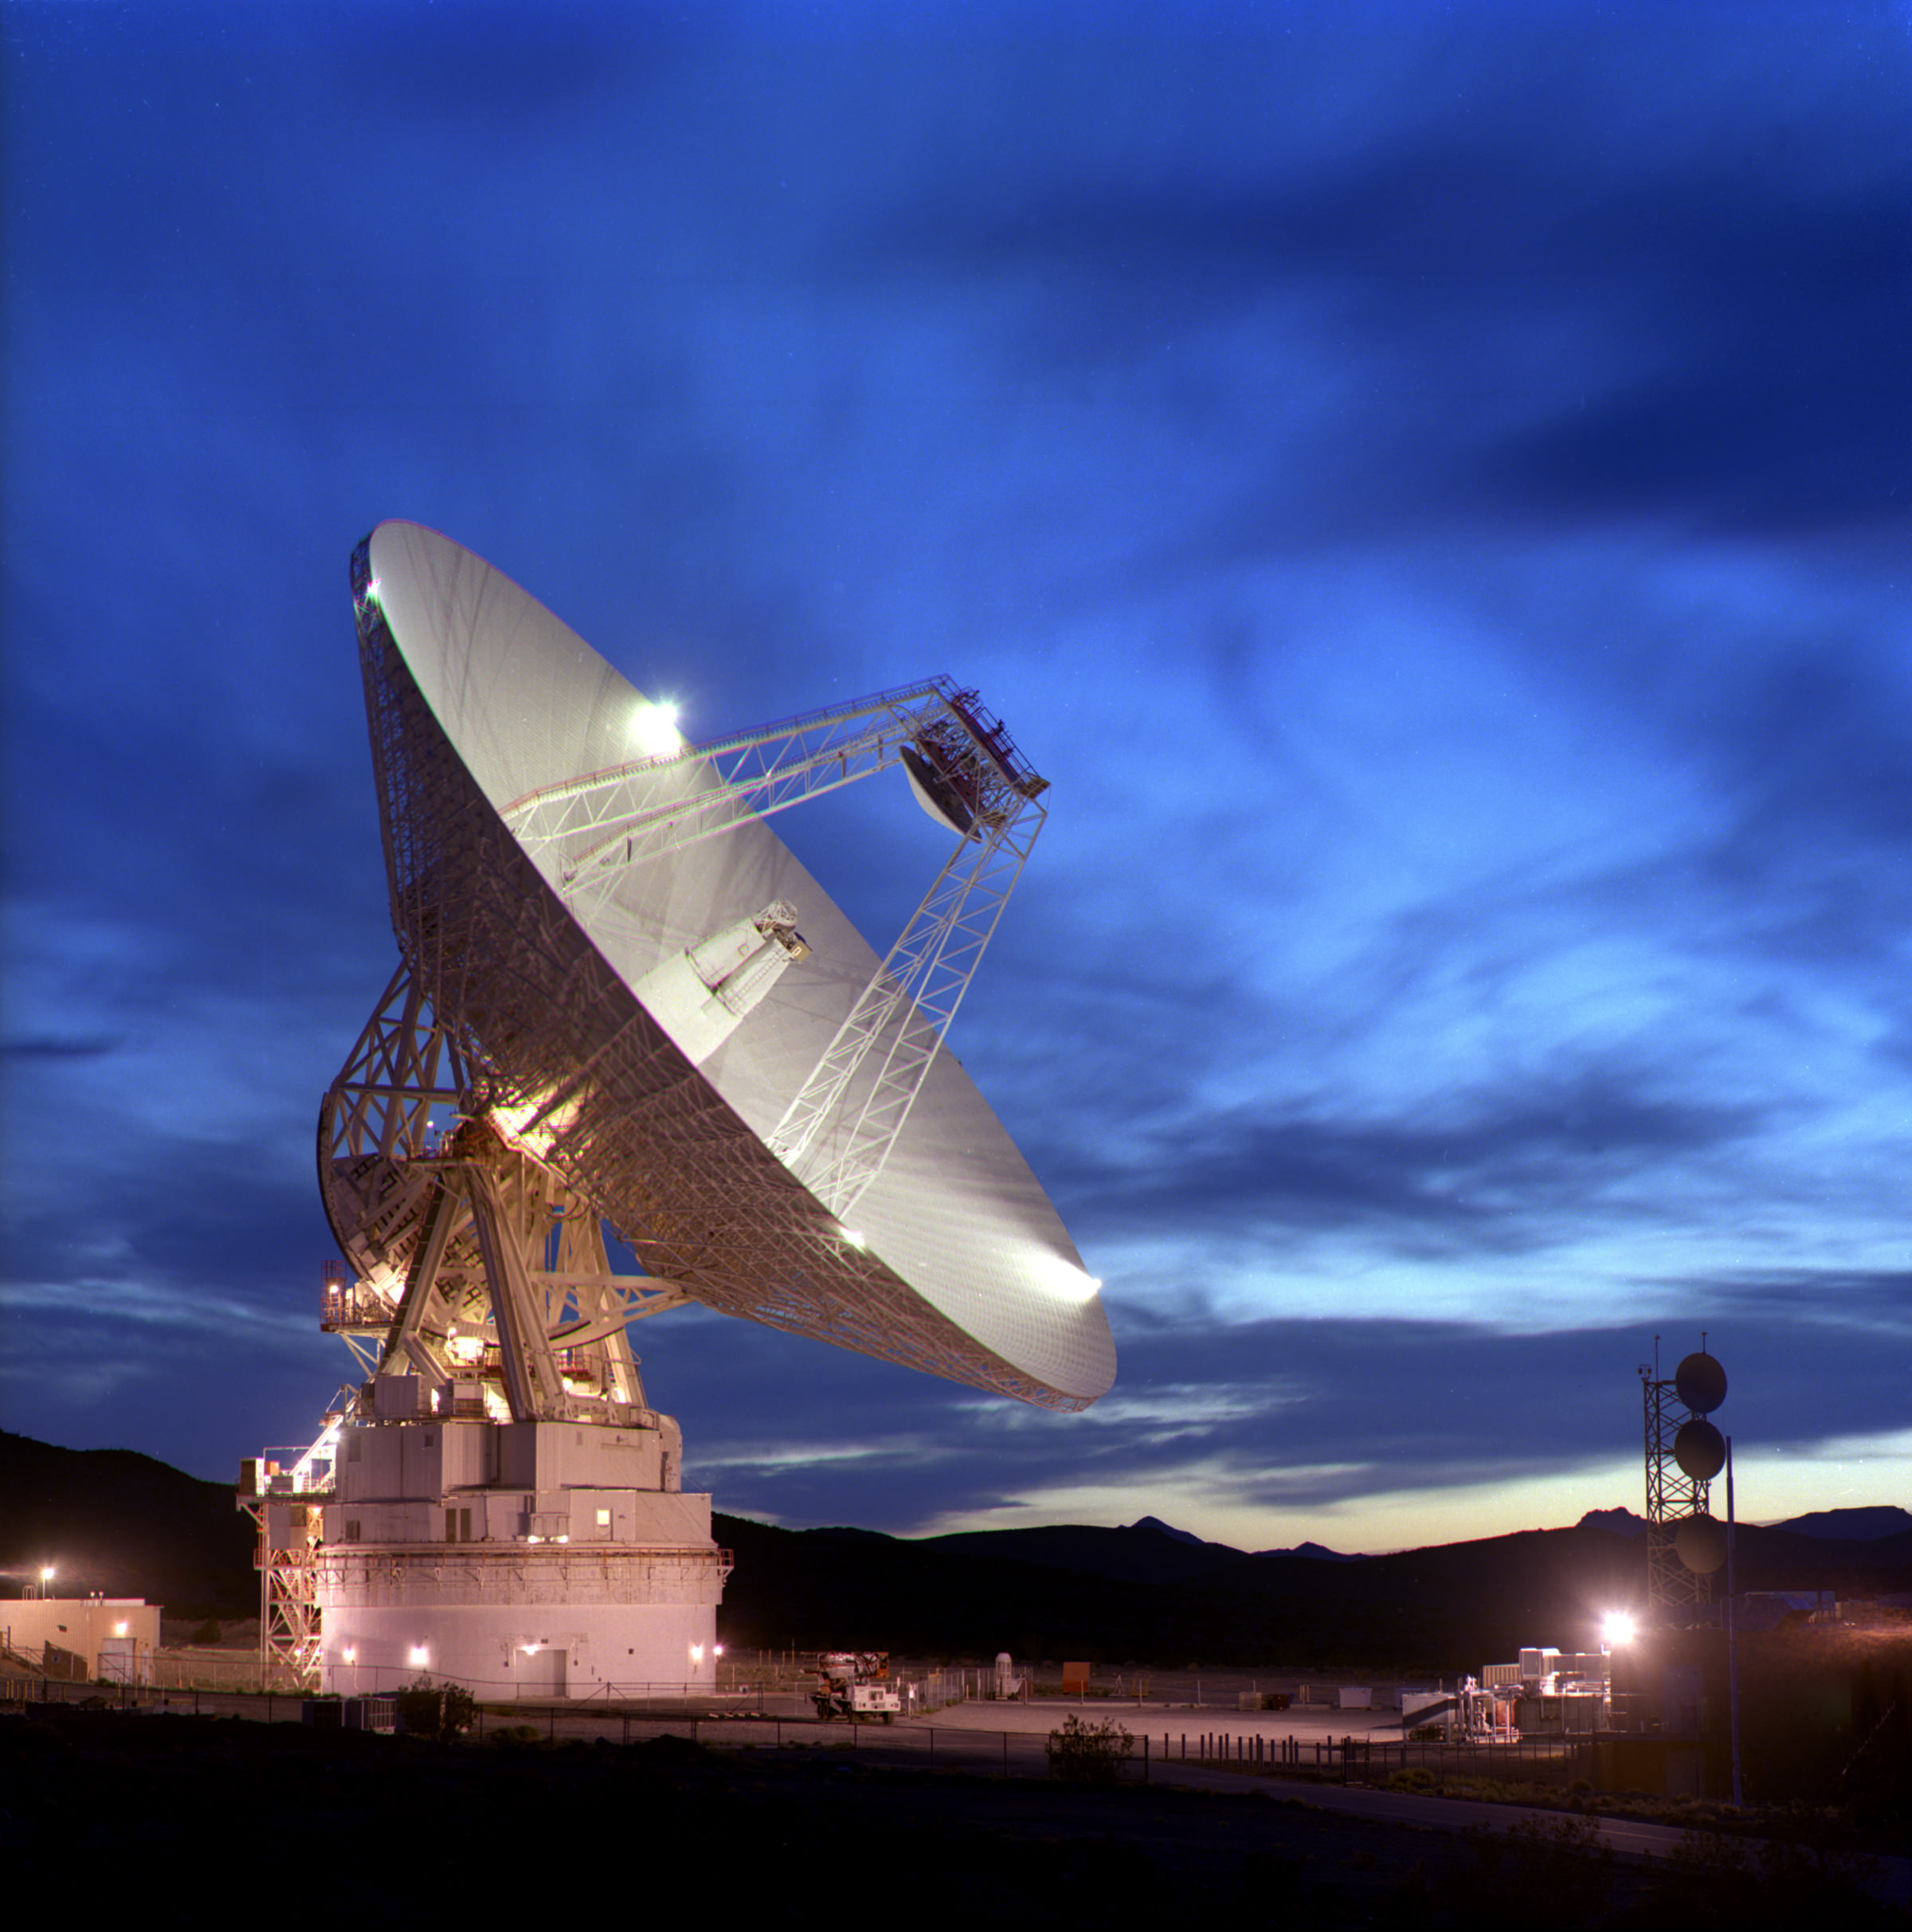
Intriguing details about the physical properties and characteristics of a recently discovered asteroid have just been unveiled in amazing images obtained using a large radar dish in California. The radar dish serves as a key component of NASA’s Deep Space Network (DSN). The Near Earth asteroid, dubbed 2010 JL33, was imaged by radar on Dec. 11 and 12, 2010 at NASA’s Goldstone Solar System Radar in California’s Mojave Desert when a close approach to Earth offered an outstanding opportunity for high quality science.
Asteroids studies have taken on significantly increased importance at NASA ever since President Obama decided to cancel the Constellation ‘Return to the Moon’ program and redirect NASA’s next human spaceflight goal to journeying to an Asteroid by around 2025.
Update: Orbital diagram added below
A sequence of 36 amazingly detailed images has been assembled into a short movie (see below) by the science team at NASA’s Jet Propulsion Laboratory (JPL) in Pasadena, Calif. The movie shows about 90 percent of one rotation.
The data gathered by radar revealed that the asteroid measures roughly 1.8 kilometers (1.1 miles) in diameter and rotates once every nine hours.
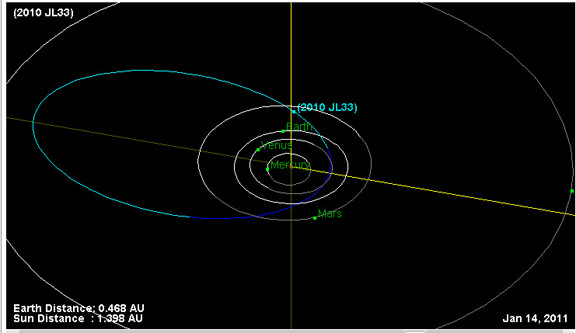
Orbital diagram of Asteroid 2010 JL33 shows location as of Jan 14, 2011. Credit: NASA
click to enlage all images
“Asteroid 2010 JL33 approached within 17 Earth-Moon distances [some 7 million km] in December 2010 and offered an outstanding opportunity to study it with radar,” said Lance Benner, a scientist at JPL who studies asteroids.
“To get detailed radar images, an asteroid must be close to Earth,” Benner told me, for Universe Today.
The object was only discovered on May 6 by the Mount Lemmon Survey in Arizona. The radar observations were led by a team headed by JPL scientist Marina Brozovic.
Video Caption: While safely passing Earth, NASA’s Goldstone Solar System Radar captured the rotation of asteroid 2010 JL33 — an irregular, elongated object roughly 1.8 kilometers (1.1) miles wide. The video consists of 36 frames.
“The radar images we got enabled us to estimate the asteroid’s size, rotation period, and to see features on its surface, most notably, the large concavity that appears as a dark region in the collage,” Benner elaborated.
“It was discovered so recently that little else is known about it.”
The object was revealed to be elongated and irregularly shaped.
70-meter diameter NASA Deep Space Network (DSN) antenna at Goldstone, California.
The 70-meter (230-foot) diameter antenna is the largest, and therefore most sensitive, DSN antenna, and is capable of tracking a spacecraft travelling more than 16 billion kilometers (10 billion miles) from Earth.
The surface of the 70-meter reflector must remain accurate within a fraction of the signal wavelength, meaning that the precision across the 3,850-square-meter (41,400 sq. ft.) surface is maintained within one centimeter (0.4 in.). Credit: NASA
The large concavity is clearly visible in the images and may be an impact crater. It took about 56 seconds for the radio signals from the 70-meter (230-foot) diameter Goldstone radar dish to make the roundtrip from Earth to the asteroid and back to Earth again.
“When we get deeper into our analysis of the data, we will use the images to estimate the three-dimensional shape of the asteroid as well,” Benner added.
Benner belongs to a team that is part of a long-term NASA program to study asteroid physical properties and to improve asteroid orbits using radar telescopes at Goldstone and also at the Arecibo Observatory in Puerto Rico. The 1,000-foot-diameter (305 meters) Arecibo radar dish antenna is operated by the National Science Foundation.
“Each close approach by an asteroid provides an important opportunity to study it, so we try to exploit as many such opportunities as possible to investigate the physical properties of many asteroids. In the bigger picture, this helps us understand how the asteroids formed,” Benner told me.
“Asteroid 2010 JL33 is in an elongated orbit about the Sun. On average, it’s about 2.7 times farther from the Sun than the Earth is, but its distance from the Sun varies from 0.7 to 4.6 times that of the Earth.” That takes the asteroid nearly out to Jupiter at Aphelion. It takes about 4.3 years to complete one orbit around the sun.
But, there’s no need to fret about disaster scenarios. “The probability of impact with Earth is effectively zero for the foreseeable future,” Benner explained.
“On rare occasions it approaches closely to Vesta,” he said. Vesta is the second most massive asteroid and will be visited for the first time by NASA’s Dawn spacecraft later this year.
In addition to the ground based radar imaging, the tiny space rock was investigated by an Earth orbiting telescope.
“This asteroid was also studied by NASA’s Wide-field Infrared Survey Explorer (WISE) spacecraft,” according to Benner. “Our observations will help WISE scientists calibrate their results because we provided an independent means to estimate the size of this object.”
More at this JPL press release. The NASA-JPL Near-Earth Object Program website has an interactive map that allows you to see the asteroid’s position at any time you desire. Go to here
To see the trajectory of any other near-Earth asteroid, go to here
For more information about asteroid radar research, go to here
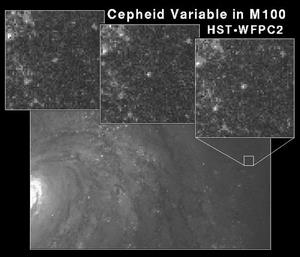
Cepheid Variable Star. Credit: Hubble Space Telescope
[/caption]
When Hubble first discovered a Cepheid variable in the galaxy M31, the universe grew. Previously, many astronomers had held that the fuzzy “spiral nebulae” were small patches of gas and dust within our own galaxy, but through the Period-Luminosity relationship which allowed him to determine the distance, Hubble demonstrated that these were “island universes”, or galaxies in their own right.
Soon after, Hubble (as well as other astronomers) began searching other fuzzy patches for Cepheids. Among them was the spiral galaxy M33 in which he discovered 35 Cepheids. Among them was V19 which had a 54.7 day period, an average magnitude of 19.59 ± 0.23 MB, and an amplitude of 1.1 magnitudes. But according to recent work revealed at the recent American Astronomical Society meeting, V19 no longer seems to be pulsating as a Cepheid.
The new research uses observations from the 3.5m Wisconsin, Indiana, Yale, and NOAO (WIYN) Observatory as well as the 1.3m Robotically Controlled Telescope (RCT) operated jointly by a group of universities and research institutions. The new observations confirm a 2001 report that found V19 had decreased its brightness amplitude to at least less than 10% of the magnitude reported by Hubble in 1926, and possibly further as any fluctuations were below the threshold detectable by the instruments.
Now, if any variation exists, it is less than 0.1 magnitudes. The new study reports that there may be some small fluctuations, but due to inherent uncertainty in the observations, it barely exceeds the background noise and the announcers did not commit to these findings. Instead, they pledged to continue observations with larger instruments to the equation to push down the instrumental error as well as adding spectroscopic measurements to investigate other changes in the star. Another of the peculiar changes V19 has undergone is an increase of about half of a magnitude to 19.08 ± 0.05.
These changes are strikingly similar to another, more famous star: Polaris. Due to its much closer nature, observations have been much more frequent and with lower detection thresholds. This star had previously been reported to have an amplitude of 0.1 magnitudes which, according to a 2004 study, had decreased to 0.03 magnitudes. Additionally, based on ancient records, astronomers have estimated that Polaris has also brightened about a full magnitude in the past 2,000 years.
According to Edward Guinan of Villanova University and one of the members of the new observational team, “both stars are experiencing unexpectedly fast and large changes in their pulsation properties and brightness that are not yet explained by theory.”
The primary explanation for this dramatic change is simple evolution: As the stars have aged, they have moved out of the instability strip, a region on the HR diagram in which stars are prone to pulsations. But these stars may not be entirely lost from the family of periodic variables. In 2008, a study led by Hans Bruntt of the University of Sidney suggested that Polaris’ amplitude may be increasing. The team found that from 2003 to 2006, the scale of the oscillations had increased by 30%.
This has led other astronomers to suspect that there may be an additional effect in play in Cepheids known as the Blazhko Effect. This effect, often seen in RR Lyrae stars (another type of periodic variables), is a periodic variation of the variation. While no firm explanation exists for this effect, astronomers have suggested that it may be due to multiple pulsational modes that interfere constructively and destructively and occasionally forming resonances.
Ultimately, these strange changes in brightness are unexplained and will require astronomers to have to carefully monitor these stars, as well as other Cepheids to search for causes.
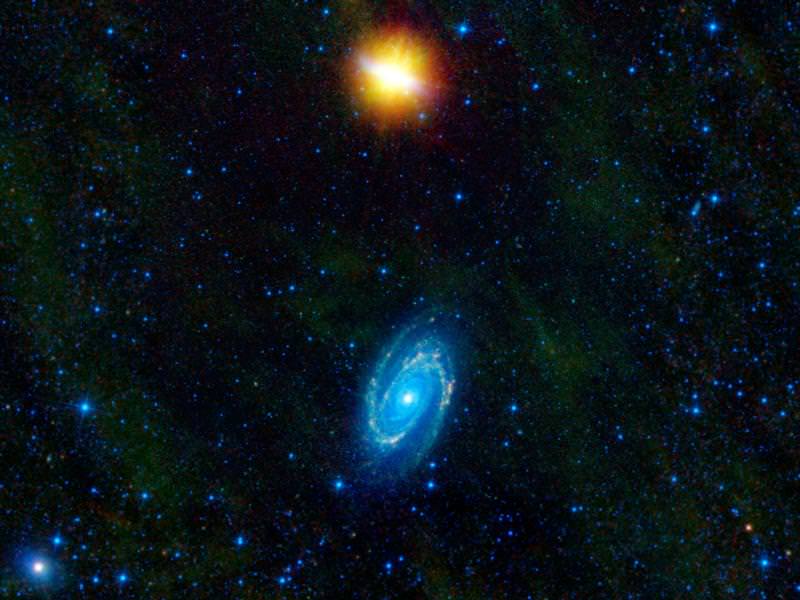
Almost every amateur astronomer has viewed the ghostly glow of galactic pair, Messier 81 and Messier 82. They’re easily visible in small binoculars from a dark sky site and reveal wonderful details in a telescope as aperture increases. We’ve marveled over M81’s smooth, star-rich structure and the disturbed spindle-shaped structure of M82. We know the pair have interacted and the huge spiral has ingested stars from its companion – but today we know a whole lot more…
According to today’s press release from the American Astronomical Society, when the pair swept by each other, gravitational interactions triggered new bursts of star formation. In the case of Messier 82, also known as the Cigar Galaxy, the encounter has likely triggered a tremendous wave of new star birth at its core. Intense radiation from newborn massive stars is blowing copious amounts of gas and smoky dust out of the galaxy, as seen in the WISE image in yellow hues. The Cigar Galaxy is pictured above Messier 81. “What’s unique about the WISE view of this duo is that we can see both galaxies in one shot, and we can really see their differences,” said Ned Wright of UCLA, the principal investigator of WISE. “Because the Cigar Galaxy is bursting with star formation, it’s really bright in the infrared, and looks dramatically different from its less active companion.”
The WISE mission completed its main goal of mapping the sky in infrared light in October 2010, covering it one-and-one-half times before its frozen coolant ran out, as planned. During that time, it snapped pictures of hundreds of millions of objects, the first batch of which will be released to the astronomy community in April 2011. WISE is continuing its scan of the skies without coolant using two of its four infrared channels — the two shorter-wavelength channels not affected by the warmer temperatures. The mission’s ongoing survey is now focused primarily on asteroids and comets. Because WISE has imaged the entire sky, it excels at producing large mosaics like this new picture of Messier 81 and Messier 82, which covers a patch of sky equivalent to three-by-three full Moons, or 1.5 by 1.5 degrees.
It is likely these partner galaxies will continue to dance around each other, and eventually merge into a single entity. They are both spiral galaxies, but Messier 82 is seen from an edge-on perspective, and thus appears in visible light as a thin, cigar-like bar. (To me it has always looked like a child’s dirty kite string wrapped around a stick, eh?) When viewed in infrared light, Messier 82 is the brightest galaxy in the sky. It is what scientists refer to as a starburst galaxy because it is churning out large numbers of new stars. “The WISE picture really shows how spectacular Messier 82 shines in the infrared even though it is relatively puny in both size and mass compared to its big brother, Messier 81,” said Tom Jarrett, a member of the WISE team at the California Institute of Technology in Pasadena.
In this WISE view, infrared light has been color coded so that we can see it with our eyes. The shortest wavelengths (3.4 and 3.6 microns) are shown in blue and blue-green, or cyan, and the longer wavelengths (12 and 22 microns) are green and red. Messier 82 appears in yellow hues because its cocoon of dust gives off longer wavelengths of light (the yellow is a result of combining green and red). This dust is made primarily of polycyclic aromatic hydrocarbons, which are found on Earth as soot.
Messier 81, also known as Bode’s Galaxy, appears blue in the infrared image because it is not as dusty. The blue light is from stars in the galaxy. Knots of yellow seen dotting the spiral arms are dusty areas of recent star formation, most likely triggered by the galaxy’s encounter with its rowdy partner. “It’s striking how the same event stimulated a classic spiral galaxy in Messier 81, and a raging starburst in Messier 82,” said WISE Project Scientist Peter Eisenhardt of NASA’s Jet Propulsion Laboratory in Pasadena, Calif. “WISE is finding the most extreme starbursts across the whole sky, out to distances over a thousand times greater than Messier 82.”
Next time you view M81 and M82, perhaps you’ll see them in a new light?
Original Source: American Astronomical Society Press Release – WISE Image Credit: NASA
.
Check out this awesome pair of inspiring videos about NASA and Space Exploration. They are set to the ever inspiring words of Carl Sagan – reading from his book, “The Pale Blue Dot”. And these beautifully crafted videos were not created by NASA, but rather by people inspired by NASA and Carl Sagan to dream about distant frontiers even in these times of tough budgets for NASA.
The original, highly praised video – see below – was created by Director Michael Marantz, who was inspired by the words of Carl Sagan. Now a completely new version – above – by a fellow going by “damewse”, has been set to the same stirring words and music and the video has gone viral.
[/caption]
“damewse” posted that he created the new video treatment because he feels NASA’s PR sucks, resulting in massive funding cuts. He pleads with NASA to use social media to relate to the public with videos like these to rekindle public interest in the space program.
Both videos are included here for all to enjoy and compare – moving and thought provoking in their own right.
“damewse” elaborated; “I got frustrated with NASA and made this video. NASA is the most fascinating, adventurous, epic institution ever devised by human beings, and their media sucks.”
“Seriously. none of their brilliant scientists appear to know how to connect with the social media crowd, which is now more important than ever. In fact, NASA is an institution whose funding directly depends on how the public views them.”
Earth: The Pale Blue Dot
The original film and comments by Director Michael Marantz
“Carl Sagan provides the epic narration to this piece. His great ability to convey such overwhelming topics in relatable ways inspired me to make this.”
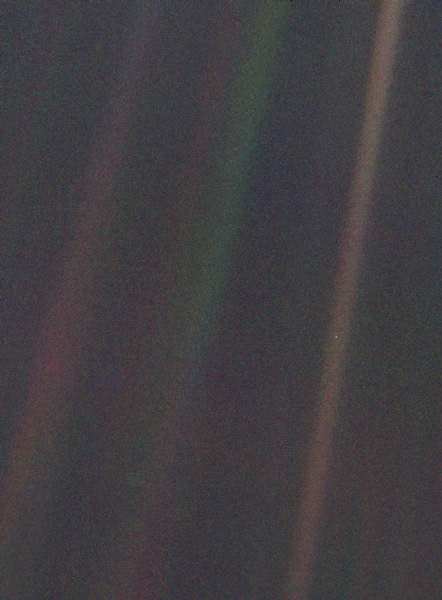
The Pale Blue Dot. Most distant image of Earth, snapped by the Voyager 1 spacecraft in 1990 at a distance of 6.1 billion kilometers. Credit: NASA
“This piece contains readings from Carl Sagan’s “Pale Blue Dot”. I have edited his words to tell this short narrative.
I took the time lapse images in Mexico and Utah.
The piano is self-composed.
Everything in this video is created by myself except for the words of Carl Sagan.
I hope you enjoy this piece, it has given me hope once again.”
– Michael Marantz
…………..
Well NASA does need to do a more effective job at PR to grab the attention of the public – especially the younger generations – and explaining the agency’s exploration goals in ways that folks will find value in and support. But it’s also true that NASA has embraced many forms of social media. Take a look at almost any NASA Center or Mission homepage and you’ll see buttons for Twitter, Facebook, YouTube, flickr, blogs and more. I’ve found these sources to be invaluable, especially during beaking news events.
It hinges more I think on the quality of the presentation of the content and the organization of outstanding material at those websites. Look here for a thoughtful perspective from Spaceref Canada
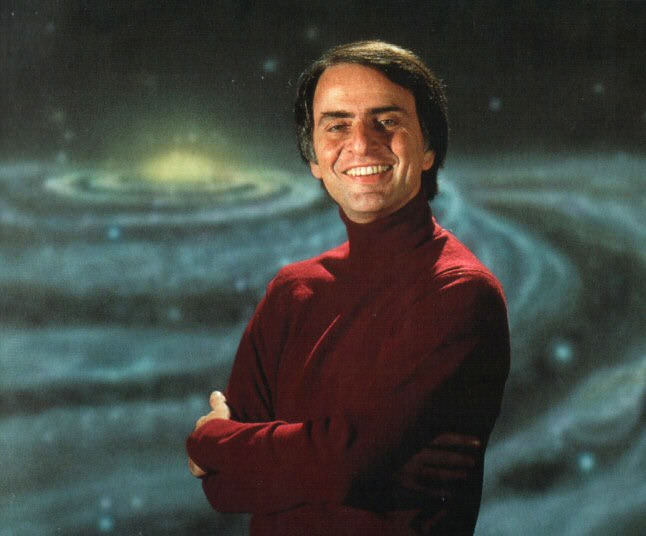
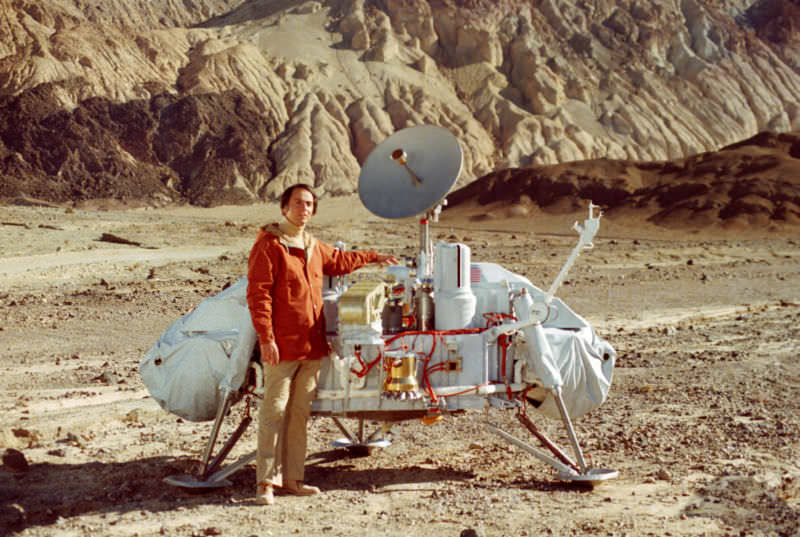
The lengthy list of exciting and worthy ideas and lost opportunities for space exploration that have gone unfunded in our lifetimes, is truly sad. Carl Sagan with a model of the Viking Lander that landed on Mars in 1976 in the search for life.
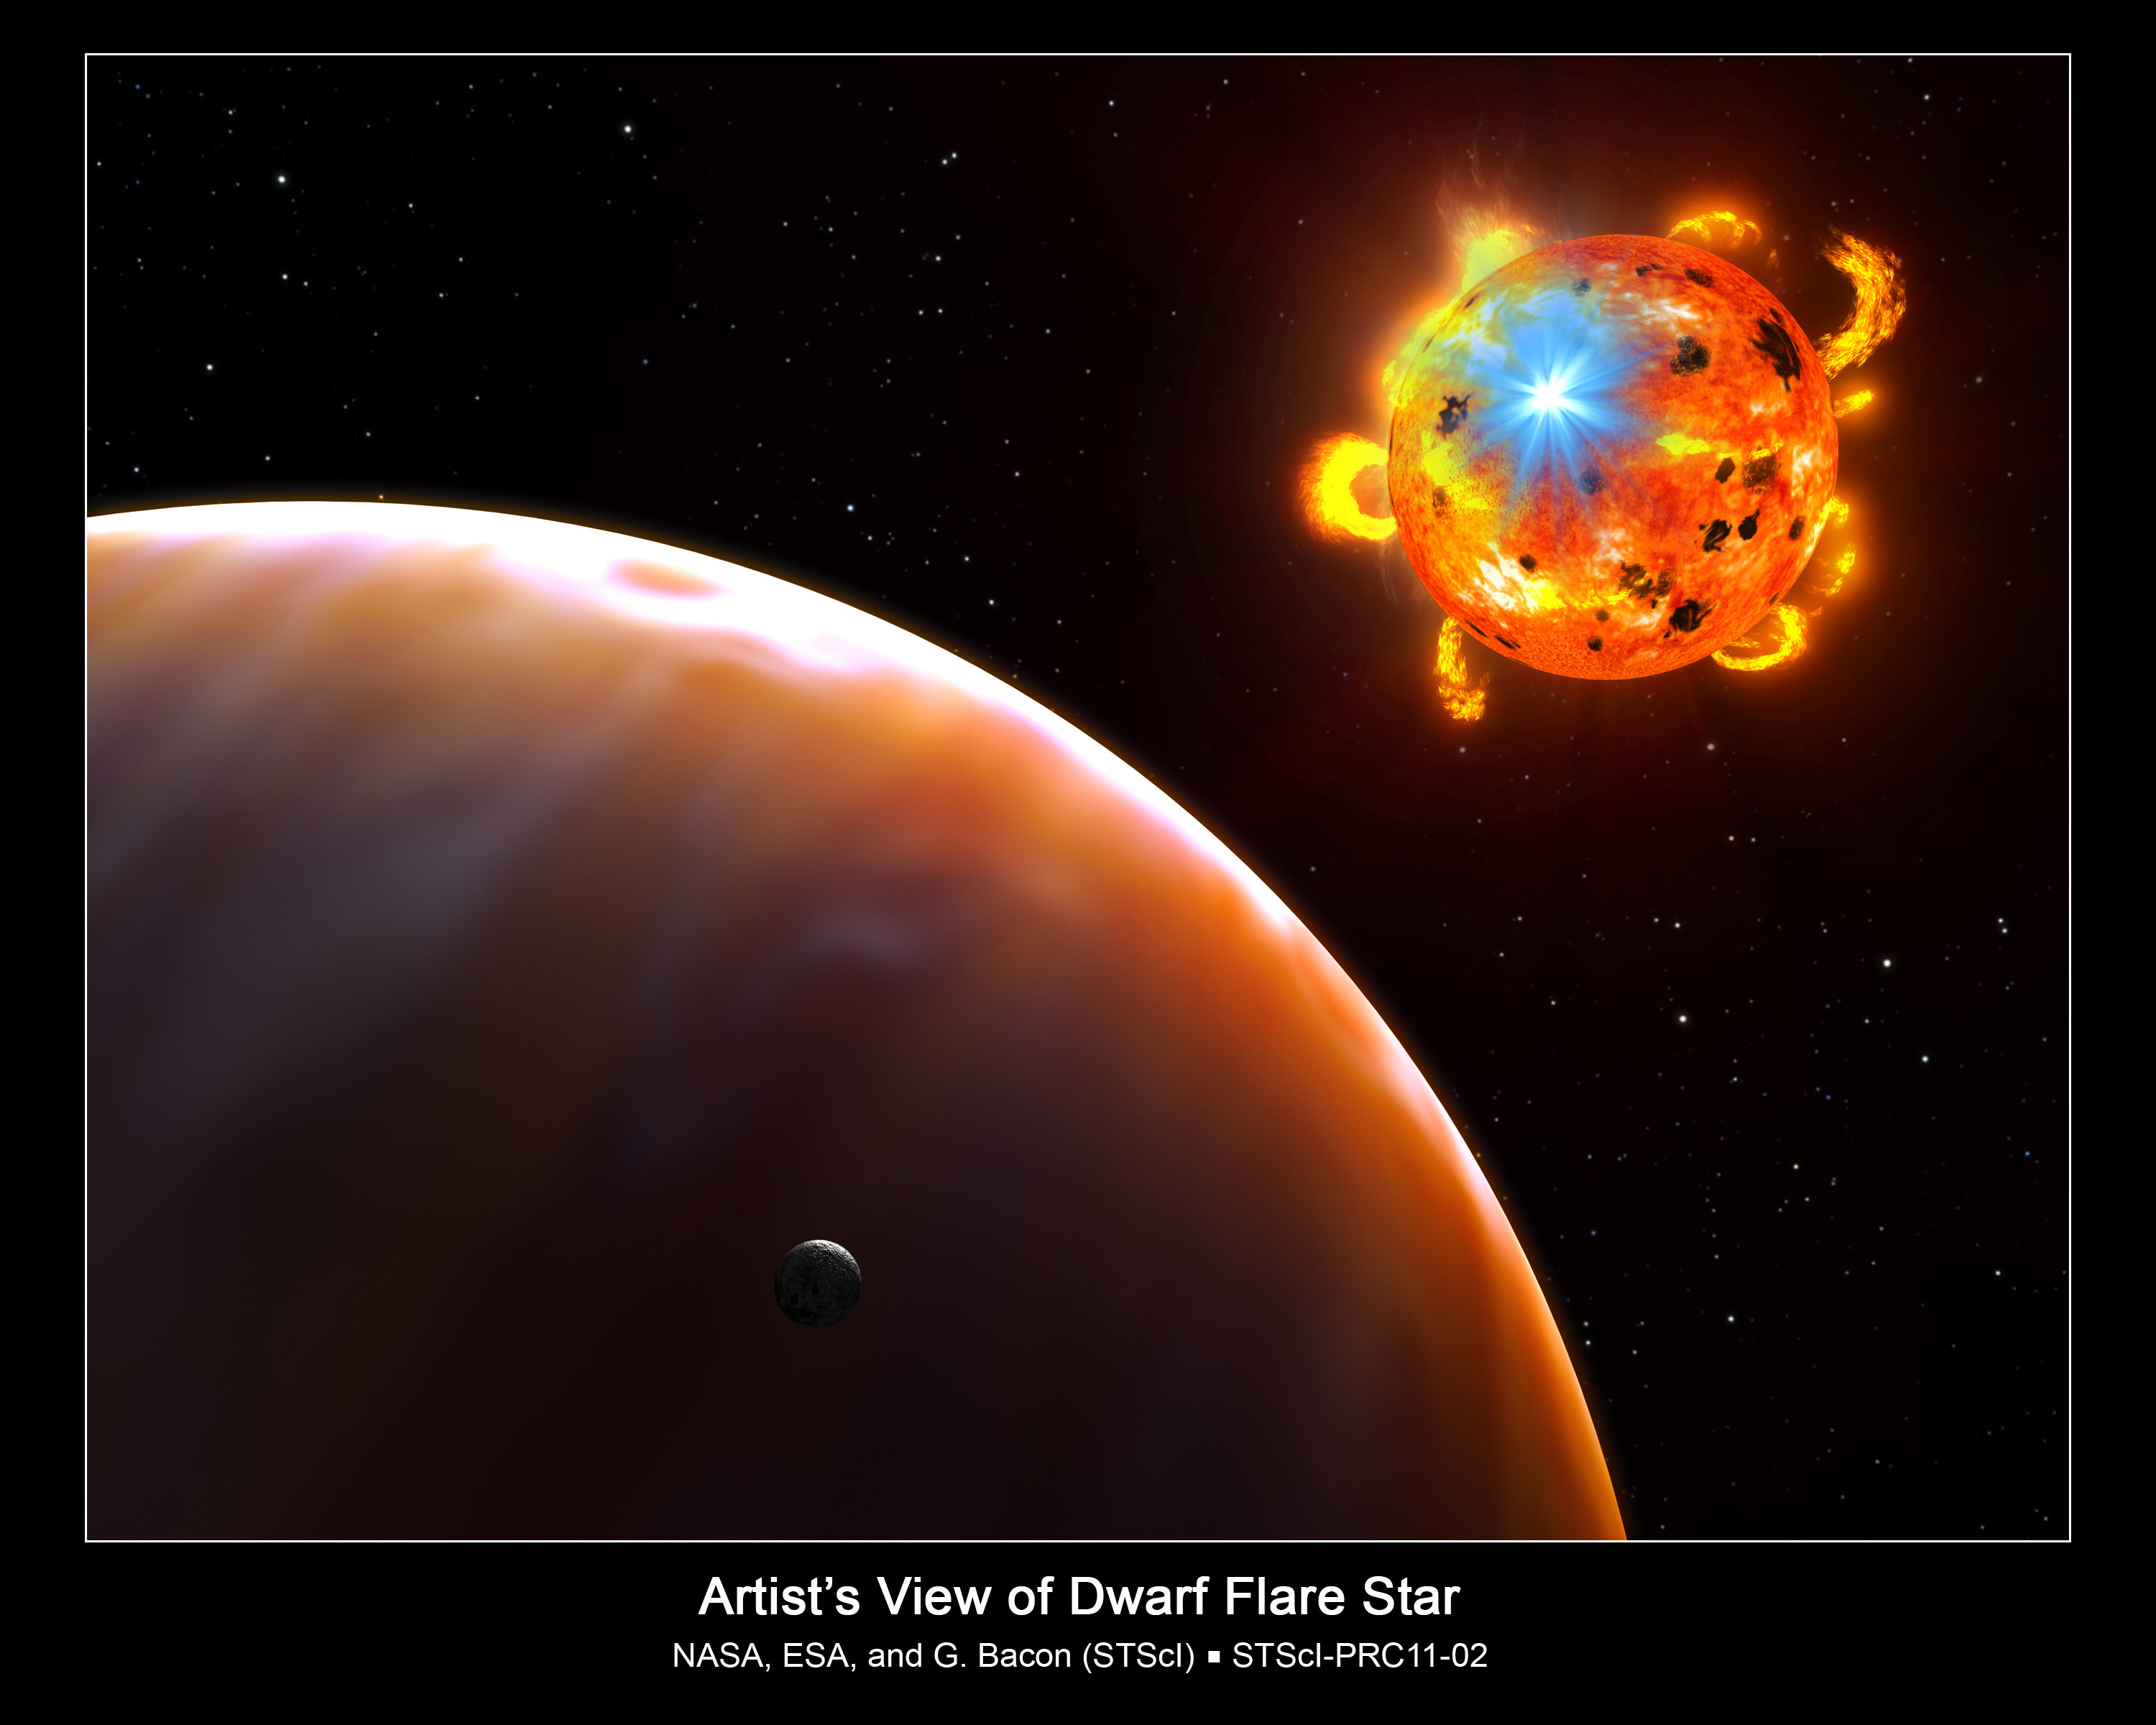
This is an artist's concept of a red dwarf star undergoing a powerful eruption, called a stellar flare. A hypothetical planet is in the foreground. Credit: NASA/ESA/G. Bacon (STScI)
[/caption]
For a long time, astronomers have known that stars often have troubled childhoods. They suffer from frequent and violent flares. But eventually, as they settle onto the main sequence, stars grow out of their destructive ways, which is thankful for us since large flares could do some serious damage to our biosphere. A new study confirms expectations that some stars never outgrow their roguish ways and that the smallest stars can be prone to the most frequent flares.
The study uses data from the Sagittarius Window Eclipsing Extrasolar Planet Search (SWEEPS) survey conducted by the Hubble Space Telescope. This survey was conducted over a seven day period in 2006 and originally designed to search for transiting planets by repeatedly imaging over 200,000 stars for sings of transits. However, since the exploration contained so many red dwarf stars, the smallest and most common stars in the universe, a team led by Rachel Osten of the Space Telescope Science Institute was able to use it to constrain the rate of flares on these diminutive stars.
The team eventually discovered 100 stellar flares, some of which increased the overall brightness of their parent star by as much as 10%. In general, most flares were short, lasting on average a mere 15 minutes. Some stars flared multiple times. These flares weren’t limited to simply young stars, but also, highly evolved stars, including several variable stars which appeared to flare more often.
“We discovered that variable stars are about a thousand times more likely to flare than non-variable stars,” Adam Kowalski, another team member, says. “The variable stars are rotating fast, which may mean they are in rapidly orbiting binary systems. If the stars possess large star spots, dark regions on a star’s surface, that will cause the star’s light to vary when the spots rotate in and out of view. Star spots are produced when magnetic field lines poke through the surface. So, if there are big spots, there is a large area covered by strong magnetic fields, and we found that those stars had more flares.”
Part of the reason that dwarf stars are though to flare more comes from the fact that they have deep convection zones (shown by their lack of lithium in the photosphere which is destroyed by convection which drags it to depths hot enough to destroy it). This bulk movement of ionized particles creates a dynamo and strong magnetic fields on the star. When these fields become especially tangled, they can snap and spontaneously reform in a lower energy state. The energy lost is dumped into the stars outer layers, heating them with tremendous amounts of energy and releasing large amounts of ultraviolet, X-ray, and even gamma radiation as well as charged particles. In more extreme circumstances, the fields don’t immediately reform but swing outwards as they unwind themselves, dragging large amounts of the star with it, and flinging it outwards in a coronal mass ejection (CME).
One of the results of the enhanced magnetic activity is a larger number and size of sunspots. According to Osten, “Sunspots cover less than 1 percent of the Sun’s surface, while red dwarfs can have star spots that cover half of their surfaces.”
Roll over, Edwin Hubble. For many decades astronomers have relied upon the “standard candle” to express the brightness of a Cepheid variable star, thereby establishing a distance. But not anymore… Now there’s evidence that Cepheid variables can shrink in mass and that bit of information changes the whole picture. The findings, made with NASA’s Spitzer Space Telescope, will help astronomers make even more precise measurements of the size, age and expansion rate of our Universe. Strap on your cosmic seat belt and read on…
According to today’s American Astronomical Society Press Release, standard candles are astronomical objects that make up the rungs of the so-called cosmic distance ladder, a tool for measuring the distances to farther and farther galaxies. The ladder’s first rung consists of pulsating stars called Cepheid variables, or Cepheids for short. Measurements of the distances to these stars from Earth are critical in making precise measurements of even more distant objects. Each rung on the ladder depends on the previous one, so without accurate Cepheid measurements, the whole cosmic distance ladder would come unhinged. Now, new observations from Spitzer show that keeping this ladder secure requires even more careful attention to Cepheids. The telescope’s infrared observations of one particular Cepheid provide the first direct evidence that these stars can lose mass—or essentially shrink. This could affect measurements of their distances.
“We have shown that these particular standard candles are slowly consumed by their wind,” said Massimo Marengo of Iowa State University, Ames, Iowa, lead author of a recent study on the discovery appearing in the Astronomical Journal. “When using Cepheids as standard candles, we must be extra careful because, much like actual candles, they are consumed as they burn.”
The star in the study is Delta Cephei, which is the namesake for the entire class of Cepheids. It was discovered in 1784 in the
constellation Cepheus, or the King. Intermediate-mass stars can become Cepheids when they are middle-aged, pulsing with a regular beat that is related to how bright they are. This unique trait allows astronomers to take the pulse of a Cepheid and figure out how bright it is intrinsically—or how bright it would be if you were right next to it. By measuring how bright the star appears in the sky, and comparing this to its intrinsic brightness, it can then be determined how far away it must be. This calculation was famously performed by astronomer Edwin Hubble in 1924, leading to the revelation that our galaxy is just one of many in a vast cosmic sea. Cepheids also helped in the discovery that our universe is expanding and galaxies are drifting apart.
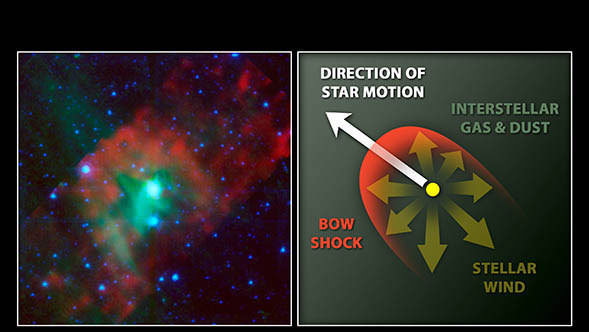
Cepheids have since become reliable rungs on the cosmic distance ladder, but mysteries about these standard candles remain. One question has been whether or not they lose mass. Winds from a Cepheid star could blow off significant amounts of gas and dust, forming a dusty cocoon around the star that would affect how bright it appears. This, in turn, would affect calculations of its distance. Previous research had hinted at such mass loss, but more direct evidence was needed. Marengo and his colleague used Spitzer’s infrared vision to study the dust around Delta Cephei. This particular star is racing along through space at high speeds, pushing interstellar gas and dust into a bow shock up ahead. Luckily for the scientists, a nearby companion star happens to be lighting the area, making the bow shock easier to see. By studying the size and structure of the shock, the team was able to show that a strong, massive wind from the star is pushing against the interstellar gas and dust. In addition, the team calculated that this wind is up to one million times stronger than the wind blown by our Sun. This proves that Delta Cephei is shrinking slightly.
Follow-up observations of other Cepheids conducted by the same team using Spitzer have shown that other Cepheids, up to 25 percent observed, are also losing mass. “Everything crumbles in cosmology studies if you don’t start up with the most precise measurements of Cepheids possible,” said Pauline Barmby of the University of Western Ontario, Canada, lead author of the follow-up Cepheid study published online Jan. 6 in the Astronomical Journal. “This discovery will allow us to better understand these stars, and use them as ever more precise distance indicators.”
Like Pluto, this means we will end up having to re-write our astronomy books… But it’s a “birth day” candle we’re ready to blow out!
Original Source: American Astronomical Society Press Release – Photo Credit: NASA

, utilized for the Very Large Telescope Interferometer (VLTI). ESO, Cerro Paranal, Chile. Image: F. Millour, OCA, Nice, France.")