[/caption]
The constellation of Orion resides on the celestial equator and is one of the most brilliant and recognized in the world. It was part of Ptolemy’s original constellation charts and remains as one of the 88 modern constellations adopted by the International Astronomical Union. Orion spans 594 square degrees of sky, ranking 26th in overall size. It contains 7 main stars in its asterism and has 81 Bayer Flamsteed stars within its confines. Orion is bordered by the constellations of Gemini, Taurus, Eridanus, Lepus and Monoceros. It is visible to all observers located at latitudes between +85° and ?75° and is best seen at culmination during the month of January.
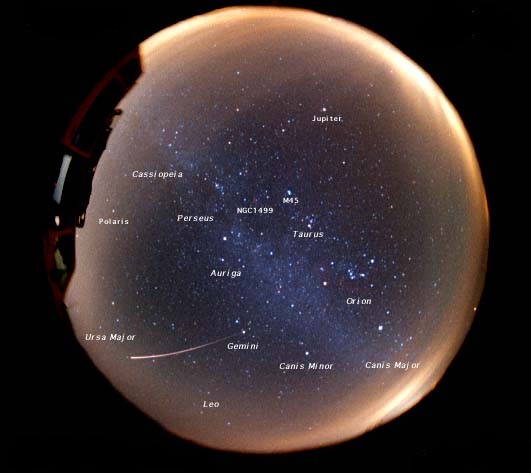
Orion has one annual meteor shower associated with it which occurs during an eight day window around the date of October 20, with the peak on the early morning hours of that date. The Orionid meteor shower radiant – or point or origin – is near the border of the constellation of Taurus and the fall rate averages about 30 per hour visible during optimum conditions – such as a moonless night. These particular meteors are rated at very fast, with speeds recorded of up to 67 kilometers per second upon entry into the Earth’s atmosphere. The Orionids are also noted for color – the trails appearing in shades of red, blue or yellow – and leaving long, lasting trains. While the peak occurs on October 20, look for activity to begin on the morning of October 16 and last through around October 24.
Because the stellar patterns of Orion are so vivid and symmetrical, this constellation has been recognized throughout history and has a long and colorful mythology associated with it. Orion is meant to represent the celestial “Hunter” and the three bright “belt” stars are recognized around the world. Orion is often depicted as standing in the river Eridanus, holding his bow before him, with the club raised over his head – while his hunting dogs (Canis Major and Minor) trail behind and the rabbit (Lepus) hides at his feet. Some myths have Orion killed by the scorpion (Scorpius) and others have him associated with fighting the bull (Taurus) and with the Plieades. Because Orion is viewed at a different angle in the Southern Hemisphere, it is often called the “Saucepan” and cultural mythology also differs. No matter how you see this great collection of stars, you’ll find it leads to an even greater collection of deep sky objects! So many, if fact, that a simple star chart would become quickly overloaded if we were to list them all!
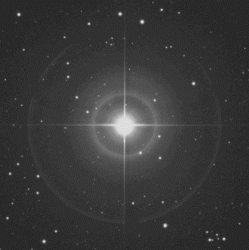
Let’s begin our visual and binocular tour of Orion with its brightest star, Alpha – the “a” symbol on our map. Located in the northeastern corner of Orion and about 425 light years from our solar system, Betelgeuse, like many red giant stars, it is inherently unstable – varying irregularly by as much 1.3 magnitudes in cycles up to six years in length. At its brightest, Betelgeuse can appear more luminous than Rigel (Beta) and its diameter could encompass all the inner planets and much of the asteroid belt. Due to low density, observers would have a hard time determining where space ended and the star began! Allowing for all ranges of radiation, Betelgeuse is more than 50,000 times brighter than our own Sun. Like Antares, it is a “star within a star” – its dense core region radiating with such ferocity that internal pressure drives matter away. Betelgeuse’s core has probably fused all its hydrogen and is now releasing energy through helium fusion – resulting in atoms essential to organic life (carbon and oxygen). Even though it hasn’t gone supernova yet, when it does it will outshine the Moon!
Now, hop to the southwest corner for a look at Beta Orionis – the “B” symbol on our map. Known as Rigel and located about 775 light years from Earth, this hot, blue supergiant star shines with the light of 40,000 suns. If we were to include the amount of light that Rigel produces in the ultra-violet spectrum, too it would produce up to 66,000 times as much light as Sol! But, Rigel also holds a surprise. Point even a small telescope its way and you’ll find out that Beta Orionis is a binary star. Its 7th magnitude companion is separated well away, but you’ll need to keep Rigel to the edge of the field of view to cut the brilliance in order to see it. This small companion orbits about 50 Pluto distances away from its giant companion… which is a good thing since it one day may explode!
Take a look at Gamma Orionis – the “Y” symbol on our map. Bellatrix is known as the “Amazon Star” and is about 240 light years away. While it was once believed to be associated with the other stars of Orion, we’ve learned that Bellatrix is a star in its own right – separate from the others. Historically is was used to measure stellar luminosity until it was discovered that it was an eruptive variable star! While you won’t much notice a tenth of a magnitude change in the 27th brightest star in the sky, it’s still cool to know that it’s collecting a dusty hood that fooled astronomers for many years!
Don’t forget to look at Kappa Orionis, too – the “k” symbol on our map. Even though Saiph is about the same distance away and same size as Rigel, it sure doesn’t look the same, does it? Why? Because Saiph is a much hotter star and most of its light is emitted in the ultraviolet range. It, too, is destined to lead a short, violent stellar life – ending a supernova.
For other interesting stars to take a look at in binoculars, check out U Orionis – it’s a Mira-type variable star. Most of the time U holds an average magnitude of 4.8, Mira-type regular variable is U Orionis, which usually has a brightness of 4.8 but every 368.3 days it drops down to a telescopic magnitude 13! Pi 5 Orionis is a nice visual double star, but even a small telescope and will thoroughly enjoy Sigma Orionis – a true multiple star system. Don’t forget Lambda, too! It’s also a great telescopic binary star!
Because Orion is so loaded with deep sky objects, we’ll only touch on a few of the great for binoculars and telescopes. Absolutely one of the best is Messier 42 located in the asterism of “Orion’s Sword”. Known as the Great Orion Nebula – M42 is actually a great cloud of glowing gases whose size is beyond our comprehension. More than 20,000 times larger than our own solar system, its light is mainly fluorescent. For most people, the Great Orion Nebula will appear to have a slight greenish color – the result of doubly ionized oxygen. At the fueling heart of this immense region is an area known as the Trapezium, its four easily seen stars perhaps the most celebrated multiple system in the night sky. The Trapezium itself belongs to a faint cluster of stars which are now approaching the main sequence stage in an area known as the “Huygenian Region”. Buried in this cloud of mainly hydrogen gas there are many star forming regions amidst the bright ribbons and curls. Appearing like “knots” in the structure, these are known as “Herbig-Haro objectsâ€? and are believed to be stars in their earliest states. There are also a great number of faint reddish stars and erratic variables – very young stars that may be of the accreting T Tauri type. Along with these are “flare starsâ€? whose rapid variations mean that amateur astronomers have a chance to witness new activity. While you view M42, note that the region appears very turbulent. There is a very good reason. The Great Nebula’s many different areas move at different speeds both in recession and approach. The expansion rate at the outer edges of the nebula is an indication of radiation from the very youngest stars known. Although it may be as many as 23,000 years since the Trapezium brought it to “light” it is entirely possible that new stars are still forming in M42. Don’t forget the area of nebulosity that appears slightly separate is designated as M43!
Now, let’s check out the “Running Man” in a large telescope. Located just a half a degree north of M42/43, this tripartite nebula consists of three separate areas of emission and reflection nebulae that seem to be visually connected. NGCs 1977, 1975 and 1973 would probably be pretty spectacular if they were a bit more distant from their grand neighbor! This whispery soft, conjoining nebula’s fueling source is multiple star 42 Orionis. To the eye, a lovely triangle of bright nebulae with several enshrouded stars makes a wonderfully large region for exploration. Can you see the “Running Man” within?
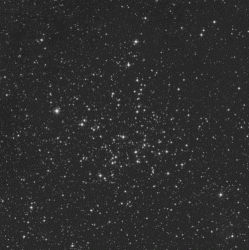
Ready for some open star clusters for your binoculars and telescopes? Hop about four fingerwidths southeast of Betelgeuse for NGC 2186. This large, loose open cluster is well suited to larger binoculars or small telescopes and contains around 50 or so members that range in magnitude from 9 to 11. Look for many distinct pairings! NGC 2186 has been a study area for astronomers and is known to contain circumstellar disks, which may be either newly-forming solar systems or just regenerated materials left over from formation. The next hop is just northwest of apparent double Kappa Orionis. NGC 2194 is also a Herschel object and at magnitude 8.5 is well suited to smaller scopes. This rich galactic cluster can be well resolved in larger scopes and the similar magnitude members make it a delightful spray of stars.
Now, let’s look at some galactic star clusters that belong to different catalogs. The first three are known as “Dolidzes” and your marker star is Gamma Orionis. The first is an easy hop of about one degree northeast of Gamma – Dolidze 21. Here we have what is considered a “poorâ€? open cluster. Not because it isn’t nice – but because it isn’t populous. It is home to around 20 or so low wattage stars of mixed magnitude with no real asterism to make it special. The second is about one degree northwest of Gamma – Dolidze 17. The primary members of this bright group could easily be snatched with even small binoculars and would probably be prettier in that fashion. Five very prominent stars cluster together with some fainter members that are, again, poorly constructed. But it includes a couple of nice visual pairs. Low power is a bonus on this one to make it recognizable. The last is about two degrees north of Gamma – Dolidze 19. Two well-spaced roughly 8th magnitude stars stand right out with a looping chain of far fainter stars between them and a couple of relatively bright members dotted around the edges. With the very faint stars added in, there are probably three dozen stars all told and this one is by far the largest concentration of this “Do” trio.
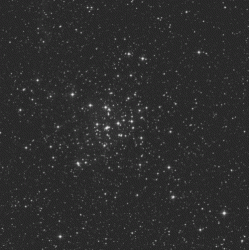
Now let’s have a look at a deceptive open cluster located in Barnard’s Loop around 2 degrees northeast of bright nebula M78. While billed at a magnitude of roughly 8, NGC 2112 might be a binocular object, but it’s a challenging one. This open cluster consists of around 50 or so stars of mixed magnitudes and only the brightest can be seen in small aperture. Add a little more size in equipment and you’ll find a moderately concentrated, small cloud of stars that is fairly distinguishable against a stellar background. Also known as Collinder 76, this unusual cluster resides in the galactic disc – an area of mostly very old, metal poor stars. It is believed that NGC 2112 is of a more intermediate age, based on recent photometric and spectroscopic data.
Are you ready for a challenge? Then take advantage of dark sky time to head to the eastern-most star in the belt – Zeta Orionis. Alnitak resides at a distance of some 1600 light-years, but this 1.7 magnitude beauty contains many surprises – like being a triple system. Fine optics, high power and steady skies will be needed to reveal its members. About 15′ east and you will see that Alnitak also resides in a fantastic field of nebulosity which is illuminated by our tripartite star. NGC 2024 is an outstanding area of emission that holds a rough magnitude of 8 – viewable in small scopes but requiring a dark sky. So what’s so exciting about a fuzzy patch? Look again, for this beauty is known as the Flame Nebula.
Larger telescopes will deeply appreciate this nebula’s many dark lanes, bright filaments and unique shape. For the large scope, place Zeta out of the field of view to the north at high power and allow your eyes to re-adjust. When you look again, you will see a long, faded ribbon of nebulosity called IC 434 to the south of Zeta that stretches for over a degree. The eastern edge of the “ribbonâ€? is very bright and mists away to the west, but look almost directly in the center for a small dark notch with two faint stars to the south. You have now located one of the most famous of the Barnard dark nebulae – B33. B33 is also known as the Horsehead Nebula. It’s a very tough visual object – the classic chess piece shape is only seen in photographs – but those of you who have large aperture can see a dark “nodeâ€? that is improved with a filter. B33 itself is nothing more than a small area cosmically (about 1 light-year in expanse) of obscuring dark dust, non-luminous gas, and dark matter – but what an incredible shape. If you do not succeed at first attempt? Do not give up. The “Horsehead” is one of the most challenging objects in the sky and has been observed with apertures as small as 150mm.
Now challenge yourself to a 6th magnitude open cluster just northwest of the top star in Orion’s bow (RA 04 49 24 Dec +10 56 00) as we have a look at NGC 1662. Discovered on this night in 1784 and cataloged as H VII.1 by Sir William Herschel, it won’t make the popular lists because it’s nothing more than a double handful of stars…or is it? Studied extensively for proper motion, this galactic cluster may have once held more stars earlier in its lifetime. Enjoy its bright blue and gold members and mark your notes for locating a binocular deep sky object!
Orion is filled with many more great deep sky objects, so get a good star chart and go hunting with the “Hunter”!
Sources:
Wikipedia
Chandra Observatory
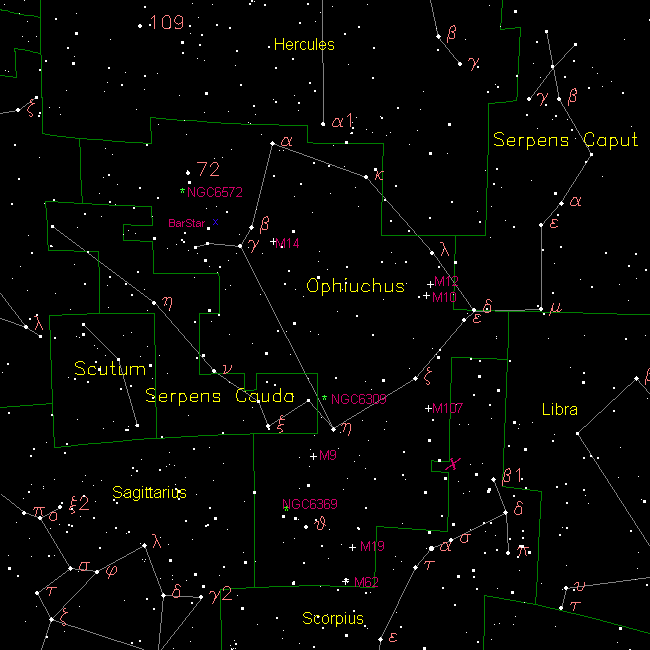
Star chart courtesy of Your Sky.


