The Strange Nebula Around Eta Carinae

One of the five PHOENIX spectrograph of Eta Carinae. Image credit: Gemini Observatory/AURA. Click to enlarge
Eta Carinae is an unusual variable star just 8,000 light years away from Earth. It’s about 100 times more massive than our Sun – one of the most massive known – and it shines about 5 million times brighter than the Sun. It’s surrounded by an unusual cloud of material known as the Homunculus Nebula, which astronomers believe was created by successive explosions on the star’s surface. The Gemini Observatory has revealed a shockwave of expanding material moving through space at 500 km/second (310 miles/s).

Although the Homunculus Nebula around the massive star Eta Carinae has been the subject of intense study for many years, it has always been reluctant to divulge its innermost secrets. However, an important chapter in the recent evolution of this unique star was revealed when Nathan Smith (University of Colorado) used the high-resolution infrared spectrograph PHOENIX on the Gemini South telescope to observe the bipolar nebula surrounding Eta Carinae.

Multi-slit spectroscopy allowed Smith to reconstruct both the geometry and the velocity structure of the expanding gas in the nebula based on the behavior of the molecular line of hydrogen H2 at 2.1218 microns and the atomic line of ionized iron [Fe II] at 1.6435 microns.

Analysis of the PHOENIX spectrum shows a very well-defined shell structure expanding ballistically at about 500 kilometers per second. A “thick,” warm inner dust shell traced by [Fe II] emission is surrounded by a cooler and denser outer shell that is traced by strong H2 emission. Even though the outer H2 skin is remarkably thin and uniform it contains about 11 solar masses of gas and dust ejected over a period of less than five years. The Gemini spectra show that the density in the outer shell may reach 107 particles per cm3.

The spatio-kinematic structure of H2 emission at the pinched waist of the nebula helps explain the unusual and complex structures seen in other high-resolution images. The current shape of the Homunculus nebula is of two well-defined polar lobes outlined by an outer massive shell of gas and dust. Smith states that these Gemini/PHOENIX data indicate that most of the mass lost during the Great Eruption of the mid-nineteenth century was limited to the high latitudes of the star, with almost all of the mechanical energy escaping between 45 degrees and the pole.

“The mass distribution in the nebula indicates that its shape is a direct result of an aspherical explosion from the star itself, instead of being pinched at the waist by the surrounding circumstellar material,” said Smith.

For more details read “The Structure of the Homunculus: I. Shape and Latitutude Dependence from H2 and [Fe II] velocity Maps of Eta Carinae,” by Nathan Smith, The Astrophysical Journal, in press or at astro-ph/0602464.

Original Source: Gemini Observatory

Star Explodes Inside Another Star

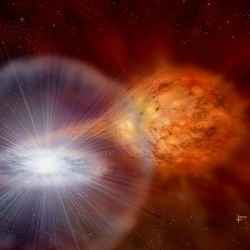
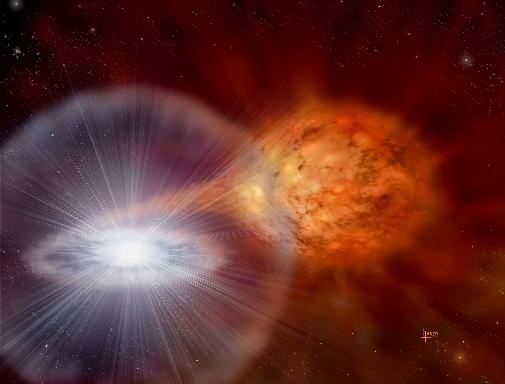
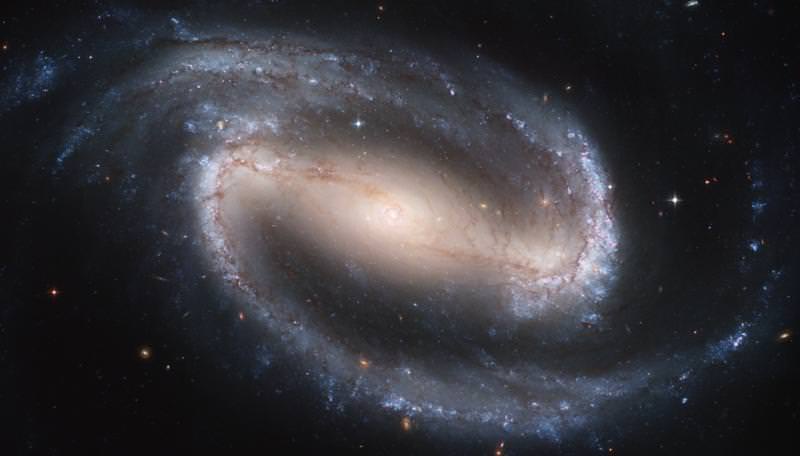
Artist’s impression of the explosion of RS Ophiuchi. Image credit: David A. Hardy. Click to enlarge
Astronomers recently noticed that the normally dim star RS Ophiuchi had brightened enough to be visible without a telescope. This white dwarf star has brightened like this 5 times in the last 100 years, and astronomers believe it’s about to collapse into a neutron star. RS Ophiuchi is in a binary system with a much larger red giant star. The two stars are so close that the white dwarf is actually inside the envelope of the red giant, and explodes from within it every 20 years or so.

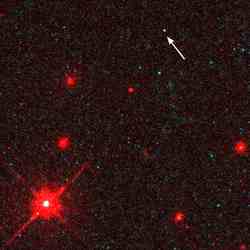
On 12 February 2006, amateur astronomers reported that a faint star in the constellation of Ophiuchus had suddenly become clearly visible in the night sky without the aid of a telescope. Records show that this so-called recurrent nova, RS Ophiuchi (RS Oph), has previously reached this level of brightness five times in the last 108 years, most recently in 1985. The latest explosion has been observed in unprecedented detail by an armada of space- and ground-based telescopes.

Speaking today (Friday) at the RAS National Astronomy Meeting at Leicester, Professor Mike Bode of Liverpool John Moores University and Dr Tim O’Brien of Jodrell Bank Observatory will present the latest results which are shedding new light on what happens when stars explode.

RS Oph is just over 5,000 light years away from Earth. It consists of a white dwarf star (the super-dense core of a star, about the size of the Earth, that has reached the end of its main hydrogen-burning phase of evolution and shed its outer layers) in close orbit with a much larger red giant star.

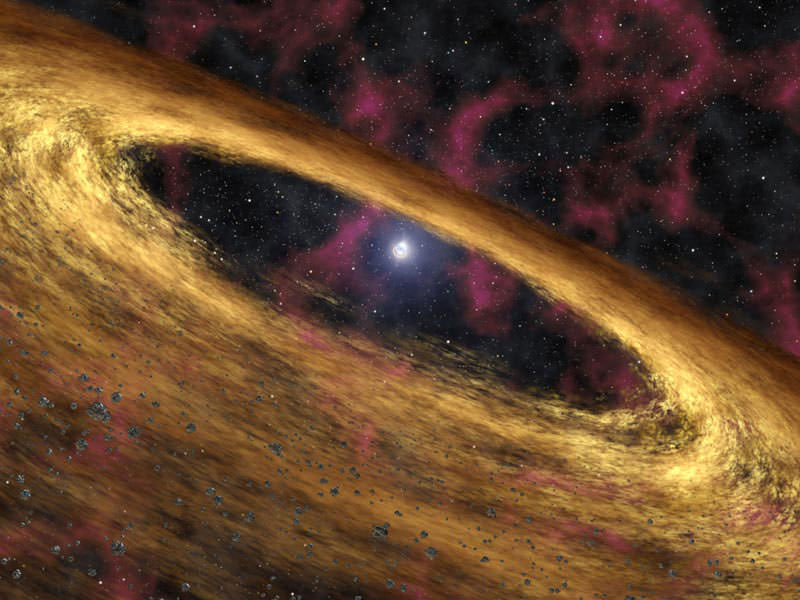
The two stars are so close together that hydrogen-rich gas from the outer layers of the red giant is continuously pulled onto the dwarf by its high gravity. After around 20 years, enough gas has been accreted that a runaway thermonuclear explosion occurs on the white dwarf’s surface. In less than a day, its energy output increases to over 100,000 times that of the Sun, and the accreted gas (several times the mass of the Earth) is ejected into space at speeds of several thousand km per second.

Five explosions such as this per century can only be explained if the white dwarf is near the maximum mass it could have without collapsing to become an even denser neutron star.

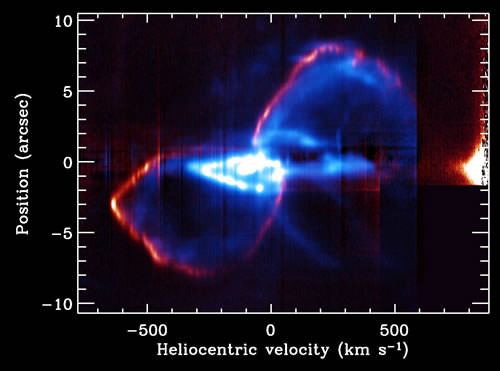
What is also very unusual in RS Oph is that the red giant is losing enormous amounts of gas in a wind that envelops the whole system. As a result, the explosion on the white dwarf occurs “inside” its companion’s extended atmosphere and the ejected gas then slams into it at very high speed.

Within hours of notification of the latest outburst of RS Oph being relayed to the international astronomical community, telescopes both on the ground and in space swung into action. Among these is NASA’s Swift satellite which, as its name suggests, can be used to react rapidly to things that change in the sky. Included in its armoury of instruments is an X-ray Telescope (XRT), designed and built by the University of Leicester.

“We realised from the few X-ray measurements taken late in the 1985 outburst that this was an important part of the spectrum in which to observe RS Oph as soon as possible,” said Professor Mike Bode of Liverpool John Moores University, who led the observing campaign for the 1985 outburst and now heads the Swift follow-up team on the current explosion.

“The expectation was that shocks would be set up both in the ejected material and in the red giant’s wind, with temperatures initially of up to around 100 million degrees Celsius – nearly 10 times that in the core of the Sun. We have not been disappointed!”

The first observations by Swift, only three days after the outburst began, revealed a very bright X-ray source. Over the initial few weeks, it became even brighter and then began to fade, with the spectrum suggesting that the gas was cooling down, although still at a temperature of tens of millions of degrees. This was exactly what was expected as the shock pushed into the red giant’s wind and slowed down. Then something remarkable and unexpected happened to the X-ray emission.

“About a month after the outburst, the X-ray brightness of RS Oph increased very dramatically,” explained Dr. Julian Osborne of the University of Leicester. “This was presumably because the hot white dwarf, which is still burning nuclear fuel, then became visible through the red giant’s wind.

“This new X-ray flux was extremely variable, and we were able to see pulsations which repeat every 35 seconds or so. Although it is very early days, and data are still being taken, one possibility for the variability is that this is due to instability in the nuclear burning rate on the white dwarf.”

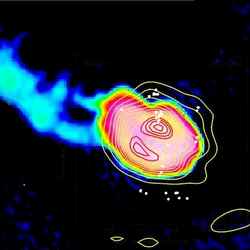
Meanwhile, observatories working at other wavelengths changed their programmes to observe the event. Dr. Tim O’Brien of Jodrell Bank Observatory, who did his PhD thesis work on the 1985 explosion, and Dr. Stewart Eyres of the University of Central Lancashire, lead the team that is securing the most detailed radio observations to date of such an event.

“In 1985, we were not able to begin observing RS Oph until nearly three weeks after the outburst, and then with facilities that were far less capable than those available to us today,” said Dr. O’Brien.

“Both the radio and X-ray observations from the last outburst gave us tantalising glimpses of what was happening as the outburst evolved. In addition, this time, we have developed very much more advanced computer models. The combination of the two now will undoubtedly lead to a greater understanding of the circumstances and consequences of the explosion.

“In 2006, our first observations with the UK’s MERLIN system were made only four days after the outburst and showed the radio emission to be much brighter than expected,” added Dr. Eyres. “Since then it has brightened, faded, then brightened again. With radio telescopes in Europe, North America and Asia now monitoring the event very closely, this is our best chance yet of understanding what is truly going on.”

Optical observations are also being obtained by many observatories around the globe, including the robotic Liverpool Telescope on La Palma. Observations are also being conducted at the longer wavelengths of the infrared part of the spectrum.

“For the first time we are able to see the effects of the explosion and its aftermath at infrared wavelengths from space, with NASA’s Spitzer Space Telescope,” said Professor Nye Evans of Keele University, who heads the infrared follow-up team.

“Meanwhile, the observations we have already obtained from the ground, from the United Kingdom Infrared Telescope on the summit of Mauna Kea in Hawaii, already far surpass the data we had during the 1985 eruption.

“The shocked red giant wind and the material ejected in the explosion give rise to emission not only at X-ray, optical and radio wavelengths, but also in the infrared, via coronal lines (so-called because they are prominent in the Sun’s very hot corona). These will be crucial in determining the abundances of the elements in the material ejected in the explosion and in confirming the temperature of the hot gas.”

26 February 2006 was a highlight of the observational campaign. In what must surely be a unique event, four space satellites, plus radio observatories around the globe, observed RS Oph on the same day.

“This star could not have exploded at a better time for international ground and space based studies of an event which has been changing every time we look at it,” said Professor Sumner Starrfield of Arizona State University, who heads the U.S. side of the collaboration. “We are all very excited and exchanging many emails every day trying to understand what is happening on that day and then predict the behaviour on the next.”

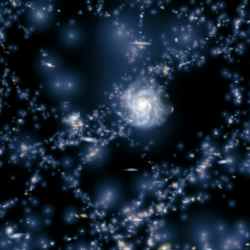
What is apparent is that RS Oph is behaving like a “Type II” supernova remnant. Type II supernovae represent the catastrophic death of a star at least 8 times the mass of the Sun. They also eject very high velocity material which interacts with their surroundings. However, the full evolution of a supernova remnant takes tens of thousands of years. In RS Oph, this evolution is literally occurring before our eyes, around 100,000 times faster.

“In the 2006 outburst of RS Oph, we have a unique opportunity of understanding much more fully such things as runaway thermonuclear explosions and the end-points of the evolution of stars,” said Professor Bode.

“With the observational tools now at our disposal, our efforts 21 years ago look rather primitive by comparison.”

Original Source: RAS News Release

Pulsars Form Planets Too

Artist illustration of a planetary disk forming around a pulsar. Image credit: NASA/JPL. Click to enlarge.
Think planets can only form around stars? Well, think again. NASA’s Spitzer Space Telescope has uncovered evidence for a potential planet-forming disk around a pulsar. In a former life, the pulsar would have been a large star 10-20 times bigger than the Sun that eventually consumed its fuel and exploded as a supernova. The remaining debris has started to collect again, and could eventually turn into new planets. This helps explain how planets were discovered around another pulsar in 1992, including one that’s Earth-sized.

NASA’s Spitzer Space Telescope has uncovered new evidence that planets might rise up out of a dead star’s ashes.

The infrared telescope surveyed the scene around a pulsar, the remnant of an exploded star, and found a surrounding disk made up of debris shot out during the star’s death throes. The dusty rubble in this disk might ultimately stick together to form planets.

This is the first time scientists have detected planet-building materials around a star that died in a fiery blast.

“We’re amazed that the planet-formation process seems to be so universal,” said Dr. Deepto Chakrabarty of the Massachusetts Institute of Technology in Cambridge, principal investigator of the new research. “Pulsars emit a tremendous amount of high energy radiation, yet within this harsh environment we have a disk that looks a lot like those around young stars where planets are formed.”

A paper on the Spitzer finding appears in the April 6 issue of Nature. Other authors of the paper are lead author Zhongxiang Wang and co-author David Kaplan, both of the Massachusetts Institute of Technology.

The finding also represents the missing piece in a puzzle that arose in 1992, when Dr. Aleksander Wolszczan of Pennsylvania State University found three planets circling a pulsar called PSR B1257+12. Those pulsar planets, two the size of Earth, were the first planets of any type ever discovered outside our solar system. Astronomers have since found indirect evidence the pulsar planets were born out of a dusty debris disk, but nobody had directly detected this kind of disk until now.

The pulsar observed by Spitzer, named 4U 0142+61, is 13,000 light-years away in the Cassiopeia constellation. It was once a large, bright star with a mass between 10 and 20 times that of our sun. The star probably survived for about 10 million years, until it collapsed under its own weight about 100,000 years ago and blasted apart in a supernova explosion.

Some of the debris, or “fallback,” from that explosion eventually settled into a disk orbiting the shrunken remains of the star, or pulsar. Spitzer was able to spot the warm glow of the dusty disk with its heat-seeking infrared eyes. The disk orbits at a distance of about 1 million miles and probably contains about 10 Earth-masses of material.

Pulsars are a class of supernova remnants, called neutron stars, which are incredibly dense. They have masses about 1.4 times that of the sun squeezed into bodies only 10 miles wide. One teaspoon of a neutron star would weigh about 2 billion tons. Pulsar 4U 0142+61 is an X-ray pulsar, meaning that it spins and pulses with X-ray radiation.

Any planets around the stars that gave rise to pulsars would have been incinerated when the stars blew up. The pulsar disk discovered by Spitzer might represent the first step in the formation of a new, more exotic type of planetary system, similar to the one found by Wolszczan in 1992.

“I find it very exciting to see direct evidence that the debris around a pulsar is capable of forming itself into a disk. This might be the beginning of a second generation of planets,” Wolszczan said.

Pulsar planets would be bathed in intense radiation and would be quite different from those in our solar system. “These planets must be among the least hospitable places in the galaxy for the formation of life,” said Dr. Charles Beichman, an astronomer at NASA’s Jet Propulsion Laboratory and the California Institute of Technology, both in Pasadena, Calif.

The Jet Propulsion Laboratory manages the Spitzer Space Telescope mission for NASA’s Science Mission Directorate, Washington. Science operations are conducted at the Spitzer Science Center at Caltech. JPL is a division of Caltech. Spitzer’s infrared array camera, which made the pulsar observations, was built by NASA’s Goddard Space Flight Center, Greenbelt, Md. The instrument’s principal investigator is Dr. Giovanni Fazio of the Harvard-Smithsonian Center for Astrophysics.

For more information about Spitzer, visit:

http://www.spitzer.caltech.edu/spitzer/

Original Source: NASA/JPL News Release

A Super Mercury was Smashed up 4.5 Billion Years Ago

Evolution of the impact three hours from the time of collision. Image credit: Horner et Al. Click to enlarge
According to current models of planetary formation, Mercury has too much mass. A new explanation proposes that Mercury was created from a much larger parent planet that collided with a giant asteroid 4.5 billion years ago. Astronomers from the University of Bern ran various scenarios modeling early versions of Mercury. This scenario of an early cataclysm best matched the current mass and composition of Mercury. Some of the ejected material would have made it all the way to Venus and even to the Earth.

A New computer simulations of Mercury’s formation show the fate of material blasted out into space when a large proto-planet collided with a giant asteroid 4.5 billion years ago. The simulations, which track the material over several million years, shed light on why Mercury is denser than expected and show that some of the ejected material would have found its way to the Earth and Venus.

“Mercury is an unusually dense planet, which suggests that it contains far more metal than would be expected for a planet of its size. We think that Mercury was created from a larger parent body that was involved in a catastrophic collision, but until these simulations we were not sure why so little of the planet’s outer layers were reaccreted following the impact,” said Dr Jonti Horner, who is presenting results at the Royal Astronomical Society’s National Astronomy Meeting on 5th April.

To solve this problem, Dr Horner and his colleagues from the University of Bern ran two sets of large-scale computer simulations. The first examined the behaviour of the material in both the proto-planet and the incoming projectile; these simulations were among the most detailed to date, following a huge number of particles and realistically modelling the behaviour of different materials inside the two bodies. At the end of the first simulations, a dense Mercury-like body remained along with a large swathe of rapidly escaping debris. The trajectories of the ejected particles were then fed in to a second set of simulations that followed the motion of the debris for several million years. Ejected particles were tracked until either they landed on a planet, were thrown into interstellar space, or fell into the Sun. The results allowed the group to work out how much material would have fallen back onto Mercury and investigate other ways in which debris is cleared up in the Solar System.

The group found that the fate of the debris depended on whereabouts Mercury was hit, both in terms of its orbital position and in terms of the angle of the collision.

Whilst purely gravitational theory suggested that a large fraction of the debris would eventually fall back onto Mercury, the simulations showed that it would take up to 4 million years for 50% of the particles to land back on the planet and in this time many would be carried away by solar radiation. This explains why Mercury retained a much smaller proportion than expected of the material in its outer layers.

The simulations also showed that some of the ejected material made its way to Venus and the Earth. While this is only a small fraction, it illustrates that material can be transferred between the inner planets relatively easily. Given the amount of material that would have been ejected in such a catastrophe, it is likely that there is a reasonable amount (possibly as much as 16 million billion tonnes [1.65×10^19 kg]) of proto-Mercury in the Earth.

Original Source: RAS News Release

Deep Space Alcohol

The cloud, where OH maser filament are red and extended methanol filaments are green. Image credit: JIVE Click to enlarge
Astronomers have located a gigantic cloud of methyl alcohol surrounding a stellar nursery. The cloud measures half a trillion km across (300 billion miles), and could help astronomers understand how some of the most massive stars in the Universe are formed. It’s methanol, not ethanol, so you wouldn’t want to drink it if you could reach it.

Astronomers based at Jodrell Bank Observatory have discovered a giant bridge of methyl alcohol, spanning approximately 288 billion miles, wrapped around a stellar nursery. The gas cloud could help our understanding of how the most massive stars in our galaxy are formed.

The new observations were taken with the UK’s MERLIN radio telescopes, which have recently been upgraded. The team studied an area called W3(OH), a region in our galaxy where stars are being formed by the gravitational collapse of a cloud of gas and dust. The observations have revealed giant filaments of gas that are emitting as ‘masers’ (molecules in the gas are amplifying and emitting beams of microwave radiation in much the same way as a laser emits beams of light).

The filaments of masing gas form giant bridges between maser ‘spots’ in W3(OH) that had been observed previously. The largest of these maser filaments is 288 billion miles (463 billion km) long. Observations show that the entire gas cloud appears to be rotating as a disc around a central star, in a similar manner to the accretion discs in which planets form around young stars. The maser filaments occur at shock boundaries where large regions of gas are colliding.

“Our discovery is very interesting because it challenges some long-accepted views held in astronomical maser research. Until we found these filaments, we thought of masers as point-like objects or very small bright hotspots surrounded by halos of fainter emission,” said Dr Lisa Harvey-Smith, who is the Principal Investigator for the study and is presenting results at the Royal Astronomical Society’s National Astronomy Meeting on 4th April.

Since the upgrade of the UK’s MERLIN telescope network, astronomers have been able to image methanol masers with a much higher sensitivity and, for the first time, get a complete picture of all the radiation surrounding maser sources. In the new study, the Jodrell Bank team looked at the motion of the W3(OH) star forming region in 3-dimensions and also measured physical properties of the gas such as temperature, pressure and the strength and direction of the magnetic fields. This information is vital when testing theories about how stars are born from the primordial gas in stellar nurseries.

Dr Harvey-Smith said, “There are still many unanswered questions about the birth of massive stars because the formation centres are shrouded by dust. The only radiation that can escape is at radio wavelengths and the upgraded MERLIN network is now giving us the first opportunity to look deep into these star forming regions and see what’s really going on.”

The many different types of interactions between molecules in star forming regions lead to emissions in many different wavelengths. Future observations of masers at other frequencies are planned to complete the complex jigsaw puzzle that has now been revealed.

Dr Harvey-Smith adds, “Although it is exciting to discover a cloud of alcohol almost 300 billion miles across, unfortunately methanol, unlike its chemical cousin ethanol, is not suitable for human consumption!”

Original Source: RAS News Release

Galaxies Trapped in the Universe’s Web

Galaxies are not randomly distributed. Image credit: IAC Click to enlarge
Although the galaxies we see in the night sky seem randomly strewn across the heavens, they’re actually organized into large scale structures that look like cosmic filaments. These filaments and walls surround huge bubble-like voids that lack any large structures at all. European astronomers measured the orientation of thousands of galaxies, and found that many are oriented in the direction of these linear filaments.

Astronomers from the University of Nottingham, UK, and the Instituto de Astrofisica de Canarias (Spain), have found the first observational evidence that galaxies are not randomly oriented.

Instead, they are aligned following a characteristic pattern dictated by the large-scale structure of the invisible dark matter that surrounds them.

This discovery confirms one of the fundamental aspects of galaxy formation theory and implies a direct link between the global properties of the Universe and the individual properties of galaxies.

Galaxy formation theories predicted such an effect, but its empirical verification has remained elusive until now. The results of this work were published the 1 April issue of Astrophysical Journal Letters.

Nowadays, matter is not distributed uniformly throughout space but is instead arranged in an intricate “cosmic web” of filaments and walls surrounding bubble-like voids. Regions with high galaxy concentrations are known as galaxy clusters whereas low density regions are termed voids.

This inhomogeneous distribution of matter is called the “Large-scale distribution of the Universe.” When the Universe is considered as whole, this distribution has a similar appearance to a spider’s web or the neural network of the brain. But it was not always like this.

After the Big Bang, when the Universe was much younger, matter was distributed homogeneously. As the Universe was evolving, gravitational pulls began to compress the matter in certain regions of space, forming the large-scale structure that we currently observe.

According to these models and theories a direct consequence of this process is that galaxies should be preferentially oriented perpendicularly to the direction of the linear filaments.

Several observational studies have looked for a preferential spatial orientation (or alignment) of galaxy rotation axes with respect to their surrounding large-scale structures. However, none of them have been successful, due to the difficulties associated with trying to characterise the filaments.

The research conducted by the astrophysical group formed by Ignacio Trujillo (University of Nottingham, UK), Conrado Carretero and Santiago G. Patiri, (both from the Instituto de Astrofisica de Canarias, Spain) has been able to measure this effect, confirming theoretical predictions.

To achieve this goal, they used a new technique based on the analysis of the huge voids that are found in the large-scale structure of the Universe. These voids have been detected by searching for large regions of space depleted of bright galaxies.

In addition, they took advantage of information provided by the two largest sky surveys yet undertaken: the Sloan Digital Sky Survey and the Two Degree Field Survey. These surveys contain positional information for more than half a million galaxies located within a distance of one billion light-years of the Earth.

Other parameters provided by the surveys, such as the position angle and the ellipticity of the objects, were used to estimate the orientation of the disk galaxies.

“We found that there is an excess of disk galaxies that are highly inclined relative to the plane defined by the large-scale structure surrounding them,” explained Dr. Trujillo. “Their rotation axes are mainly oriented in the direction of the filaments.

“Our work provides important confirmation of the tidal torque theory which explains how galaxies have acquired their current spin,” said Trujillo.

“The spin of the galaxies is believed to be intrinsically linked to their morphological shapes. So, this work is a step forward on our understanding of how galaxies have reached their current shapes.”

Dr. Ignacio Trujillo has a research assistant position, funded by PPARC, in the School of Physics and Astronomy at the University of Nottingham.

An abstract of the paper is available on the web at:
http://xxx.lanl.gov/abs/astro-ph/0511680

Original Source: RAS News Release

Deep Impact Caused a Great Gush of Water Vapour

Deep Impact. Image credit: NASA. Click to enlarge
When Deep Impact collided with Tempel 1, it released an amazing amount of water vapour from the comet – as much as 250,000 tonnes were blasted into space. These measurements were made by NASA’s Swift satellite, which normally locates and observes gamma ray bursts. Swift, like almost every other telescope on Earth and in space was pointed at Comet Tempel 1 when Deep Impact smashed into it last July. Swift monitored the X-ray emissions before and after the collision, and used that to measure the amount of water vapour ejected.

Over the weekend of 9-10 July 2005 a team of UK and US scientists, led by Dr. Dick Willingale of the University of Leicester, used NASA’s Swift satellite to observe the collision of NASA’s Deep Impact spacecraft with comet Tempel 1. Reporting today (Tuesday) at the UK 2006 National Astronomy Meeting in Leicester, Dr. Willingale revealed that the Swift observations show that the comet grew brighter and brighter in X-ray light after the impact, with the X-ray outburst lasting a total of 12 days.

“The Swift observations reveal that far more water was liberated and over a longer period than previously claimed,” said Dick Willingale.

Swift spends most of its time studying objects in the distant Universe, but its agility allows it to observe many objects per orbit. Dr. Willingale used Swift to monitor the X-ray emission from comet Tempel 1 before and after the collision with the Deep Impact probe.

The X-rays provide a direct measurement of how much material was kicked up after the impact. This is because the X-rays were created by the newly liberated water as it was lifted into the comet’s thin atmosphere and illuminated by the high-energy solar wind from the Sun.

“The more material liberated, the more X-rays are produced,” explained Dr. Paul O’Brien, also from the University of Leicester.

The X-ray power output depends on both the water production rate from the comet and the flux of subatomic particles streaming out of the Sun as the solar wind. Using data from the ACE satellite, which constantly monitors the solar wind, the Swift team managed to calculate the solar wind flux at the comet during the X-ray outburst. This enabled them to disentangle the two components responsible for the X-ray emission.

Tempel 1 is usually a rather dim, weak comet with a water production rate of 16,000 tonnes per day. However, after the Deep Impact probe hit the comet this rate increased to 40,000 tonnes per day over the period 5-10 days after impact. Over the duration of the outburst, the total mass of water released by the impact was 250,000 tonnes.

One objective of the Deep Impact mission was to determine what causes cometary outbursts. A simple theory suggests that such outbursts are caused by the impact of meteorites on the comet nucleus. If this is the case, Deep Impact should have initiated an outburst.

Although the impact was observed across the electromagnetic spectrum, most of what was seen was directly attributable to the impact explosion. After 5 days, optical observations showed that the comet was indistinguishable from its state prior to the collision. This was in stark contrast to the X-ray observations.

The analysis of the X-ray behaviour by the Swift team indicates that the collision produced an extended X-ray outburst largely because the amount of water produced by the comet had increased.

“A collision such as Deep Impact can cause an outburst, but apparently something rather different from the norm can also happen,” said Dr. Willingale. “Most of the water seen in X-rays came out slowly, possibly in the form of ice-covered dust grains.”

Original Source: RAS News Release

Simulating the Early Universe

Spiral galaxy NGC 1300. Image credit: Hubble. Click to enlarge
Researchers have harnessed the power one of the world’s fastest supercomputers – the Earth Simulator – to model the growth of galaxies in the early Universe. The team simulated the process right from the beginning, shortly after the Big Bang, when clumps of gas came together to form stars which then merged into larger and larger collections, and finally became galaxies. They found that galaxies like the Milky Way probably have the same composition now as they did only a billion years after the Big Bang.

Two astronomers have performed one of the world’s largest astrophysics simulations to date in order to model the growth of galaxies. Using the “Earth Simulator” supercomputer in Japan, which is also used for climate modelling and simulating seismic activity, Masao Mori of the University of California at Los Angeles and Masayuki Umemura at the University of Tsukuba have calculated how galaxies evolved from just 300 million years after the Big bang to the present day. The results show that galaxies may have evolved much faster than currently believed (Nature 440 644).

According to the “hierarchical” model, galaxies are formed via a bottom-up process that starts with the formation of small clumps of gas and stars that then merge into bigger systems. Mori and Umemura simulated this process using a powerful 3D hydrodynamic code combined with a “spectral synthesis” code for an astrophysical plasma in order to take into account the dynamical and chemical evolution of a primordial galaxy. The Earth-Simulator simulation was performed with an ultra-high resolution based on 1024 “grid points”, making it one of the biggest calculations ever performed in astrophysics.

Mori and Masayuki set up the initial conditions in their simulation based on a cold dark matter universe, the parameters of which are determined by measurements of the cosmic microwave background. These observations, first made in 2003, show that we are living in a flat universe comprising just 4% ordinary matter, 22% dark matter and 74% dark energy – in agreement with the standard model of cosmology. The researchers then directly compared their numerical results with observations of primitive galaxies called Lyman-alpha emitters and “Lyman break” galaxies, which astronomers find in the most distant and therefore oldest parts of the universe.

The results show that the primordial bubbles of gas that formed in the early universe just 300 millions years after the Big Bang do indeed look like Lyman-alpha emitters. After about 1 billion years, the simulations show that these galaxies mutate into Lyman break galaxies. Finally, after 10 billion years of evolution, the structures resemble present-day elliptical galaxies.

The simulation also predicts the mixture of chemical elements in the galaxy at each stage of its evolution, and suggests that our Milky Way has roughly the same composition today as it did when it was just 1 billion years old. Until now, galaxies were thought to have evolved gradually and become enriched in heavier elements beyond hydrogen and helium over a period of 10 billion years by repeated star formation and supernova explosions.

“Our finding shows that galaxy formation proceeded much faster and that a large amount of heavy elements were produced in galaxies in just 1 billion years,” says Mori.

Original Source: Institute of Physics

The Strongest Magnetic Fields in the Universe

NASA’s first look at a lonely neutron star. Image credit: NASA/HST Click to enlarge
The most powerful explosions in the Universe are the mysterious gamma ray bursts, which astronomers now think are collisions between neutron stars. A new simulation has calculated that in the moments after a collision, the explosion generates a magnetic field 1000 million million times more powerful than the Earth’s magnetic field – the strongest magnetic fields in the Universe. The simulation took weeks on a supercomputer to calculate just a few milliseconds of a collision between neutron stars.

Scientists from The University of Exeter and the International University, Bremen have discovered what is thought to be the strongest magnetic field in the Universe. In a paper in the journal Science, Dr Daniel Price and Professor Stephan Rosswog show that violent collisions between neutron stars in the outer reaches of space create this field, which is 1000 million million times larger than our earth’s own magnetic field. It’s thought that these collisions could be behind some of the brightest explosions in the Universe since the Big Bang, so-called short Gamma-ray bursts.

Dr Daniel Price, of the School of Physics at The University of Exeter, said: “We have managed to simulate, for the first time, what happens to the magnetic field when neutron stars collide, and it seems possible that the magnetic field produced could be sufficient to spark the creation of Gamma-ray bursts. Gamma-ray bursts are the most powerful explosions we can detect but until recently little to nothing has been known about how they are generated. It’s thought that strong magnetic fields are essential in producing them, but until now no one has shown how fields of the required intensity could be created.”

He continues: “What really surprised us was just how fast these tremendous fields are generated – within one or two milliseconds after the stars hit each other.”

Prof Stephan Rosswog, of the International University, Bremen, Germany, adds: “Even more incredible is that the magnetic field strengths reached in the simulations are just lower limits on the strengths that may be actually be produced in nature. It has taken us months of nearly day and night programming to get this project running – just to calculate a few milliseconds of a single collision takes several weeks on a supercomputer.”

The remnants of supernovae, neutron stars are formed when massive stars run out of nuclear fuel and explode, shedding their outer layers and leaving behind a small but extremely dense core. When two neutron stars are left orbiting each other, they will spiral slowly together, resulting in these massive collisions.

Original Source: University of Exeter

Nearby Clouds of Gas are Stellar Nursaries in the Making

Astronomers from Boston University have carefully mapped the giant gas clouds in our region of the Milky Way, offering clues to the environment that helped create our Solar System. The team used a large radio telescope that captures high frequency radio waves. When viewed at this wavelength, the clouds are far more transparent, and their inner structure is revealed. All of the clouds they’ve studied so far are lumpy, and will eventually be the birthplaces of stars.

A team of astronomers from Boston University’s Institute for Astrophysical Research has produced the clearest map to-date of the giant gas clouds in the Milky Way that serve as the birthplaces of stars. Using a powerful telescope, the astronomers tracked emissions of a rare form of carbon monoxide called 13CO to chart a portion of our home galaxy and its star-forming molecular clouds.

The researchers hope the new illustration will aid in the identification of additional clouds and study of their internal structure to better understand the origin of stars like the sun, which began its life in such a cloud about 5 billion years ago. The data and images are published in the March issue of the Astrophysical Journal Supplement.

The eight-year project, called the Boston University-Five College Radio Astronomy Observatory (FCRAO) Galactic Ring Survey (GRS), was led by a team of astronomers based at BU, the University of Cologne in Germany, and the University of Massachusetts.

To produce the detailed image, the astronomers mapped the location of 13CO in the Milky Way using a large radio telescope operated by the FCRAO of the University of Massachusetts that captures and images radio emissions at a frequency near 100,000 MHz – about 1,000 times higher than FM stations. When viewed in the emission from 13CO, the clouds are far more transparent than the more traditionally studied 12CO which allowed the team to peer more deeply into their interior.

“The value of such high range imaging is that it enables us to identify the underlying patterns of gas distribution and speeds that point toward the key physical processes occurring within the molecular gas phase of the interstellar medium,” said Dr. Mark Heyer, a researcher from UMass involved in the project.

Using a new receiver developed at UMass, the astronomers could depict the structure of the clouds faster and with much finer detail than any previous attempts. As an added benefit, the distribution of the clouds also delineates the spiral structure of the Milky Way.

“Ironically, because we live inside the Milky Way, we know more about the shapes of far more distant galaxies better than our own,” said James Jackson, astronomy professor at BU and lead investigator of the study. “The GRS map helps us better understand the configuration of our home galaxy and its components.”

“Upon seeing the GRS image, I knew right away it was something terrific. It was like the first time I put on glasses as a kid, and wondered how I ever got along without knowing about every shape, contour and detail of the world around me,” said Dr. Ronak Shah, a researcher from BU who worked on the project. “The GRS has that affect on a lot of us. We thought we understood the Milky Way and then the GRS revealed so much more detail to explore.”

According to Dr. Robert Simon, now at the University of Cologne, but who started the project with Jackson in 1998 at BU, the information from the GRS will constitute an important new database for the study of molecular clouds and Milky Way structure for generations of astronomers.

The scientists are now closely analyzing the image and one of the initial findings is the probable identification of dark, cold molecular clouds in the earliest stages of star development.

“Data from the Galactic Ring Survey have shown that these clouds are the counterparts to active, bright star-forming clouds, but because they have not yet been heated by the embedded stars, they are much colder and quieter,” said Jackson. “Follow-up studies of these clouds will provide additional important clues about the origin of stars since we’ll be able to examine them at an earlier point in their life.”

Another interesting result is that all of the molecular clouds studied so far have similar lumpy structures, regardless of their size, mass, and star-forming activity. These lumps will eventually become stars and, according to the researchers, this similarity suggests that all clouds form stars of various masses in roughly the same proportion.

The Milky Way is a vast disk of 100 billion stars, gas, and dust and because it is flat, the map is long and narrow. Since most of the Galaxy lies in the southern skies, unreachable from Northern Hemisphere telescopes, and because many of the molecular gas clouds are concentrated toward its inner regions, only a portion was imaged.

The Institute for Astrophysical Research (IAR) was founded in 1998 in order to promote and facilitate research and education in astrophysics at Boston University. The IAR supports research by BU Astronomy faculty members, graduate and undergraduate students, and postdoctoral and senior research associates. In addition, the IAR manages and coordinates the use of astrophysical research facilities and promotes the design, development, and operation of instruments and telescopes for astronomical research.

Founded in 1839, Boston University is an internationally recognized institution of higher education and research. With more than 30,000 students, it is the fourth largest independent university in the United States. BU contains 17 colleges and schools along with a number of multi-disciplinary centers and institutes which are central to the school’s research and teaching mission.

Original Source: Boston University