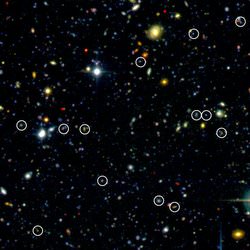
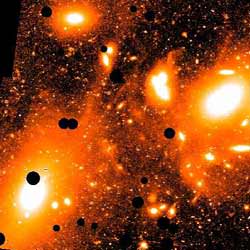
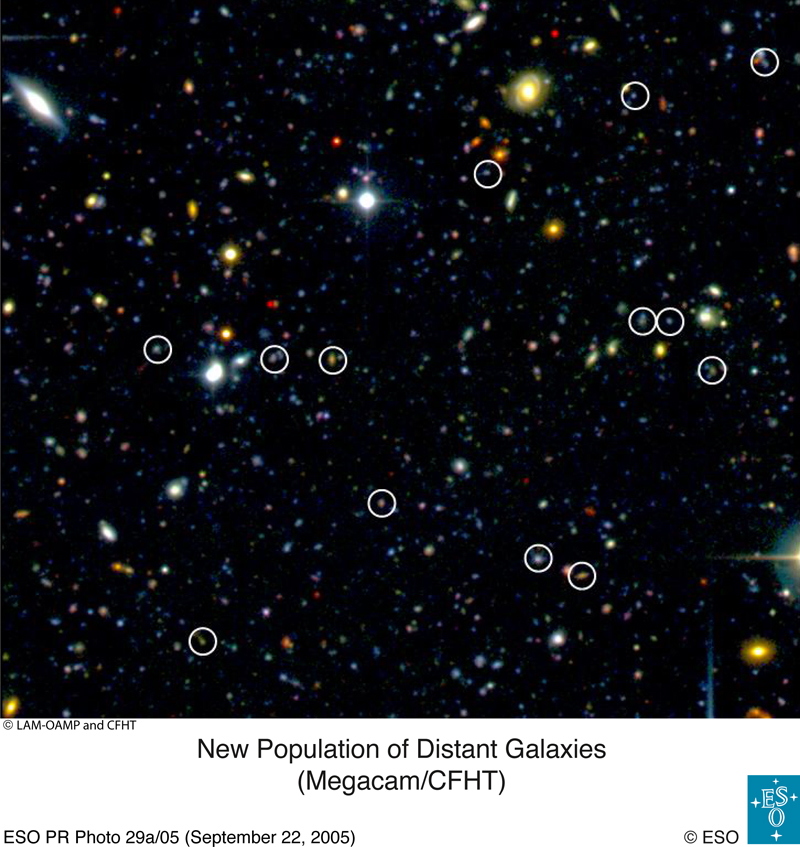
Gemini Sees Smashing Planetesimals

Astronomers using the Gemini South 8-meter telescope in Chile have observed new details in the dusty disk surrounding the nearby star Beta Pictoris which show that a large collision between planetary-sized bodies may have occurred there as recently as the past few decades.

The mid-infrared observations provide the best evidence yet for the occurrence of energetic encounters between planetesimals during the process of planetary formation.

“It is as if we were looking back about 5 billion years and watching our own solar system as it was forming into what we see today,” said Dr. Charles Telesco of the University of Florida who led the team. “Our research is a bit like a detective dusting for fingerprints to figure out a crime scene, only in this case we use the dust as a tracer to show what has happened within the cloud. The properties of the dust show not only that this was a huge collision, but that it probably happened recently in both astronomical and even human timescales.”

The team?s data revealed a significantly higher concentration of small dust grains in one region of the debris disk that gave Beta Pictoris a lopsided appearance in previous observations. According to team member Dr. Scott Fisher of the Gemini Observatory, it is the unique properties of this fine dust that allows speculation on the timing of this collision. “Many of us remember pounding chalk dust out of erasers in school,? he said. ?After you sneeze a few times, you open a window and the fine dust blows away. In Beta Pictoris, the radiation from the star will blow away the fine particles created by the collision quite rapidly. The fact that we still see them in our observations means that the collision probably happened in the past 100 years or so. Almost assuredly my grandparents were alive when this collision occurred.?

Computer models done at the University of Florida by team members Dr. Stanley Dermott, Dr. Tom Kehoe and Dr. Mark Wyatt (of the Royal Observatory, Edinburgh, UK) show that the timescales necessary to remove this fine dust in Beta Pictoris are on the order of decades. “This process moves out the smaller dust particles very quickly and leaves behind the larger debris,” said Dermott. “The larger particles will eventually disperse throughout the cloud as it orbits around the central star and the bright clump we see now will essentially dissolve into the disk.”

Disks of material surrounding stars such as Beta Pictoris are thought to contain objects of all sizes, from small dust grains similar to household dust to large planetesimals, or developing planets. As all of these objects orbit around the star, just like the Earth circles the Sun, they occasionally collide. The largest of these catastrophic encounters leave behind tell-tail debris clouds of fine dust observable at infrared wavelengths. By collecting high-resolution images from across a broad swath of the thermal infrared part of the spectrum, the research team from the US, UK and Chile was able to study such a cloud within the larger Beta Pictoris disk and analyze the images to determine the spatial distribution and estimate the size of the debris particles in the post-collision aftermath.

A collision similar to this one may well have created our own Moon several billion years ago when a Mars-sized body collided with what would eventually become the Earth. While the Moon itself formed out of large rocks and debris created by the collision, the small dust particles were blown away by radiation pressure from the young Sun. In the Beta Pictoris system radiation from the central star blows at about 15 times the intensity of the Sun, clearing out small grains even more quickly.

Because the Beta Pictoris disk is oriented to us edge-on, the observed asymmetry is visible as a bright ?clump? in the cigar-shaped cloud of material orbiting the central star. The Gemini images also reveal new structures in the disk that might show where planets are forming in the system. The team is still studying these features, and follow-up observations are planned using Gemini South?s newly silver-coated 8-meter mirror. This silver coating (now on both Gemini telescopes) makes the twin telescopes the most powerful facilities on Earth for this type of infrared research.

Beta Pictoris was one of the first “circumstellar” disks discovered by astronomers. It was initially detected in IRAS (Infrared Astronomy Satellite) data in 1983 by a team led by Dr. Fred Gillett (formerly Gemini?s Lead Scientist) and then imaged by Dr. Bradley Smith and Dr. Richard Terrile. Its lopsided nature was apparent even then, but until recently, observations yielded insufficient data at high-enough resolutions to show the clumpy nature of this asymmetry and estimate the relative particle distribution in the cloud.

The Gemini data were obtained using the Gemini Thermal-Region Camera Spectrograph (T-ReCS) on the Gemini South Telescope on Cerro Pach?n in Chile.

The international team published their findings and conclusions in the January 13 issue of the journal Nature and in San Diego, California at the 205th meeting of the American Astronomical Society.

Original Source: Gemini News Release

Super Star Clusters Started Small

A trio of massive, young star clusters found embedded in a star cloud may shed light on the formation of super-star clusters and globular clusters.

The discovery, made with images taken with the Hubble Space Telescope, is being presented today by You-Hua Chu and Rosie Chen of the University of Illinois at
Urbana-Champaign and Kelsey Johnson of the University of Virginia to the American Astronomical Society meeting in San Diego. This finding indicates that super-star clusters may be formed by coalescence of smaller clusters.

The tightly packed group of clusters was found in the core of the active star formation region NGC 5461, within an arm of the giant spiral galaxy M101. This galaxy is located about 23 million light-years away in the constellation Ursa Major (the Big Dipper).

?NGC 5461 has such a high concentration of light in its core that some astronomers have thought it might host a super-star cluster,? said Chu, who is a professor of astronomy at Illinois and principal investigator of the project. Super-star clusters, with a total mass of up to 1 million times that of the sun, are five to 50 times more massive than the spectacular R136 cluster at the center of the Tarantula Nebula in the Large Magellanic Cloud. They are believed to be the young counterparts of the massive globular clusters in our galaxy.

Hubble Space Telescope images of the core of NGC 5461 revealed a tight group of three massive clusters surrounded by a cloud of stars within a region about 100 light-years in diameter. Although each cluster is comparable to the R136 cluster, the total mass within this small volume is similar to that of a super-star cluster.

?If NGC 5461 were several times farther away, even the Hubble Space Telescope would be unable to resolve this tight group of clusters,? said Chen, a graduate student at Illinois. ?It is possible that some of the super-star clusters previously reported in distant galaxies actually consist of groups of clusters similar to NGC 5461.?

The large amount of mass at the core of NGC 5461 produces a strong gravitational field, causing the clusters and stars to move and interact dynamically. The rapidly fluctuating gravitational field produced by this interaction dissipates the relative motion of the clusters into random motions of individual stars. Eventually, the clusters and surrounding star cloud will merge into one single star cluster.

?The Hubble Space Telescope images of NGC 5461 provide a unique glimpse of a super-star cluster in the making,? said Johnson, a professor of astronomy at Virginia. ?There is no super-star cluster yet, but it is just a matter of time.?

The dynamical evolution of the clusters at the core of NGC 5461 is being simulated by astronomy professor Paul Ricker at Illinois. Preliminary results show that under optimal conditions these clusters may merge within a few million years.

?Fortunately, NGC 5461 is near enough, and young enough for us to resolve it with the Hubble Space Telescope,? Chu said. ?We were indeed lucky to catch it at such an opportune time.?

The work was supported by the National Aeronautics and Space Administration. The researchers will report their findings in the Feb. 1 issue of the Astrophysical Journal.

Original Source: UIUC News Release

White Dwarf Theories Get More Proof

Image credit: McDonald Observatory
Observations of the white dwarf star, Sirius B, made with NASA’s Far Ultraviolet Spectroscopic Explorer (FUSE) satellite give astronomers firm new evidence that mathematical models widely used to predict white dwarf star mass and radius are correct.

Jay B. Holberg of the University of Arizona Lunar and Planetary Laboratory is presenting the result today at the American Astronomical Society in San Diego.

The FUSE result is important because Sirius B is one of the few stars that astronomers have to test their ideas on the relationship between mass and radius for white dwarf stars. White dwarf stars are small but astonishingly dense stars. Sirius B is the size of the Earth and as massive as the sun.

Theory that describes how white dwarf stars can exist emerged in the early 1930s, when Subramanyan Chandrasekhar ? or Chandra, as he was known ? calculated the limit to a white dwarf’s mass by applying Einstein’s theory of special relativity. It was one of the first applications of quantum mechanics to large physical systems in the sky.

No white dwarf star could be more than 1.4 times as massive as the sun or it will collapse, Chandra predicted.

“Chandra was the first person to lay out the essential details of how white dwarfs sustain themselves, and it is very, very different from the sun or any other stars,” Holberg said.

Unlike most white dwarfs, Sirius B is part of a binary system, and astronomers can determine the mass of stars in a binary system.

“Having a binary system ? when two stars orbit one another – is virtually the only way you can fundamentally measure the mass of a star,” Holberg said. “You observe their orbits, get the period, know how far away they are, and you can find the sum of the two star masses. If you can time the orbits and know how far apart the stars are, you can determine the individual star masses. That’s the most accurate way, the acceptable way to determine star masses.

“But this star has always been devilishly difficult to observe,” Holberg said. The primary star in the system, Sirius A, is 8 light years from Earth and has twice the mass of the sun. It is the brightest star in the night sky, visible below Orion. Sirius B is 10,000 times dimmer than Sirius A. Astronomers can?t even see the white dwarf companion when it comes closest to the primary star during its 50-year, very elongated orbit around Sirius A.

For the post several years, Holberg and colleagues have observed Sirius B with the Voyager and Extreme Ultraviolet Explorer spacecrafts. They have refined the star’s temperature and gravity – gravity being the gravitational field at the surface of the star – to refine estimates of its mass and radius.

“The methods we’re using are spectroscopic. They infer the mass from synthetic models that we produce from measurements of temperature and gravity, the only two parameters of matter for a white dwarf.”

Holberg and his colleagues published the best determination of Sirius B’s mass-radius relationship in 1998, but that was “still far from definitive,” Holberg said. “That is, the uncertainties are so large, that while these studies define the basic relationship, they don?t tell you lots of details we need to know about these stars.”

The FUSE observations gave Holberg and his colleagues better spectral data on Sirius B’s gravitational field and temperature needed to calculate mass. “And this is a very clean spectrum. We rolled the FUSE spacecraft to keep Sirius A from contaminating the spectrum, and we succeeded very well.

“The mathematical model very well predicts our results on the gravitational field, temperature and brightness of this white dwarf star,” Holberg said. “That helps us determine the radius of the star. What we really want to do is determine mass and radius to within one percent. By verifying the Chandrasekhar limit, you put a great deal of astrophysics on much firmer footing,” he added.

“Astronomy has reached the level where you can make very definitive comparisons between the models and the observations. And it looks like we are going to come out to what we expected,” Holberg said.

Original Source: University of Arizona News Release

Blobs Could Be Merging Galaxies

Astronomers have numerous technical terms and numbering systems for describing the universe, but one type of mysterious object has yet to be classified. For now, these oddities are named for their strange appearance. They are called blobs.

Today, at the 205th annual meeting of the American Astronomical Society in San Diego, Calif., astronomers presented new evidence in the case of the giant galactic blobs. These blobs are huge clouds of intensely glowing material that envelop faraway galaxies. Using NASA’s Spitzer Space Telescope and its powerful infrared vision, the astronomers caught a glimpse of the galaxies tucked inside the blobs. Their observations reveal monstrously bright galaxies and suggest that blobs might surround not one, but multiple galaxies in the process of merging together.

“It is possible that extremely bright galactic mergers lie at the center of all the mysterious blobs, but we still don’t know how they fuel the blobs themselves,” said Dr. Harry Teplitz, Spitzer Science Center, California Institute of Technology, Pasadena, Calif., co-author of the new research. “It’s like seeing smoke in the distance and now discovering that it’s a forest fire, not a house or car fire, but still not knowing whether it was caused by lightning or arson.”

The findings will ultimately provide a better understanding of how galaxies, including ones like our own Milky Way, form.

Blobs were first discovered about five years ago with visible-light telescopes. They are located billions of light-years away in ancient galactic structures or filaments, where thousands of young galaxies are clustered together. These large, fuzzy galactic halos are made up of hot hydrogen gas and are about 10 times as large as the galaxies they encompass. Astronomers can see glowing blobs, but they don’t know what provides the energy to light them up.

“To figure out what’s going on, we need to better characterize the galaxies at the center of the blobs,” said Dr. James Colbert, Spitzer Science Center, first author of the study.

That’s where Spitzer comes in. Spitzer can sense the infrared glow from the dusty galaxies inside the blobs. When Colbert and colleagues used Spitzer to look at four well-known blobs located in a galactic filament 11 billion light-years away, they discovered that one of them appears to be made up of three galaxies falling into each other — an unusual cosmic event. The finding is intriguing because previous observations from NASA’s Hubble Space Telescope found that another one of the four blobs surrounds a merger between two galaxies. The astronomers speculate that all blobs might share this trait; however, more evidence is needed to close the case.

One clue that the scientists might be on the right track has to do with the infrared brightness of the blob galaxies. To visible-light telescopes, these galaxies appear unremarkable. Spitzer measurements revealed that all four of the galaxies studied are among the brightest in the universe, giving off the equivalent light of trillions of Suns. Such luminous galaxies are often triggered when smaller, gas-rich ones crash together, supporting the notion that galactic mergers might make up the cores of blobs.

Even if galactic mergers are fingered as the culprit, the mystery of the giant galactic blobs will persist. Astronomers will have to figure out why mergers are producing such tremendous clouds of material.

“Far from solving the mystery of the blobs, these observations only deepen it. Not only are the gas clouds bizarre, we now know that they contain some of the brightest and most violent galaxies in the universe,” said Teplitz.

Other authors of this work include Dr. Paul Francis, The Australian National University Canberra, Australia; Dr. Povilas Palunas, University of Texas at Austin; Dr. Gerard Williger, Johns Hopkins University, Baltimore, Md.; and Dr. Bruce E. Woodgate, NASA’s Goddard Space Flight Center, Greenbelt, Md.

NASA’s Jet Propulsion Laboratory, Pasadena, Calif., manages the Spitzer Space Telescope mission for NASA’s Science Mission Directorate, Washington, D.C. Science operations are conducted at the Spitzer Science Center. The telescope’s multiband imaging photometer, which made the new Spitzer observations, was built by Ball Aerospace Corporation, Boulder, Colo., the University of Arizona, Tucson, and Boeing North American, Canoga Park, Calif. The instrument’s development was led by Dr. George Rieke, University of Arizona.

Images and additional information about the Spitzer Space Telescope are available at http://www.spitzer.caltech.edu/Media.

Original Source: NASA/JPL News Release

Sedna Might Have Formed Past Pluto

Image credit: SWRI
Recently, astronomers reported the surprising discovery of a very large diameter Kuiper Belt planetoid — (90377) Sedna — on a distant, 12,500-year-long, eccentric orbit centered approximately 500 astronomical units from the Sun. Sedna’s estimated diameter is about 1,600 km, two-thirds that of Pluto. Initial studies of Sedna’s origin have speculated that it might have been ejected from the giant planets region of our solar system far inside the orbit of Pluto, or perhaps was captured from a passing star’s Kuiper Belt.

In a report published in the January 2005 issue of The Astronomical Journal, planetary scientist Dr. Alan Stern of the Space Science and Engineering Division at Southwest Research Institute? (SwRI?) shows Sedna could have formed far beyond the distance of Pluto.

“If this is actually what happened,” Stern points out, “it would indicate that our solar system’s planet factory operated across a much larger region than previously thought.” It would also indicate that the mysterious Kuiper Belt “edge” near 50 AU (one AU is the distance from the Earth to the Sun) is not an outer edge, but simply the inner edge of an annular trough, or gap, that is carved out of a much broader structure that has been called the “Kuiper disk.”

The new Sedna formation study used a planetary accretion code developed by Stern with funding from NASA’s Origins of Solar System’s Program in the late 1990s for studies of the formation of Kuiper Belt Objects. This software was used to explore the feasibility of building Sedna from boulder-sized and other small bodies at distances between 75 AU (Sedna’s closest solar approach distance) and 500 AU (Sedna’s average distance from the Sun). Stern’s Sedna formation simulations assumed that Sedna’s original orbit, while distant from the Sun, was circular. Astronomers agree that Sedna could not have formed in its present, eccentric orbit because such an orbit allows only violent collisions that prevent the growth of small bodies. Stern’s simulations further assumed that the solar nebula — the disk of material out of which the planets formed — was much more extended than most previous simulations had assumed.

“The Sedna formation simulations assumed that the primordial solar nebula was a disk about the size of those observed around many nearby middle-aged stars — like the well-known example of the 1,500-AU-wide disk around the star Beta Pictoris,” Stern says.

“The model calculations found that objects as large, or even larger, than Sedna could easily form in circular orbits at distances of 75 to 500 AU, and that their formation time could have been fairly short — just a few percent the age of the solar system,” Stern continues. “If Sedna did form this far out, it is likely to be accompanied by a cohort of other large planetoids in this very distant region of the solar system. One telltale sign that these objects were formed where they are, rather than in another location, would be if a good fraction of them are on near circular orbits.”

Original Source: SWRI News Release

Missing Link Between the Big Bang and Modern Galaxies

A team of UK and Australian astronomers today announced that it has found the missing link that directly relates modern galaxies like our own Milky Way to the Big Bang that created our Universe 14 thousand million years ago. The findings are the result of a 10-year effort to map the distribution in space of 220,000 galaxies by the 2dFGRS (2-degree Field Galaxy Redshift Survey), a consortium of astronomers, using the 3.8-m Anglo-Australian Telescope (AAT). This missing link was revealed in the existence of subtle features in the galaxy distribution in the survey. Analysis of these features has also enabled the team to weigh the universe with unprecedented accuracy.

The 2dFGRS has measured in great detail the distribution of galaxies, called the large-scale structure of the Universe. These patterns range in size from 100 million to 1 billion light years. The properties of the large-scale structure are set by physical processes that operated when the universe was very young indeed.

Dr Shaun Cole of the University of Durham, who led the research, explains: “At the moment of birth, the universe contained tiny irregularities, thought to have resulted from “quantum” or subatomic processes. These irregularities have been amplified by gravity ever since and eventually gave rise to the galaxies we see today.”

Theorists in the 1960s suggested that the primordial seeds of galaxies should be seen as ripples in the Cosmic Microwave Background (CMB) radiation emitted in the heat left over from the Big Bang, when the Universe was a mere 350,000 years old. Ripples were subsequently seen in 1992 by NASA’s COBE satellite, but until now, no firm connection could be demonstrated with galaxy formation. 2dFGRS has found that a pattern seen in these ripples has propagated to the modern Universe and can be detected in galaxies today.

The patterns in the CMB contain prominent spots about one degree across, produced by sound waves propagating in the unimaginably hot plasma of the Big Bang. These features are known as “acoustic peaks” or “baryon wiggles”. Theorists had speculated that the sound waves might have also left an imprint in the dominant component of the universe – the exotic “dark matter”, which itself drives the formation of galaxies. Physicists and astronomers set about trying to identify this imprint in maps of our own galactic neighbourhood.

After years of painstaking work taking measurements of galaxies at the Anglo-Australian Telescope and modelling their properties with sophisticated mathematical and computational techniques, the 2dFGRS team have identified the imprint of sound waves in the Big Bang. It appears as delicate features in the “power spectrum”, the statistic used by astronomers to quantify the patterns seen in maps of the galaxy distribution. These features are consistent with those seen in the microwave background – which means we understand the life history of the gas from which Galaxies formed.

The baryon features contain information about the contents of the universe, in particular about the amount of ordinary matter (known as baryons), the kind of stuff which has condensed into stars and planets and of which we ourselves are made.

Professor Carlos Frenk, Director of the Institute for Computational Cosmology of the University of Durham said: “These baryon features are the genetic fingerprint of our universe. They establish a direct evolutionary link to the Big Bang. Finding them is a milestone in our understanding of how the cosmos was formed.”

Professor John Peacock from Edinburgh University, UK team leader of 2dFGRS collaboration said: “I don’t think anyone would have expected simple cosmological theories to work so well. We’re very lucky to be around to see this picture of the universe established.”

The 2dFGRS has shown that baryons are a small component of our universe, making up a mere 18% of the total mass, with the remaining 82% appearing as dark matter. For the first time, the 2dFGRS team have broken the 10 percent accuracy barrier in measuring the total mass of the Universe.

As if this picture weren’t strange enough, the 2dFGRS also showed that all the mass in the universe (both luminous and dark) is outweighed 4:1 by an even more exotic component called “vacuum energy” or “dark energy”. This has antigravity properties, causing the expansion of the universe to speed up. This conclusion arises when combining 2dFGRS results with data on the microwave background radiation, which is left over from the time when the baryon features were created. The origin and identity of the dark energy remains one of the deepest mysteries of modern science.

Our knowledge of the microwave background improved hugely in 2003 with data from NASA’s WMAP satellite. The WMAP team combined their information with an earlier analysis of part of the 2dFGRS to conclude that we indeed live in a dark energy-dominated universe. This was dubbed “the breakthrough of the year” in 2003 by Science magazine. Now, the discovery of the cosmic missing link by the 2dFGRS team, almost exactly a year later, crowns the achievements of a decade of painstaking work.

In an interesting twist, clues to the identity of the dark energy could be gleaned by finding baryon features in the evolving galaxy distribution halfway between now and the Big Bang. UK astronomers and their collaborators across the world are now planning large galaxy surveys of very distant galaxies with this aim in mind.

Independent confirmation of the presence of baryon features in the large-scale structure comes from the US-led Sloan Digital Sky Survey. They use a complementary method that does not involve the power spectrum, and study a rare subset of galaxies over a larger volume than the 2dFGRS. Nevertheless, the conclusions are consistent, which is very satisfying.

Professor Michael Strauss from Princeton University, Spokesman for the SDSS collaboration said: “This is wonderful science. The two groups have now independently seen direct evidence for the growth of structure by gravitational instability from the initial fluctuations seen in the cosmic microwave background.”

Original Source: PPARC News Release

Three Largest Stars Discovered

Image credit: Hubble
Astronomers are announcing today the identification of three red supergiants that have the largest diameters of any normal stars known, more than a billion miles across. The report is being presented by Ms. Emily Levesque, an undergraduate junior at MIT, who has been working with an international team of astronomers, including Philip Massey (Lowell Observatory, in Flagstaff, Arizona), Knut Olsen (Cerro Tololo Inter-American Observatory, in Chile), Bertrand Plez and Eric Josselin (Universite de Montpellier II, in France), and Andre Maeder and Georges Meynet (Geneva Observatory, in Switzerland). Nat White of Lowell Observatory also participated in the study. The findings are being presented today at the American Astronomical Society meeting in San Diego, California. The group studied a sample of 74 red supergiant stars in the Milky Way. This research is significant in finally reconciling theory and observation for these stars. Red supergiants, massive stars nearing the ends of their lifetimes, are extremely cool and luminous ? and very large.

The three biggest stars are KW Sagitarii (distance 9,800 light-years), V354 Cephei (distance 9,000 light-years), and KY Cygni (distance 5,200 light-years), all with radii about 1500 times that of the Sun, or about 7 astronomical units (AU). For comparison, the well-known red supergiant star Betelgeuse in the constellation Orion is known from other work to have a radius about 650 times that of the Sun, or about 3 AU. If one of these stars were placed in the sun’s location, its outer layers would extend to midway between the orbits of Jupiter (5.2 AU) and Saturn (9.5 AU) [see figure].

The previous record holder, Herschel’s “Garnet Star” (also known as “mu Cephei”) comes in a close fourth in size in the study. The only other star for which a very large size has been claimed is the binary star system VV Cephei, which consists of a red supergiant and a hot companion orbiting within a common gaseous envelope, in which the gravitational forces of the companion have distended the surface of the supergiant and the meaning of the size of the star is therefore fuzzy. None of the stars in the new study are believed to be binaries, and thus their properties tell us about the extreme sizes that normal stars reach.

The study used the National Science Foundation’s 2.1-meter (84-inch) telescope at Kitt Peak National Observatory, located outside of Tucson, Arizona, and the 1.5-m (60-inch) telescope at Cerro Tololo Inter-American Observatory, located outside of La Serena, Chile, in the foothills of the Andes. The new observations were combined with state-of-the-art computer models that contain improved data on the molecules that are found in the outer layers of these cool stars. The analysis yielded the most accurate temperatures yet found for this type of object. The temperatures of the coolest red supergiants are about 3450 Kelvins, or about 10 percent warmer than previously thought. Combined with modern estimates of the distances of these stars, the group was able to determine the stellar sizes as well.

“The significance of this study is that for the first time in many decades there is good agreement between the theory of how large and cool these stars should be, and how large and cool we actually observe them to be,” explained Dr. Philip Massey, Astronomer at Lowell Observatory, the project’s leader. “For the past two decades there has been a significant disagreement. The problem in this case turned out NOT to be the theory, but the ‘observations’ ? the conversion between the observed qualities (brightness and spectral type) and the deduced properties (temperature and luminosity and/or size) needed improvement.” The team’s new analysis provides a better means of converting between these properties.

“These stars are not the most massive known,” noted Levesque. “They are only 25 times the mass of the sun, while the most massive stars may have as much material as 150 suns. Nor are they the most luminous, as they are only about 300,000 times the luminosity of the sun, not the factor of 5 million or so attributed to the most luminous stars. They aren’t even the coldest stars known ? brown dwarfs have such low temperatures that they can’t even fuse hydrogen. But the combination of modestly high luminosities and relatively low temperatures DOES mean that they are the biggest stars known, in terms of their stellar diameters.”

The study has been submitted to the Astrophysical Journal for review and publication. Support was provided by a grant to Lowell Observatory by the National Science Foundation, which also provided support for Ms. Levesque’s participation in the project through the Research Experiences for Undergraduates program at Northern Arizona University.

Original Source: Lowell Observatory

Seeing Into the Heart of the Milky Way

The center of our galaxy is hidden behind a “brick wall” of obscuring dust so thick that not even the Hubble Space Telescope can penetrate it. Astronomers Silas Laycock and Josh Grindlay (Harvard-Smithsonian Center for Astrophysics) and colleagues have lifted that veil to reveal a beautiful vista swarming with stars. Moreover, their hunt for specific stars associated with X-ray-emitting sources has ruled out one of two options for the nature of these X-ray sources: most apparently are not associated with massive stars, which would have shown up as bright counterparts in their deep infrared images. This points to the X-ray sources being white dwarfs, not black holes or neutron stars, accreting matter from low-mass binary companion stars.

Their study is being presented today at a press conference at the 205th meeting of the American Astronomical Society in San Diego, Calif.

To peer into the galactic center, Laycock and Grindlay used the unique capabilities of the 6.5-meter-diameter Magellan Telescope in Chile. By gathering infrared light that more easily penetrates dust, the astronomers were able to detect thousands of stars that otherwise would have remained hidden. Their goal was to identify stars that orbit, and feed, X-ray-emitting white dwarfs, neutron stars or black holes – any of which could yield the faint X-ray sources discovered originally with NASA’s Chandra X-ray Observatory.

Chandra previously detected more than 2000 X-ray sources in the central 75 light-years of our galaxy. About four-fifths of the sources emitted mostly hard (high-energy) X-rays. The precise nature of those hard X-ray sources remained a mystery. Two possibilities were suggested by astronomers: 1) high-mass X-ray binary systems, containing a neutron star or black hole with a massive stellar companion; or, 2) cataclysmic variables, containing a highly magnetized white dwarf with a low-mass stellar companion. Determining the nature of the sources can teach us about the star formation history and dynamical evolution of the region near the galactic center.

“If we found that most of the hard X-ray sources were high-mass X-ray binaries, it would tell us that there had been a lot of recent star formation because massive stars don’t live long,” says Laycock. “Instead, we found that most of the X-ray sources are likely to be older systems associated with low-mass stars.”

That conclusion comes from a null result: that is, most of the counterparts to the X-ray sources must be fainter than the brightness expected if the X-ray sources had massive companions. Since massive stars are both rare and bright, an association with the X-ray sources would have been easy to spot. Smaller stars are more common and fainter, making it difficult to match them to a specific X-ray source. Analysis of the infrared images found only a chance number of matches between stars and the locations of X-ray sources. Many of those matches likely were due to the crowded field of view.

“The fact that we found no significant excess of bright infrared counterparts means that the galactic center Chandra sources are probably low-mass binaries. Since by far the most common low-mass binaries with X-ray luminosities, spectra, and variability similar to the galactic center Chandra sources are accreting magnetic white dwarfs, we conclude these are the most likely identification,” says Grindlay.

If the X-ray sources near the galactic center are accreting white dwarfs, the large numbers of compact low-mass binaries required could suggest that they formed in the very dense star cluster around the galactic center or that they have been “deposited” there by the destruction of globular clusters. Deeper infrared observations and spectra of the sources are needed to make actual identifications and constrain the masses of the accreting compact objects.

Headquartered in Cambridge, Mass., the Harvard-Smithsonian Center for Astrophysics (CfA) is a joint collaboration between the Smithsonian Astrophysical Observatory and the Harvard College Observatory. CfA scientists, organized into six research divisions, study the origin, evolution and ultimate fate of the universe.

Original Source: CfA News Release

10 Things to Do in 2005

Image credit: NASA
1.Begin the New Year by observing Saturn. Saturn will be at opposition (i.e. opposite the sun in the sky) on January 13th at 08:00 UTC. Saturn is in the constellation Gemini the Twins, about 6 degrees south east of the star Pollux.

2.Begin learning the names of 20 constellations. The inclination is to start with the brightest, most obvious ones. But sometimes it can be a fun challenge to find a less conspicuous one. Obviously this is a project that could last throughout the entire year. It is also a good chance to learn which constellations are visible during each season.

3.Learn the names of 20 bright stars. While many of us know the names of the constellations, the names of the stars are somewhat less well known. Knowing the star names is a good way to find and learn the constellations as well. Sometimes a constellation will have only one or two bright stars. These can act as guide posts to finding the entire constellation. As with learning the constellations, this is a project that can last all year.

4.Count the stars in the Pleiades, also known as the Seven Sisters. This little star cluster is west of the constellation Taurus the Bull. From a dark location you may see 5 or 6 stars. Then look at them with a pair of binoculars, what do you see?

5.Observe the moon for a month. Notice how much of its surface is illuminated from night to night. Kids can use a calendar and draw what shape the moon is each night (or even day!) Use binoculars or a telescope to observe the lunar features especially near the line that divides day from night (called the terminator).

6.In June look for Mercury and Venus in the evening sky between 0:300 and 04:00 UTC. The pair will be only 0.1 degrees apart. At that distance you will probably need binoculars to tell them apart. Venus will be the brightest object in the sky while Mercury will be much fainter. Saturn will be the bright object to the North West.

7.Observe a meteor shower. The famed Perseids is visible from July 17th to August 24th with the peak occurring before dawn on August 12th . Meteor showers get their names from the constellation they appear to radiate from, in this case Perseus the Hero. The best way to observe meteors is lying back on the ground or in a lawn chair. Kids can have fun counting how many they see in an hour.

8.On September 1st, about 03:00 UTC. Jupiter and Venus will be about 1 degree apart in the west just after sunset. No need to use binoculars to find this pair, but it might be fun to see them both through a telescope. Don’t forget to look for Jupiter’s 4 large moons: Ganymede, Callisto, Europa and Io.

9. Hunt for double stars. Many of the stars that we see in the sky have one or more companion stars. In many cases they are not visible to the naked eye. Here is a good opportunity to hone your binocular or telescope skills. Begin with the star Mizar in the constellation Ursa Major (the Big Dipper); it is the middle star in the Dipper’s handle.

10.Share the sky with your children or other young people. Kids love stories, and most never tire of hearing the same ones over and over again. Learn the myths and legends of your favorite constellations and tell them to your kids. Who knows, maybe your love for the sky will spark an interest in them that will last a lifetime.

This list should give even the most timid of beginners a starting point for their celestial quest. And don’t forget, there are lots of other enthusiasts out there, don’t be shy in contacting them and asking questions and sharing your experiences. Enjoy 2005, and clear skies to you all.

Written by Rod Kennedy.

Map of Dark Matter Developed

Hubble Space Telescope data, analyzed by a Yale astronomer using gravitational lensing techniques, has generated a spatial map demonstrating the clumped substructure of dark matter inside clusters of galaxies.

Clusters of galaxies (about a million, million times the mass of our sun), are typically made up of hundreds of galaxies bound together by gravity. About 90 percent of their mass is darkmatter. The rest is ordinary atoms in the form of hot gas and stars.

Although little is known about it, cold dark matter is thought to have structure at all magnitudes. Theoretical models of the clumping properties were derived from detailed, high resolution simulations of the growth of structure in the Universe. Although previous evidence supported the ?concordance model? of a Universe mostly composed of cold, dark matter, the predicted substructure had never been detected.

In this study, Yale assistant professor of astronomy and physics Priyamvada Natarajan and her colleagues demonstrate that, at least in the mass range of typical galaxies in clusters, there is an excellent agreement between the observations and theoretical predictions of the concordance model.

Using gravitational lensing made it possible for the observers to visualize light from distant galaxies as it bent around mass in its way. This allowed the researchers to measure light deflections that indicated structural clumps in the dark matter.

?We used an innovative technique to pick up the effect of precisely the clumps which might otherwise be obscured by the presence of more massive structures,? said Natarajan. ?When we compared our results with theoretical expectations of the concordance model, we found extremely good agreement, suggesting that the model passes the substructure test for the mass range we are sensitive to with this technique.?

?We think the properties of these clumps hold a key to the nature of dark matter ? which is presently unknown,? said Natarajan. ?The question remains whether these predictions and observations agree for smaller mass clumps that are as yet undetected.?

Co-author on the study, funded by Yale University, is Volker Springel, MPA, Garching, Germany. Other collaborators include. Jean-Paul Kneib, LAM ? OAMP, Marseille, France, Ian Smail, University of Durham, U.K., and Richard Ellis of Caltech.

Original Source: Yale News Release