Electrons Surfing on a Solar Wind

Image credit: NASA

New research indicates that electrons may surf on magnetic waves driven by the solar wind, and get accelerated to the point they can cause some serious damage to spacecraft orbiting the Earth. The process is a result of the interaction between the Earth’s magnetic field and fluctuations in the density of the solar wind. As the density of the solar wind changes, it causes waves in the magnetic field to ripple back to the Earth. Electrons can be caught in these ripples and surf back to the Earth so fast they can damage delicate electronics in space.

“Killer” electrons capable of wreaking havoc on orbiting spacecraft may “surf” magnetic waves driven by the solar wind, according to a team of space scientists.

The team from Boston University and the National Oceanic and Atmospheric Administration (NOAA) combined observations from NASA and NOAA spacecraft to identify a phenomenon that explains how the solar wind makes waves in Earth’s magnetic field (magnetosphere). Ordinary electrons orbiting the Earth in the Van Allen radiation belts may boogyboard the waves, accelerating to near the speed of light, with energies 300-500 times greater than the electrons in a television screen.

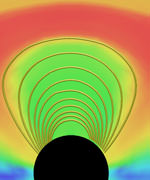
The solar wind is a stream of electrically charged particles blown constantly from the Sun. The magnetosphere is a cavity formed when the solar wind encounters the Earth’s magnetic field. When the solar wind density is high and comes up against the magnetosphere, the magnetosphere gets compressed. When the wind density is low, the magnetosphere expands. The researchers discovered that the solar wind contains periodic structures of high and low density, driving a periodic “breathing” action of the magnetosphere and the global generation of magnetic waves.

It’s known that if the frequency of these waves matches the frequency of the electrons in their motion in the Van Allen belt, the electrons can be accelerated, significantly boosting their energies. The process is similar to a boogyboarder catching a wave. Some electrons “ride the wave” and gain so much energy that they can then damage expensive spacecraft.

“If we can confirm this as a significant mechanism for making the waves that accelerate ‘killer’ electrons, then scientists using data from satellites like Wind could develop advance warning for spacecraft operators that their spacecraft may be in danger of excessive and damaging radiation exposure,” said Dr. Barbara Giles, project scientist for the Polar spacecraft at NASA’s Goddard Space Flight Center, Greenbelt, Md.

When electrons become this energetic, they can penetrate to the interior of spacecraft. Once inside electronic parts, they build up static electricity that can short circuit a critical part or put the spacecraft into a bad operating mode.

“What’s new and exciting about this research is that people had always looked for mechanisms internal to the magnetosphere for generating these waves,” said Dr. Larry Kepko, research associate at Boston University and lead author of two papers on this research, one published in the Journal of Geophysical Research in June 2003 and the other in Geophysical Research Letters in 2002. “But here we’ve found an external mechanism – the solar wind itself.”

NASA’s Polar and Wind satellites, along with NOAA’s Geostationary Operational Environmental Satellite (GOES), provided the key observations leading the team to this conclusion. Polar confirmed that the waves are not local, but global. The Wind satellite was the primary source for identifying the density structures in the solar wind that drive the magnetosphere. GOES provided data about the Earth’s magnetosphere as it increased and decreased in size.

“We already knew that the solar wind has density structures and that magnetic waves can accelerate electrons,” said Dr. Harlan Spence, associate professor of astronomy at Boston University and co-author of the two papers on this research. “What we didn’t know was that the solar wind structures can be periodic and drive magnetic waves. These new observations may provide a missing link between the two.”

The ultimate source of these newly discovered solar wind structures is still a mystery, but the team speculates that the Sun may play a direct role. “The solar wind density variations are partly controlled by the pattern of magnetic reconnection, the twisting and snapping of magnetic field lines, on the surface of the Sun,” says Dr. Kepko. “Reconnection occurring in a systematic, periodic manner may produce the observed periodic density structures in the solar wind. There is some evidence that this may be occurring, but further research is required to establish a definitive link.”

The Van Allen radiation belts were discovered in 1958 by Dr. James Van Allen and his team at the University of Iowa with Explorers 1 and 3, the first satellites successfully launched by the United States. They are belts of electrically charged particles trapped by the Earth’s magnetic field. Since the particles are electrically charged (mostly protons and electrons), they feel magnetic forces and are constrained to spiral around invisible lines of magnetic force that comprise the Earth’s magnetic field. There are actually two donut-shaped belts in the Van Allen system, one inside the other with the Earth in the “hole” of the inner belt. The inner belt, made up of high-speed protons, is located at altitudes between 430 and 7,500 miles (about 700 to 12,000 km) above the Earth. The outer belt is made of high-speed electrons and appears at altitudes between 15,500 and 25,000 miles (about 25,000 to 40,000 km) above Earth. Spacecraft operators try to avoid orbits in these regions, but sometimes these altitudes are best for a particular mission, or the spacecraft must pass through the belts during part of its orbit or to escape the Earth entirely.

NASA’s Polar and Wind satellites, together known as the “Global Geospace Science Program,” are dedicated to helping scientists understand how particles and energy from the Sun flow through, and interact with, the Earth’s space environment.

NOAA is dedicated to gathering data about the oceans, the atmosphere, space, and the Sun. Its GOES satellite system is the basic element for U.S. weather monitoring and forecasting. Dr. Howard Singer from NOAA is a third co-author on the 2002 paper about this research.

Original Source: NASA News Release

Solar Flares Shuffle Antimatter Around

Image credit: NASA

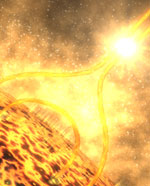
Astronomers believe that the Sun creates and destroys antimatter as part of its natural process of fusion reaction, but new observations from NASA’s Reuven Ramaty High Energy Solar Spectroscopic Imager (RHESSI) spacecraft has brought new insights into the process. The antimatter is formed in solar flares when fast-moving particles accelerated by the flare are smashed into slower-moving particles in the Sun’s atmosphere (enough antimatter is created in just one flare to power the United States for two years). Surprisingly, the antimatter isn’t destroyed right away; instead, it’s carried by the flare to another region of the Sun before being destroyed.

The best look yet at how a solar explosion becomes an antimatter factory gave unexpected insights into how the tremendous explosions work. The observation may upset theories about how the explosions, called solar flares, create and destroy antimatter. It also gave surprising details about how they blast subatomic particles to almost the speed of light.

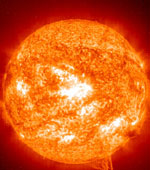
Solar flares are among the most powerful explosions in the solar system; the largest can release as much energy as a billion one-megaton nuclear bombs. A team of researchers used NASA’s Reuven Ramaty High Energy Solar Spectroscopic Imager (RHESSI) spacecraft to take pictures of a solar flare on July 23, 2002, using the flare’s high-energy X-rays and gamma radiation.

“We are taking pictures of flares in an entirely new color, one invisible to the human eye, so we expect surprises, and RHESSI gave us a couple already,” said Dr. Robert Lin, a faculty member in the Dept. of Physics at the University of California, Berkeley, who is the Principal Investigator for RHESSI.

Gamma-rays and X-rays are the most energetic forms of light, with a particle of gamma ray light at the top of the scale carrying millions to billions of times more energy than a particle of visible light. The results are part of a series of papers about the RHESSI observation to be published in Astrophysical Journal Letters October 1.

Antimatter annihilates normal matter in a burst of energy, inspiring science fiction writers to use it as a supremely powerful source to propel starships. Current technology only creates minute quantities, usually in miles-long machines employed to smash atoms together, but scientists discovered the July 2002 flare created a half-kilo (about one pound) of antimatter, enough to power the entire United States for two days. According to the RHESSI images and data, this antimatter was not destroyed where expected.

Antimatter is often called the “mirror image” of ordinary matter, because for every type of ordinary matter particle, an antimatter particle can be created that is identical except for an opposite electric charge or other fundamental properties.

Antimatter is rare in the present-day universe. However, it can be created in high-speed collisions between particles of ordinary matter, when some of the energy from the collision goes into the production of antimatter. Antimatter is created in flares when the fast-moving particles accelerated during the flare collide with slower particles in the Sun’s atmosphere.

According to flare theory, these collisions happen in relatively dense regions of the solar atmosphere, because many collisions are required to produce significant amounts of antimatter. Scientists expected that the antimatter would be annihilated near the same places, since there are so many particles of ordinary matter to run into. “Antimatter shouldn’t get far,” said Dr. Gerald Share of the Naval Research Laboratory, Washington, D.C., lead author of a paper on RHESSI’s observations of the antimatter destruction in the July 23 flare.

However, in a cosmic version of the shell game, it appears that this flare might have shuffled antimatter around, producing it in one location and destroying it in another. RHESSI allowed the most detailed analysis to date of the gamma rays emitted when antimatter annihilates ordinary matter in the solar atmosphere. The analysis indicates that the flare’s antimatter might have been destroyed in regions where high temperatures made the particle density 1,000 times lower than where the antimatter should have been created.

Alternatively, perhaps there is no “shell game” at all, and flares are able to create significant amounts of antimatter in less dense regions, or flares somehow may be able to maintain dense regions despite high temperatures, or the antimatter was created “on the run” at high speeds, and the high-speed creation gave the appearance of a high-temperature region, according to the team.

Solar flares are also capable of blasting electrically charged particles in the Sun’s atmosphere (electrons and ions) to almost the speed of light (about 186,000 miles per second or 300,000 km/sec.). The new RHESSI observation revealed that solar flares somehow sort particles, either by their masses or their electric charge, as they propel them to ultra-high speeds.

“This discovery is a revolution in our understanding of solar flares,” said Dr. Gordon Hurford of the University of California, Berkeley, who is lead author of one of fifteen papers on this research.

The solar atmosphere is a gas of electrically charged particles (electrons and ions). Since these particles feel magnetic forces, they are constrained to flow along magnetic fields that permeate the Sun’s atmosphere. It is believed that solar flares happen when magnetic fields in the Sun’s atmosphere become twisted and suddenly snap to a new configuration, like a rubber band breaking when overstretched. This is called magnetic reconnection.

Previously, scientists believed that the particles in the solar atmosphere were accelerated when they were dragged along with the magnetic field as it snapped to a new shape, like a stone in a slingshot. However, if it were this simple, all the particles would be shot in the same direction. The new observations from RHESSI show that this is not so; heavier particles (ions) end up in a different location than lighter particles (electrons).

“The result is as surprising as gold miners blasting a cliff face and discovering that the explosion threw all the dirt in one direction and all the gold in another direction,” said Dr. Craig DeForest, a solar researcher at the South West Research Inst. Boulder, Colo.

The means by which flares sort particles by mass is unknown; there are many possible mechanisms, according to the team. Alternatively, the particles could be sorted by their electric charge, since ions are positively charged and electrons negatively charged. If this is so, an electric field would have to be generated in the flare, since particles move in different directions in an electric field according to their charge. In either case, magnetic reconnection still provides the energy, but the acceleration process is more complex.

The clue that tipped scientists off to this surprising behavior was the RHESSI observation that gamma rays from the July 23 flare were not emitted from the same locations that emitted the X-rays, as theory predicts. According to solar flare theories, electrons and ions are accelerated to high-speeds during the flare and race down arch-shaped magnetic structures. The electrons slam into the denser solar atmosphere near the two footpoints of the arches, emitting X-rays when they encounter electrically charged protons there that deflect them. Gamma rays should be emitted from the same locations when the high-speed ions also crash into these regions.

While RHESSI observed two X-ray emitting regions at the footpoints, as expected, it only detected a diffuse gamma-ray glow centered at a different location some 15,000 kilometers (approximately 9,300 miles) south of the X-ray sites.

“Each new discovery shows we are only just beginning to understand what happens in these gigantic explosions,” said Dr. Brian Dennis of NASA’s Goddard Space Flight Center, Greenbelt, Md., who is the Mission Scientist for RHESSI. RHESSI was launched February 5, 2002, with the University of California, Berkeley, responsible for most aspects of the mission, and NASA Goddard responsible for program management and technical oversight.

Source: NASA News Release

Satellites Measure Rising Seas

Image credit: NASA

The spectre of global warming and rising ocean levels have been a concern for many years, but NASA has some real numbers to help measure the situation. According to the Topex/Poseidon and Jason satellites, sea levels have been rising an average of 2.8 millimetres a year since observations began in 1992. Whether rising sea levels are caused by human impact or a natural cycle still isn’t clear, but the impact is already being felt in coastal communities around the world with water inundating low-level areas and an increased rate of beach erosion.

Stack two dimes on top of each other. Their height is a tiny fraction less than global sea level is rising each year. The increase looks small, but the consequences are potentially huge. Rising sea level threatens to inundate low-lying regions, such as the Chesapeake, and dramatically increase coastal and beach erosion around the world.

While tide gauges have been used to determine sea level for hundreds of years, the most complete global measurements now come from space. “Tide gauges can’t detect an increase in the rate of sea level rise soon enough to be useful for detecting climate change,” says Bruce Douglas, a senior researcher at Florida International University, Miami, Fla. “Tide gauges can’t measure everywhere. They’re on practically every rock in the ocean, the problem is there just aren’t enough rocks.”

In contrast, the Topex/Poseidon satellite observes the entire ocean and has been making precise measurements of global sea level since it was launched in 1992. Its successor, Jason, is now continuing the same ocean observations.

“Right now Topex/Poseidon has been seeing an average yearly increase of 2.8 millimeters (0.11 inches) in global sea level,” says University of Colorado engineering professor Dr. Steve Nerem, a member of the Topex/Poseidon and Jason 1 science team.

Global sea level is the average of all local rates. If global sea level is rising by 2.8 millimeters a year, the local rate in some areas is much higher, as much as 5 millimeters (0.2 inches) or more over long periods. In some areas it is less.

One of the big questions facing scientists and the public, especially the more than two billion of us who live within 100 kilometers (62 miles) of a coast, about the rise in sea level is “why?”

“We don’t know yet exactly what is causing it,” says Nerem. “The jury is still out.” The current rise in global sea level could be part of some natural, yet unidentified, decades-long climate pattern, Nerem says. “During 1997-1998 El Ni?o, the global average went up 15 millimeters (0.6 inches) as a result of increased ocean temperatures and then went down again.”

However, sea level is a barometer of climate change, and the rise could be a result of a warming Earth. “While the rate of increase we see is consistent with climate change models, we can’t say for sure if that is the cause,” Nerem says. “We’re just starting to ask those questions.”

“It looks like sea level rise as we now observe it began in the middle of the 19th century,” says Douglas, an expert on the history of sea level rise and its consequences. “We have a preponderance of evidence that the current rate is considerably faster than for the previous several thousand years, although there is still some disagreement among scientists about this.”

The two major factors that determine sea level are temperature and ocean mass. Warm water expands and raises sea level. Water added to the ocean from melting glaciers or ice sheets also causes sea level to go up. Figuring out just how much of the current sea level rise is due to each of these factors is difficult.

“Our best guess is that thermal expansion accounts for about 0.5 millimeters (.02 inches) per year rise in sea level or five centimeters (2 inches) per 100 years,” says Douglas. “If global sea level is rising at more than 20 centimeters (8 inches) per hundred years, then where is the water coming from? Mountain glaciers could account for three or four centimeters (1.2 to 1.6 inches), so that leaves Earth’s great ice sheets in Greenland and Antarctica. Are they losing or gaining? That’s a controversial question.”

Scientists expect to have some answers soon. NASA’s new Grace mission will be able to calculate the ocean’s mass, helping pinpoint whether rising sea level is a result of more water in the ocean or expansion due to warming waters. A new generation of tide gauges and monitoring devices provide details on sea level changes in specific locations.

Meanwhile, Jason continues the global sea level measurements begun by Topex/Poseidon more than 11 years ago, building up a record of sea level change that may help explain the past and predict the future. Ironically, Topex/Poseidon was never expected to be able to make precise enough measurements to monitor something as small as millimeter changes in global sea level. “It’s a 100 times more accurate than we expected it to be before launch,” says Douglas. Jason 1 may improve on these measurements even more.

Original Source: NASA/JPL News Release

New Information on the Early Universe

Image credit: ESO

An international team of astronomers have used the European Southern Observatory’s Very Large Telescope (VLT) to look deep into space and see galaxies located 12.6 billion light-years away – these galaxies are being seen when the Universe was only 10% of its current age. Few galaxies this old have been found, and this new collection has helped the astronomers conclude that they are a part of a cosmic Dark Age, when luminous galaxies were rarer – there were many more only 500 million years later.

Using the ESO Very Large Telescope (VLT), two astronomers from Germany and the UK [2] have discovered some of the most distant galaxies ever seen. They are located about 12,600 million light-years away.

It has taken the light now recorded by the VLT about nine-tenths of the age of the Universe to traverse this huge distance. We therefore observe those galaxies as they were at a time when the Universe was very young, less than about 10% of its present age. At this time, the Universe was emerging from a long period known as the “Dark Ages”, entering the luminous “Cosmic Renaissance” epoch.

Unlike previous studies which resulted in the discovery of a few, widely dispersed galaxies at this early epoch, the present study found at least six remote citizens within a small sky area, less than five per cent the size of the full moon! This allowed understanding the evolution of these galaxies and how they affect the state of the Universe in its youth.

In particular, the astronomers conclude on the basis of their unique data that there were considerably fewer luminous galaxies in the Universe at this early stage than 500 million years later.

There must therefore be many less luminous galaxies in the region of space that they studied, too faint to be detected in this study. It must be those still unidentified galaxies that emit the majority of the energetic photons needed to ionise the hydrogen in the Universe at that particularly epoch.

From the Big Bang to the Cosmic Renaissance
Nowadays, the Universe is pervaded by energetic ultraviolet radiation, produced by quasars and hot stars. The short-wavelength photons liberate electrons from the hydrogen atoms that make up the diffuse intergalactic medium and the latter is therefore almost completely ionised. There was, however, an early epoch in the history of the Universe when this was not so.

The Universe emanated from a hot and extremely dense initial state, the so-called Big Bang. Astronomers now believe that it took place about 13,700 million years ago.

During the first few minutes, enormous quantities of protons, neutrons and electrons were produced. The Universe was so hot that protons and electrons were floating freely: the Universe was fully ionised.

After some 100,000 years, the Universe had cooled down to a few thousand degrees and the nuclei and electrons now combined to form atoms. Cosmologists refer to this moment as the “recombination epoch”. The microwave background radiation we now observe from all directions depicts the state of great uniformity in the Universe at that distant epoch.

However, this was also the time when the Universe plunged into darkness. On one side, the relic radiation from the primordial fireball had been stretched by the cosmic expansion towards longer wavelengths and was therefore no more able to ionise the hydrogen. On the contrary, it was trapped by the hydrogen atoms just formed. On the other side, no stars nor quasars had yet been formed which could illuminate the vast space. This sombre era is therefore quite reasonably dubbed the “Dark Ages”. Observations have not yet been able to penetrate into this remote age – our knowledge is still rudimentary and is all based on theoretical calculations.

A few hundred million years later, or at least so astronomers believe, some very first massive objects had formed out of the huge clouds of gas that had moved together. The first generation of stars and, somewhat later, the first galaxies and quasars, produced intensive ultraviolet radiation. That radiation could not travel very far, however, as it would be immediately absorbed by the hydrogen atoms which were again ionised in this process.

The intergalactic gas thus again became ionised in steadily growing spheres around the ionising sources. At some moment, these spheres had become so big that they overlapped completely: the fog over the Universe had lifted !

This was the end of the Dark Ages and, with a term again taken over from human history, is sometimes referred as the “Cosmic Renaissance”. Describing the most significant feature of this period, astronomers also call it the “epoch of reionisation”.

Finding the Most Distant Galaxies with the VLT
To cast some light on the state of the Universe at the end of the Dark Ages, it is necessary to discover and study extremely distant (i.e. high-redshift [2]) galaxies. Various observational methods may be used – for instance, distant galaxies have been found by means of narrow-band imaging (e.g., ESO PR 12/03), by use of images that have been gravitationally enhanced by massive clusters, and also serendipitously.

Matthew Lehnert from the MPE in Garching, Germany, and Malcolm Bremer from the University of Bristol, UK, used a special technique that takes advantage of the change of the observed colours of a distant galaxy that is caused by absorption in the intervening intergalactic medium. Galaxies at redshifts of 4.8 to 5.8 [2] can be found by looking for galaxies which appear comparatively bright in red optical light and which are faint or undetected in the green light. Such “breaks” in the light distribution of individual galaxies provide strong evidence that the galaxy might be located at high redshift and that its light started on its long journey towards us, only some 1000 million years after the Big Bang.

For this, they first used the FORS2 multi-mode instrument on the 8.2-m VLT YEPUN telescope to take extremely “deep” pictures through three optical filters (green, red and very-red) of a small area of sky (40 square arcmin, or approx. 5 percent the size of the full moon). These images revealed about 20 galaxies with large breaks between the green and red filters, suggesting that they were located at high redshift. Spectra of these galaxies were then obtained with the same instrument, in order to measure their true redshifts.

“The key to the success of these observations was the use of the great new red-enhanced detector available on FORS2”, says Malcolm Bremer.

The spectra indicated that six galaxies are located at distances corresponding to redshifts between 4.8 and 5.8; other galaxies were closer. Surprisingly, and to the delight of the astronomers, one emission line was seen in another faint galaxy that was observed by chance (it happened to be located in one of the FORS2 slitlets) that may possibly be located even further away, at a redshift of 6.6. If this would be confirmed by subsequent more detailed observations, that galaxy would be a contender for the gold medal as the most distant one known!

The Earliest Known Galaxies
The spectra revealed that these galaxies are actively forming stars and are probably no older than 100 million years, perhaps even younger. However, their numbers and observed brightness suggest that luminous galaxies at these redshifts are fewer and less luminous than similarly selected galaxies nearer to us.

“Our findings show that the combined ultraviolet light from the discovered galaxies is insufficient to fully ionise the surrounding gas”, explains Malcom Bremer. “This leads us to the conclusion that there must be many more smaller and less luminous galaxies in the region of space that we studied, too faint to be detected in this way. It must be these still unseen galaxies that emit the majority of the energetic photons necessary to ionise the hydrogen in the Universe.”

“The next step will be to use the VLT to find more and fainter galaxies at even higher redshifts”, adds Matthew Lehnert. “With a larger sample of such distant objects, we can then obtain insight into their nature and the variation of their density in the sky.”

A British Premiere
The observations presented here are among the first major discoveries by British scientists since the UK became a member of ESO in July 2002. Richard Wade from the Particle Physics and Astronomy Research Council (PPARC), which funds the UK subscription to ESO, is very pleased: “In joining the European Southern Observatory, UK astronomers have been granted access to world-leading facilities, such as the VLT. These exciting new results, of which I am sure there will be many more to come, illustrate how UK astronomers are contributing with cutting-edge discoveries.”

More information
The results described in this Press Release are about to appear in the research journal Astrophysical Journal (” Luminous Lyman Break Galaxies at z>5 and the Source of Reionization” by M. D. Lehnert and M. Bremer). It is available electronically as astro-ph/0212431.

Notes
[1]: This is a coordinated ESO/PPARC Press Release. The PPARC version of the release can be found here.

[2]: This work was carried out by Malcolm Bremer (University of Bristol, The United Kingdom) and Matthew Lehnert (Max-Planck-Institut f?r Extraterrestrische Physik, Garching, Germany).

[3]: The measured redshifts of the galaxies in the Bremer Deep Field are z = 4.8-5.8, with one unexpected (and surprising) redshift of 6.6. In astronomy, the redshift denotes the fraction by which the lines in the spectrum of an object are shifted towards longer wavelengths. The observed redshift of a remote galaxy provides an estimate of its distance. The distances indicated in the present text are based on an age of the Universe of 13.7 billion years. At the indicated redshift, the Lyman-alpha line of atomic hydrogen (rest wavelength 121.6 nm) is observed at 680 to 920 nm, i.e. in the red spectral region.

Original Source: ESO News Release

Sun’s Flip is Letting the Dust In

Image credit: ESA

The European Space Agency’s Ulysses spacecraft has confirmed that the Sun’s 11-year cycle that causes it to switch magnetic poles allows interstellar dust to enter our Solar System in greater quantities. The Sun normally puts a protective magnetic bubble around the solar system to push dust around us, but during this pole-switch, the bubble disappears for a little while. Astronomers believe this will increase the amount of material that falls on the Earth to 40,000 tonnes of dust a day – it won’t really cause a problem; however, we may be able to see some more faint falling stars.

Astronomers once thought they understood how the Sun worked. A large ball of gas, generating energy by nuclear fusion, it also created a magnetic field enclosing Earth and the other planets in a gigantic magnetic bubble.

This bubble protected us from the dusty cosmic debris that shoots through space beyond the Solar System. Thanks to ESA’s solar polewatcher Ulysses, that picture is changing…

11-year switch
Ulysses has revealed a complexity to the Sun’s magnetic field that astronomers had never imagined. The Sun’s magnetic field consists of a north pole, where the field flows out of the Sun and a south pole, where the field reenters. Usually, these line up, more-or-less, with the rotation axis of the Sun. Every 11 years the Sun reaches a peak of activity that triggers the magnetic poles to exchange places. The reversal was thought to be a rapid process but, thanks to Ulysses, astronomers now know it is gradual and could take as much as seven years to complete.

During this slow-motion reversal, the line connecting the poles – known as the magnetic axis – comes close to the Sun’s equator and is swept through space like the beam of a light house. Eventually it passes through this region and lines up with the opposite pole.

Imagine if this happened on Earth! Compasses would become useless, given that they rely on the fact that Earth’s magnetic axis is roughly coincident with its rotation axis, which passes through the North and South geographic Pole. Although it seems surprising, magnetic pole reversals have happened on Earth also. The last time was about 740 000 years ago. After studying magnetic rocks, scientists conclude that field reversals on Earth take place once every 5000 to 50 million years (but are impossible to predict). Reversals on the Sun, however, are almost as regular as clockwork – every 11 years, with its magnetic axis changing position for most of that time.

More shooting stars
Earth’s magnetic field is more stable because it arises in the metal-dominated regions in the deep interior of the planet. The Sun’s field, however, comes from a high-temperature, electrified gas called plasma so it is a much more volatile thing. Loops of the magnetic field can burst through the surface of the Sun and when they do, they create the dark patches known as sunspots.

Astronomers are still studying the precise reasons behind the Sun’s 11-year magnetic flips. However, using Ulysses, they have now shown that, when the Sun’s magnetic axis points near its equator, it allows much more cosmic dust to enter the Solar System than normal. What does that mean for us?

If there is more dust in the Solar System, more of it will fall on Earth also. Scientists estimate that in the coming years, about 40 000 tonnes of dust could fall on Earth every day. However, most of it will be so small that it will burn up in the atmosphere before reaching the ground. This will certainly increase the number of faint shooting stars during the next 11 years, but fortunately the Earth will not become a dustier place!

Original Source: ESA News Release

Pinpointing the Distance to a Pulsar

Image credit: NSF

Astronomers have used the accuracy of the National Science Foundation’s Very Long Baseline Array (VLBA) to pinpoint the distance to a pulsar. The object, called PSR B0656+14, was previously thought to be up to 2,500 light-years away but it was at the same location in the sky as a supernova remnant which is only 1,000 light years away. This was thought to be a coincidence, but the new measurement from the VLBA pegs the pulsar at 950 light years away; the same distance as the remnant – they were both created by the same supernova blast.

Location, location, and location. The old real-estate adage about what’s really important proved applicable to astrophysics as astronomers used the sharp radio “vision” of the National Science Foundation’s Very Long Baseline Array (VLBA) to pinpoint the distance to a pulsar. Their accurate distance measurement then resolved a dispute over the pulsar’s birthplace, allowed the astronomers to determine the size of its neutron star and possibly solve a mystery about cosmic rays.

“Getting an accurate distance to this pulsar gave us a real bonanza,” said Walter Brisken, of the National Radio Astronomy Observatory (NRAO) in Socorro, NM.

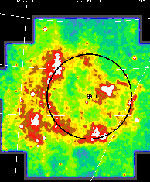
The pulsar, called PSR B0656+14, is in the constellation Gemini, and appears to be near the center of a circular supernova remnant that straddles Gemini and its neighboring constellation, Monoceros, and is thus called the Monogem Ring. Since pulsars are superdense, spinning neutron stars left over when a massive star explodes as a supernova, it was logical to assume that the Monogem Ring, the shell of debris from a supernova explosion, was the remnant of the blast that created the pulsar.

However, astronomers using indirect methods of determining the distance to the pulsar had concluded that it was nearly 2500 light-years from Earth. On the other hand, the supernova remnant was determined to be only about 1000 light-years from Earth. It seemed unlikely that the two were related, but instead appeared nearby in the sky purely by a chance juxtaposition.

Brisken and his colleagues used the VLBA to make precise measurements of the sky position of PSR B0656+14 from 2000 to 2002. They were able to detect the slight offset in the object’s apparent position when viewed from opposite sides of Earth’s orbit around the Sun. This effect, called parallax, provides a direct measurement of distance.

“Our measurements showed that the pulsar is about 950 light-years from Earth, essentially the same distance as the supernova remnant,” said Steve Thorsett, of the University of California, Santa Cruz. “That means that the two almost certainly were created by the same supernova blast,” he added.

With that problem solved. the astronomers then turned to studying the pulsar’s neutron star itself. Using a variety of data from different telescopes and armed with the new distance measurement, they determined that the neutron star is between 16 and 25 miles in diameter. In such a small size, it packs a mass roughly equal to that of the Sun.

The next result of learning the pulsar’s actual distance was to provide a possible answer to a longstanding question about cosmic rays. Cosmic rays are subatomic particles or atomic nuclei accelerated to nearly the speed of light. Shock waves in supernova remnants are thought to be responsible for accelerating many of these particles.

Scientists can measure the energy of cosmic rays, and had noted an excess of such rays in a specific energy range. Some researchers had suggested that the excess could come from a single supernova remnant about 1000 light-years away whose supernova explosion was about 100,000 years ago. The principal difficulty with this suggestion was that there was no accepted candidate for such a source.

“Our measurement now puts PSR B0656+14 and the Monogem Ring at exactly the right place and at exactly the right age to be the source of this excess of cosmic rays,” Brisken said.

With the ability of the VLBA, one of the telescopes of the NRAO, to make extremely precise position measurements, the astronomers expect to improve the accuracy of their distance determination even more.

“This pulsar is becoming a fascinating laboratory for studying astrophysics and nuclear physics,” Thorsett said.

In addition to Brisken and Thorsett, the team of astronomers includes Aaron Golden of the National University of Ireland, Robert Benjamin of the University of Wisconsin, and Miller Goss of NRAO. The scientists are reporting their results in papers appearing in the Astrophysical Journal Letters in August.

The VLBA is a continent-wide system of ten radio- telescope antennas, ranging from Hawaii in the west to the U.S. Virgin Islands in the east, providing the greatest resolving power, or ability to see fine detail, in astronomy. Dedicated in 1993, the VLBA is operated from the NRAO’s Array Operations Center in Socorro, New Mexico.

The National Radio Astronomy Observatory is a facility of the National Science Foundation, operated under cooperative agreement by Associated Universities, Inc.

Original Source: NRAO News Release

Gamma Ray Bursts May Propel Fast Moving Particles

Image credit: NASA

Astronomers believe that gamma-ray bursts, the most powerful explosions in the Universe, may be generating ultrahigh-energy cosmic rays, the most energetic particles in the Universe. These cosmic rays have baffled astronomers because they’re moving faster than if they were thrown out of a supernova. Evidence gathered by NASA’s de-orbited Compton Gamma-Ray Observatory showed that in one instance of a gamma ray burst, these high-energy particles dominated the area giving a connection between them, but this is hardly enough evidence to say they’re conclusively linked.

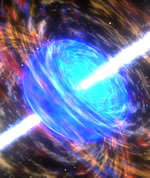
The most powerful explosions in the universe, gamma-ray bursts, may generate the most energetic particles in the universe, known as the ultrahigh-energy cosmic rays (UHECRs), according to a new analysis of observations from NASA’s Compton Gamma-Ray Observatory.

Researchers report in the August 14 edition of Nature of a newly identified pattern in the light from these enigmatic bursts that could be explained by protons moving within a hair’s breadth of light speed.

These protons, like shrapnel from an explosion, could be UHECRs. Such cosmic rays are rare and constitute an enduring mystery in astrophysics, seemingly defying physical explanation, for they are simply far too energetic to have been generated by well-known mechanisms such as supernova explosions.

“Cosmic rays ‘forget’ where they come from because, unlike light, they are whipped about in space by magnetic fields,” said lead author Maria Magdalena Gonzalez of the Los Alamos National Laboratory in New Mexico and graduate student at the University of Wisconsin. “This result is an exciting chance to possibly see evidence of them being produced at their source.”

Gamma-ray bursts — a mystery scientists are finally beginning to unravel — can shine as brilliantly as a million trillion suns, and many may be from an unusually powerful type of exploding star. The bursts are common yet random and fleeting, lasting only seconds.

Cosmic rays are atomic particles (for example, electrons, protons or neutrinos) moving close to light speed. Lower-energy cosmic rays bombard the Earth constantly, propelled by solar flares and typical star explosions. UHECRs, with each atomic particle carrying the energy of a baseball thrown in the Major Leagues, are a hundred-million times more energetic than the particles produced in the largest human-made particle accelerators.

Scientists say the UHECRs must be generated relatively close to the Earth, for any particle traveling farther than 100 million light years would lose some of its energy by the time it reached us. Yet no local source of ordinary cosmic rays seems powerful enough to generate a UHECR.

The Gonzalez-led paper focuses not specifically on UHECR production but rather a new pattern of light seen in a gamma-ray burst. Digging deep into the Compton Observatory archives (the mission ended in 2000), the group found that a gamma-ray burst from 1994, named GRB941017, appears different from the other 2,700-some bursts recorded by this spacecraft. This burst was located in the direction of the constellation Sagitta, the Arrow, likely ten billion light years away.

What scientists call gamma rays are photons (light particles) covering a wide range of energies, in fact, over a million times wider than the energies our eyes register as the colors in a rainbow. Gonzalez’s group looked at the higher-energy gamma-ray photons. The scientists found that these types of photons dominated the burst: They were at least three times more powerful on average than the lower-energy component yet, surprisingly, thousands of times more powerful after about 100 seconds.

That is, while the flow of lower-energy photons hitting the satellite’s detectors began to ease, the flow of higher-energy photons remained steady. The finding is inconsistent with the popular “synchrotron shock model” describing most bursts. So what could explain this enrichment of higher-energy photons?

“One explanation is that ultrahigh-energy cosmic rays are responsible, but exactly how they create the gamma rays with the energy patterns we saw needs a lot of calculating,” said Dr. Brenda Dingus of LANL, a co-author on the paper. “We’ll be keeping some theorists busy trying to figure this out.”

A delayed injection of ultrahigh-energy electrons provides another way to explain the unexpectedly large high-energy gamma-ray flow observed in GRB 941017. But this explanation would require a revision of the standard burst model, said co-author Dr. Charles Dermer, a theoretical astrophysicist at the U.S. Naval Research Laboratory in Washington. “In either case, this result reveals a new process occurring in gamma-ray bursts,” he said.

Gamma-ray bursts have not been detected originating within 100 million light years from Earth, but through the eons these types of explosions may have occurred locally. If so, Dingus said, the mechanism her group saw in GRB 941017 could have been duplicated close to home, close enough to supply the UHECRs we see today.

Other bursts in the Compton Observatory archive may have exhibited a similar pattern, but the data are not conclusive. NASA’s Gamma-ray Large Area Space Telescope (GLAST), scheduled for launch in 2006, will have detectors powerful enough to resolve higher-energy gamma-ray photons and solve this mystery.

Co-authors on the Nature report also include Ph.D. graduate student Yuki Kaneko, Dr. Robert Preece, and Dr. Michael Briggs of the University of Alabama in Huntsville. This research was funded by NASA and the Office of Naval Research.

UHECRs are observed when they crash into our atmosphere, as is illustrated in the figure. The energy from the collision produces an air shower of billions of subatomic particles and flashes of ultraviolet light, which are detected by special instruments.

The National Science Foundation and international collaborators have sponsored instruments on the ground, such as the High Resolution Fly’s Eye in Utah (http://www.cosmic-ray.org/learn.html) and the Auger Observatory in Argentina (http://www.auger.org/). In addition, NASA is working with the European Space Agency to place the Extreme Universe Space Observatory (http://aquila.lbl.gov/EUSO/) on the International Space Station. The proposed OWL mission would, from orbit, look downward towards air showers, viewing a region as large as Texas.

These scientists record the flashes and take a census of the subatomic shrapnel, working backward to calculate how much energy a single particle needs to make the atmospheric cascade. They arrive at a shocking figure of 10^20 electron volts (eV) or more. (For comparison, the energy in a particle of yellow light is 2 eV, and the electrons in your television tube are in the thousand electron volt energy range.)

These ultrahigh-energy particles experience the bizarre effects predicted by Einstein’s theory of special relativity. If we could observe them coming from a remote corner of the cosmos, say a hundred million light years away, we’d have to be patient — it will take a hundred million years to complete the journey. However, if we could travel with the particles, the trip is over in less than a day due to the dilation of time of rapidly moving objects as measured by an observer.

The highest energy cosmic rays cannot even reach us if produced from distant sources, because they collide and lose energy with the cosmic microwave photons left over from the big bang. Sources of these cosmic rays must be found relatively close to us, at a distance of several hundred million light years. Stars that explode as gamma-ray bursts are found within this distance, so intensive observational efforts are underway to find gamma-ray burst remnants distinguished by radiation halos made by the cosmic rays.

Few kinds of celestial objects possess the extreme conditions required to blast particles to UHECR speeds. If gamma-ray bursts produce UHECRs, they probably do so by accelerating particles in jets of matter ejected from the explosion at close to the speed of light. Gamma-ray bursts have the power to accelerate UHECRs, but the gamma-ray bursts observed so far have been remote, billions of light years away. This doesn’t mean they can’t happen nearby, within the UHECR cutoff distance.

A leading contender for long-lived kinds of gamma-ray bursts like GRB941017 is the supernova/collapsar model. Supernovae happen when a star many times more massive than the Sun exhausts its fuel, causing its core to collapse under its own gravity while its outer layers are blown off in an immense thermonuclear explosion. Collapsars are a special type of supernova where the core is so massive it collapses into a black hole, an object so dense that nothing, not even light, can escape its gravity within the black hole’s event horizon. However, observations indicate black holes are sloppy eaters, ejecting material that passes near, but does not cross, their event horizons.

In a collapsar, the star’s core forms a disk of material around the newly formed black hole, like water swirling around a drain. The black hole consumes most of the disk, but some matter is blasted in jets from the poles of the black hole. The jets tear through the collapsing star at close to the speed of light, and then punch through gas surrounding the doomed star. As the jets crash into the interstellar medium, they create shock waves and slow down. Internal shocks also form in the jets as their leading edges slow and are slammed from behind by a stream of high-speed matter. The shocks accelerate particles that generate gamma rays; they could also accelerate particles to UHECR speeds, according to the team.

“It’s like bouncing a ping pong ball between a paddle and a table,” said Dingus. “As you move the paddle closer to the table, the ball bounces faster and faster. In a gamma-ray burst, the paddle and the table are shells ejected in the jet. Turbulent magnetic fields force the particles to ricochet between the shells, accelerating them to almost the speed of light before they break free as UHECRs.”

Detection of neutrinos from gamma-ray bursts would clinch the case for cosmic ray acceleration by gamma-ray bursts. Neutrinos are elusive particles made when high-energy protons collide with photons. Neutrinos have no electrical charge, so still point back to the direction of their source.

The National Science Foundation is currently building IceCube (http://icecube.wisc.edu/), a cubic kilometer detector located in the ice under the South Pole, to search for neutrino emission from gamma-ray bursts. However, the characteristics of nature’s highest-energy particle accelerators remain an enduring mystery, though acceleration by the exploding stars that make gamma-ray bursts has been in favor ever since Mario Vietri (Universita di Roma) and Eli Waxman (Weizmann Institute) proposed it in 1995.

The team believes that while other explanations are possible for this observation, the result is consistent with UHECR acceleration in gamma-ray bursts. They saw both low-energy and high-energy gamma rays in the GRB941017 explosion. The low-energy gamma rays are what scientists expect from high-speed electrons being deflected by intense magnetic fields, while the high-energy rays are what’s expected if some of the UHECRs produced in the burst crash into other photons, creating a shower of particles, some of which flash to produce the high-energy gamma rays when they decay.

The timing of the gamma-ray emission is also significant. The low-energy gamma rays faded away relatively quickly, while the high-energy gamma rays lingered. This makes sense if two different classes of particles – electrons and the protons of the UHECRs – are responsible for the different gamma rays. “It’s much easier for electrons than protons to radiate their energy. Therefore, the emission of low-energy gamma rays from electrons would be shorter than the high-energy gamma rays from the protons,” said Dingus.

The Compton Gamma Ray Observatory was the second of NASA’s Great Observatories and the gamma-ray equivalent to the Hubble Space Telescope and the Chandra X-ray Observatory. Compton was launched aboard the Space Shuttle Atlantis in April 1991, and at 17 tons, was the largest astrophysical payload ever flown at that time. At the end of its pioneering mission, Compton was deorbited and re-entered the Earth’s atmosphere on June 4, 2000.

Original Source: NASA News Release
Amateur Spots a Gamma Ray Burst Afterglow

Image credit: NASA

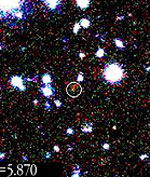
Berto Monard, an amateur astronomer from South Africa was lucky enough to spot the afterglow from a powerful gamma-ray burst – beating professional astronomers to the target. The 40-second-long burst was discovered by NASA’s HETE spacecraft, which provided Monard rough coordinates of where to look. He was able to provide the astronomy community with a precise location so they can follow up days or weeks later to try and determine what actually caused the explosion.

Armed with a 12-inch telescope, a computer, and a NASA email alert, Berto Monard of South Africa has become the first amateur astronomer to discover an afterglow of a gamma-ray burst, the most powerful explosion known in the Universe.

The discovery highlights the ease in tapping into NASA’s burst alert system, as well as the increasing importance that astronomy enthusiasts play in helping scientists understand fleeting and random events, such as star explosions and gamma-ray bursts.

This 40-second-long burst was detected by NASA’s High-Energy Transient Explorer (HETE) on July 25. Monard’s positioning of the lingering afterglow, and thus burst location, has given way to precision follow-up study, an opportunity that very well might have been missed: At the time of the burst, thousands of professional astronomers were attending the International Astronomical Union conference in Sydney, Australia, far away from their observatories.

“I have seen a multitude of stars and galaxies and even supernovae, but this gamma-ray burst afterglow is among the most ancient light that has ever graced my telescope,” Monard said. “The explosion that caused this likely occurred billions of years ago, before the Earth was formed.”

Gamma-ray bursts, many of which now appear to be massive star explosions billions of light years away, only last for a few milliseconds to upwards of a minute. Prompt identification of an afterglow, which can last for hours to days in lower-energy light such as X ray and optical, is crucial for piecing together the explosion that caused the burst.

Monard notified the pros of the burst location within seven hours of the HETE detection. The Interplanetary Network (IPN), comprising six orbiting gamma-ray detectors, confirmed the location shortly thereafter.

Because of the nature of gamma-ray light, which cannot be focused like optical light, HETE locates bursts to only within a few arcminutes. (An arcminute is about the size of an eye of a needle held at arm’s length.) Most gamma-ray bursts are exceedingly far, so myriad stars and galaxies fill that tiny circle. Without prompt localization of a bright and fading afterglow, scientists have great difficulty locating the gamma-ray burst
location days or weeks later.

The study of gamma-ray bursts (and increasing ease of amateur participation) comes through two innovations: faster burst detectors like HETE and a near-instant information relay system called the Gamma-ray Burst Coordinates Network, or GCN, which is located at NASA Goddard Space Flight Center in Greenbelt, Md.

The typical pattern follows: HETE detects a burst and, within a few seconds to about a minute, relays a location to the GCN. Instantly, the automated GCN notifies scientists and amateur astronomers worldwide about the burst event via email, pagers, and a Web site.

Monard is a member of the American Association of Variable Star Observers (AAVSO). This organization operates the AAVSO International High Energy Network, which acts as a liaison between the amateur and the professional communities. Monard essentially used GCN information passed through the AAVSO and other network groups and turned his telescope to the location determined by HETE.

“In the past two years, HETE has opened the door wide for rapid follow-up studies by professional astronomers,” said HETE Principal Investigator George Ricker of MIT. “Now, with GRB030725, the worldwide community of dedicated and expert amateur astronomers coordinated through the AAVSO is leaping through that door to join the fun.”

Monard, a Belgian national living in South Africa, has other discoveries under his belt, including ten supernovae and several outbursts from neutron star systems, as part of his participation with the worldwide Center for Backyard Astrophysics network and the Variable Star Network.

The AAVSO, founded in 1911, is a non-profit, scientific organization with members in 46 countries. It coordinates, compiles, digitizes and disseminates observations on stars that change in brightness (variable stars) to researchers and educators worldwide. Its International High Energy Network was created with cooperation from NASA.

HETE was built by the Massachusetts Institute of Technology under NASA’s Explorer Program. HETE is a collaboration among NASA, MIT, Los Alamos National Laboratory; France’s Centre National d’Etudes Spatiales, Centre d’Etude Spatiale des Rayonnements, and Ecole Nationale Superieure de l’Aeronautique et de l’Espace; and Japan’s Institute of Physical and Chemical Research (RIKEN). The science team includes members from the University of California (Berkeley and Santa Cruz) and the University of Chicago, as well as from Brazil, India and Italy.

Formation of Stars is On the Decline

Image credit: SDSS

The age of star formation in the Universe is drawing to a close, according to a new report from the Sloan Digital Sky Survey. A team of astronomers analyzed the colour of an enormous number of nearby galaxies and found that they contained less young stars than more distant galaxies. Since light takes so long to travel, the more distant galaxies are seen as they appeared many billion years ago. The number of new stars being formed has been on the decline since about 6 billon years ago, when our own Sun formed.

The universe is gently fading into darkness according to three astronomers who have looked at 40,000 galaxies in the neighbourhood of the Milky Way. Research student Ben Panter and Professor Alan Heavens from Edinburgh University’s Institute for Astronomy, and Professor Raul Jimenez of University of Pennsylvania, USA, decoded the “fossil record” concealed in the starlight from the galaxies to build up a detailed account of how many young, recently-formed stars there were at different periods in the 14-billion-year existence of the universe. Their history shows that, for billions of years, there have not been enough new stars turning on to replace all the old stars that die and switch off. The results will be published in the Monthly Notices of the Royal Astronomical Society on 21 August 2003.

“Our analysis confirms that the age of star formation is drawing to a close”, says Alan Heavens. “The number of new stars being formed in the huge sample of galaxies we studied has been in decline for around 6 billion years – roughly since the time our own Sun came into being.”

Astronomers already had evidence that this was the case, mainly from observing galaxies so far away that we see them as they were billions of years ago because of the great length of time their light has taken to reach us. Now the same story emerges strongly from the work of Panter, Heavens and Jimenez, who for the first time approached the problem differently and used the whole spectrum of light from an enormous number of nearby galaxies to get a more complete picture.

Galaxies shine with the combined light of all the stars in them. Most of the light from young stars is blue, coming from very hot massive stars. These blue stars live fast and die young, ending their lives in supernova explosions. When they have gone, they no longer outshine the smaller red stars that are more long-lived. Many galaxies look reddish overall rather than blue – a broad sign that most star formation happened long ago.

In their analysis, Panter, Heavens and Jimenez have used far more than the simple overall colours of the galaxies, though. The spectrum observations they used come from the Sloan Digital Sky Survey and the volume of data involved was so vast, that the researchers had to develop a special lossless data compression method, called MOPED, to allow them to analyse the sample in a reasonable length of time, without losing accuracy.

Original Source: RAS News Release

Astronomers Measure the Shape of a Supernova

Image credit: ESO

New data gathered by the European Southern Observatory’s Very Large Telescope (VLT) seems to indicate that supernovae might not be symmetrical when they explode – their brightness changes depending on how you look at them. This discovery is important, because astronomers use supernovae as an astronomical yardstick to measure distances to objects. If they’re brighter or dimmer depending on how you’re looking at them, it could cause errors in your distance calculations. But the new research indicates that they become more symmetrical over time, so astronomers just need to wait a little while before doing their calculations.

An international team of astronomers [2] has performed new and very detailed observations of a supernova in a distant galaxy with the ESO Very Large Telescope (VLT) at the Paranal Observatory (Chile). They show for the first time that a particular type of supernova, caused by the explosion of a “white dwarf”, a dense star with a mass around that of the Sun, is asymmetric during the initial phases of expansion.

The significance of this observation is much larger than may seem at a first glance. This particular kind of supernova, designated “Type Ia”, plays a very important role in the current attempts to map the Universe. It has for long been assumed that Type Ia supernovae all have the same intrinsic brightness, earning them a nickname as “standard candles”.

If so, differences in the observed brightness between individual supernovae of this type simply reflect their different distances. This, and the fact that the peak brightness of these supernovae rivals that of their parent galaxy, has allowed to measure distances of even very remote galaxies. Some apparent discrepancies that were recently found have led to the discovery of cosmic acceleration.

However, this first clearcut observation of explosion asymmetry in a Type Ia supernova means that the exact brightness of such an object will depend on the angle from which it is seen. Since this angle is unknown for any particular supernova, this obviously introduces an amount of uncertainty into this kind of basic distance measurements in the Universe which must be taken into account in the future.

Fortunately, the VLT data also show that if you wait a little – which in observational terms makes it possible to look deeper into the expanding fireball – then it becomes more spherical. Distance determinations of supernovae that are performed at this later stage will therefore be more accurate.

Supernova explosions and cosmic distances
During Type Ia supernova events, remnants of stars with an initial mass of up to a few times that of the Sun (so-called “white dwarf stars”) explode, leaving nothing behind but a rapidly expanding cloud of “stardust”.

Type Ia supernovae are apparently quite similar to one another. This provides them a very useful role as “standard candles” that can be used to measure cosmic distances. Their peak brightness rivals that of their parent galaxy, hence qualifying them as prime cosmic yardsticks.

Astronomers have exploited this fortunate circumstance to study the expansion history of our Universe. They recently arrived at the fundamental conclusion that the Universe is expanding at an accelerating rate, cf. ESO PR 21/98, December 1998 (see also the Supernova Acceleration Probe web page).

The explosion of a white dwarf star
In the most widely accepted models of Type Ia supernovae the pre-explosion white dwarf star orbits a solar-like companion star, completing a revolution every few hours. Due to the close interaction, the companion star continuously loses mass, part of which is picked up (in astronomical terminology: “accreted”) by the white dwarf.

A white dwarf represents the penultimate stage of a solar-type star. The nuclear reactor in its core has run out of fuel a long time ago and is now inactive. However, at some point the mounting weight of the accumulating material will have increased the pressure inside the white dwarf so much that the nuclear ashes in there will ignite and start burning into even heavier elements. This process very quickly becomes uncontrolled and the entire star is blown to pieces in a dramatic event. An extremely hot fireball is seen that often outshines the host galaxy.

The shape of the explosion
Although all supernovae of Type Ia have quite similar properties, it has never been clear until now how similar such an event would appear to observers who view it from different directions. All eggs look similar and indistinguishable from each other when viewed from the same angle, but the side view (oval) is obviously different from the end view (round).

And indeed, if Type Ia supernova explosions were asymmetric, they would shine with different brightness in different directions. Observations of different supernovae – seen under different angles – could therefore not be directly compared.

Not knowing these angles, however, the astronomers would then infer incorrect distances and the precision of this fundamental method for gauging the structure of the Universe would be in question.

Polarimetry to the rescue
A simple calculation shows that even to the eagle eyes of the VLT Interferometer (VLTI), all supernovae at cosmological distances will appear as unresolved points of light; they are simply too far. But there is another way to determine the angle at which a particular supernova is viewed: polarimetry is the name of the trick!

Polarimetry works as follows: light is composed of electromagnetic waves (or photons) which oscillate in certain directions (planes). Reflection or scattering of light favours certain orientations of the electric and magnetic fields over others. This is why polarising sunglasses can filter out the glint of sunlight reflecting off a pond.

When light scatters through the expanding debris of a supernova, it retains information about the orientation of the scattering layers. If the supernova is spherically symmetric, all orientations will be present equally and will average out, so there will be no net polarisation. If, however, the gas shell is not round, a slight net polarisation will be imprinted on the light.

“Even for quite noticable asymmetries, however, the polarisation is very small and barely exceeds the level of one percent”, says Dietrich Baade, ESO astronomer and a member of the team that performed the observations. “Measuring them requires an instrument that is very sensitive and very stable. ”

The measurement in faint and distant light sources of differences at a level of less than one percent is a considerable observational challenge. “However, the ESO Very Large Telescope (VLT) offers the precision, the light collecting power, as well as the specialized instrumentation required for such a demanding polarimetric observation”, explains Dietrich Baade. “But this project would not have been possible without the VLT being operated in service mode. It is indeed impossible to predict when a supernova will explode and we need to be ready all the time. Only service mode allows observations at short notice. Some years ago, it was a farsighted and courageous decision by ESO’s directorate to put so much emphasis on Service Mode. And it was the team of competent and devoted ESO astronomers on Paranal who made this concept a practical success”, he adds.

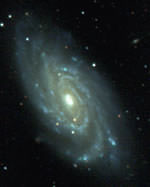
The astronomers [1] used the VLT multi-mode FORS1 instrument to observe SN 2001el, a Type Ia supernova that was discovered in September 2001 in the galaxy NGC 1448, cf. PR Photo 24a/03 at a distance of 60 million light-years.

Observations obtained about a week before this supernova reached maximum brightness around October 2 revealed polarisation at levels of 0.2-0.3% (PR Photo 24b/03). Near maximum light and up to two weeks thereafter, the polarisation was still measurable. Six weeks after maximum, the polarisation had dropped below detectability.

This is the first time ever that a normal Type Ia supernova has been found to exhibit such clear-cut evidence of asymmetry.
Looking deeper into the supernova

Immediately following the supernova explosion, most of the expelled matter moves at velocities around 10,000 km/sec. During this expansion, the outermost layers become progressively more transparent. With time one can thus look deeper and deeper into the supernova.

The polarisation measured in SN 2001el therefore provides evidence that the outermost parts of the supernova (which are first seen) are significantly asymmetric. Later, when the VLT observations “penetrate” deeper towards the heart of the supernova, the explosion geometry is increasingly more symmetric.

If modeled in terms of a flattened spheroidal shape, the measured polarisation in SN 2001el implies a minor-to-major axis ratio of around 0.9 before maximum brightness is reached and a spherically symmetric geometry from about one week after this maximum and onward.
Cosmological implications

One of the key parameters on which Type Ia distance estimates are based is the optical brightness at maximum. The measured asphericity at this moment would introduce an absolute brightness uncertainty (dispersion) of about 10% if no correction were made for the viewing angle (which is not known).

While Type Ia supernovae are by far the best standard candles for measuring cosmological distances, and hence for investigating the so-called dark energy, a small measurement uncertainty persists.

“The asymmetry we have measured in SN 2001el is large enough to explain a large part of this intrinsic uncertainty”, says Lifan Wang, the leader of the team. “If all Type Ia supernovae are like this, it would account for a lot of the dispersion in brightness measurements. They may be even more uniform than we thought.”

Reducing the dispersion in brightness measurements could of course also be attained by increasing significantly the number of supernovae we observe, but given that these measurements demand the largest and most expensive telescopes in the world, like the VLT, this is not the most efficient method.

Thus, if the brightness measured a week or two after maximum was used instead, the sphericity would then have been restored and there would be no systematic errors from the unknown viewing angle. By this slight change in observational procedure, Type Ia supernovae could become even more reliable cosmic yardsticks.
Theoretical implications

The present detection of polarised spectral features strongly suggests that, to understand the underlying physics, the theoretical modelling of Type Ia supernovae events will have to be done in all three dimensions with more accuracy than is presently done. In fact, the available, highly complex hydrodynamic calculations have so far not been able to reproduce the structures exposed by SN 2001el.
More information

The results presented in this press release have been been described in a research paper in “Astrophysical Journal” (“Spectropolarimetry of SN 2001el in NGC 1448: Asphericity of a Normal Type Ia Supernova” by Lifan Wang and co-authors, Volume 591, p. 1110).
Notes

[1]: This is a coordinated ESO/Lawrence Berkeley National Laboratory/Univ. of Texas Press Release. The LBNL press release is available here.

[2]: The team consists of Lifan Wang, Dietrich Baade, Peter H?flich, Alexei Khokhlov, J. Craig Wheeler, Daniel Kasen, Peter E. Nugent, Saul Perlmutter, Claes Fransson, and Peter Lundqvist.

Original Source: ESO News Release