Neutron Star’s Magnetism Measured for the First Time

Image credit: ESA

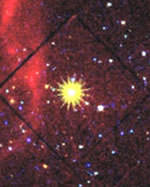
Using the space-based XMM-Newton X-Ray observatory astronomers with the European Space Agency have made the first direct measurement of a neutron star’s magnetic field. A neutron star is a very dense object with the mass of a large star packed into a radius of only 20-30 km, and they were predicted to have very strong magnetic fields which acted like a brake, slowing down their rotation. But after observing a neutron star called 1E1207.4-5209 for over 72 hours with the XMM, the astronomers discovered that it was 30 times weaker than they were predicting. What causes these objects to slow down is once again a mystery.

Using the superior sensitivity of ESA’s X-ray observatory, XMM-Newton, a team of European astronomers has made the first direct measurement of a neutron star’s magnetic field.

The results provide deep insights into the extreme physics of neutron stars and reveal a new mystery yet to be solved about the end of this star?s life.

A neutron star is very dense celestial object that usually has something like the mass of our Sun packed into a tiny sphere only 20?30 km across. It is the product of a stellar explosion, known as a supernova, in which most of the star is blasted into space, but its collapsed heart remains in the form of a super-dense, hot ball of neutrons that spins at a incredible rate.

Despite being a familiar class of object, individual neutron stars themselves remain mysterious. Neutron stars are extremely hot when they are born, but cool down very rapidly. Therefore, only few of them emit highly energetic radiation, such as X-rays. This is why they are traditionally studied via their radio emissions, which are less energetic than X-rays and which usually appear to pulse on and off. Therefore, the few neutron stars which are hot enough to emit X-rays can be seen by X-ray telescopes, such as ESA?s XMM-Newton.

One such neutron star is 1E1207.4-5209. Using the longest ever XMM-Newton observation of a galactic source (72 hours), Professor Giovanni Bignami of the Centre d’Etude Spatiale des Rayonnements (CESR) and his team have directly measured the strength of its magnetic field. This makes it the first ever isolated neutron star where this could be achieved.

All previous values of neutron star magnetic fields could only be estimated indirectly. This is done by theoretical assumptions based on models that describe the gravitational collapse of massive stars, like those which lead to the formation of neutron stars. A second indirect method is to estimate the magnetic field by studying how the neutron star?s rotation slows down, using radio astronomy data.

In the case of 1E1207.4-5209, this direct measurement using XMM-Newton reveals that the neutron star?s magnetic field is 30 times weaker than predictions based on the indirect methods.

How can this be explained? Astronomers can measure the rate at which individual neutron stars decelerate. They have always assumed that ‘friction’ between its magnetic field and its surroundings was the cause. In this case, the only conclusion is that something else is pulling on the neutron star, but what? We can speculate that it may be a small disc of supernova debris surrounding the neutron star, creating an additional drag factor.

The result raises the question of whether 1E1207.4-5209 is unique among neutron stars, or it is the first of its kind. The astronomers hope to target other neutron stars with XMM-Newton to find out.

Note to editors
X-rays emitted by a neutron star like 1E1207.4-5209, have to pass through the neutron star?s magnetic field before escaping into space. En route, particles in the star?s magnetic field can steal some of the outgoing X-rays, imparting on their spectrum tell-tale marks, known as ‘cyclotron resonance absorption lines’. It is this fingerprint that allowed Prof. Bignami and his team to measure the strength of the neutron star?s magnetic field.

Original Source: ESA News Release

Flattest Star Ever Discovered

Image credit: ESO

Astronomers with the European Southern Observatory have discovered a star which is extremely flat All rotating objects in space are flattened due to their rotation; even our Earth is 21 kilometres wider at the equator than it is pole-to-pole. But this new star, called Achernar, is 50% wider at its equator than at its poles. Obviously it’s spinning quickly, but its shape doesn’t fit into the current astrophysics models. It should be losing mass into space at the rate it’s going. Time for some new models.

To a first approximation, planets and stars are round. Think of the Earth we live on. Think of the Sun, the nearest star, and how it looks in the sky.

But if you think more about it, you realize that this is not completely true. Due to its daily rotation, the solid Earth is slightly flattened (“oblate”) – its equatorial radius is some 21 km (0.3%) larger than the polar one. Stars are enormous gaseous spheres and some of them are known to rotate quite fast, much faster than the Earth. This would obviously cause such stars to become flattened. But how flat?

Recent observations with the VLT Interferometer (VLTI) at the ESO Paranal Observatory have allowed a group of astronomers [1] to obtain by far the most detailed view of the general shape of a fast-spinning hot star, Achernar (Alpha Eridani), the brightest in the southern constellation Eridanus (The River).

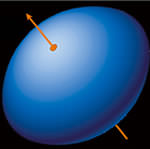
They find that Achernar is much flatter than expected – its equatorial radius is more than 50% larger than the polar one! In other words, this star is shaped very much like the well-known spinning-top toy, so popular among young children.

The high degree of flattening measured for Achernar – a first in observational astrophysics – now poses an unprecedented challenge for theoretical astrophysics. The effect cannot be reproduced by common models of stellar interiors unless certain phenomena are incorporated, e.g. meridional circulation on the surface (“north-south streams”) and non-uniform rotation at different depths inside the star.

As this example shows, interferometric techniques will ultimately provide very detailed information about the shapes, surface conditions and interior structure of stars.

VLTI observations of Achernar
Test observations with the VLT Interferometer (VLTI) at the Paranal Observatory proceed well [2], and the astronomers have now begun to exploit many of these first measurements for scientific purposes.

One spectacular result, just announced, is based on a series of observations of the bright, southern star Achernar (Alpha Eridani; the name is derived from “Al Ahir al Nahr” = “The End of the River”), carried out between September 11 and November 12, 2002. The two 40-cm siderostat test telescopes that served to obtain “First Light” with the VLT Interferometer in March 2001 were also used for these observations. They were placed at selected positions on the VLT Observing Platform at the top of Paranal to provide a “cross-shaped” configuration with two “baselines” of 66 m and 140 m, respectively, at 90? angle, cf. PR Photo 15a/03.

At regular time intervals, the two small telescopes were pointed towards Achernar and the two light beams were directed to a common focus in the VINCI test instrument in the centrally located VLT Interferometric Laboratory. Due to the Earth’s rotation during the observations, it was possible to measure the angular size of the star (as seen in the sky) in different directions.

Achernar’s profile
A first attempt to measure the geometrical deformation of a rapidly rotating star was carried out in 1974 with the Narrabri Intensity Interferometer (Australia) on the bright star Altair by British astronomer Hanbury Brown. However, because of technical limitations, those observations were unable to decide between different models for this star. More recently, Gerard T. Van Belle and collaborators observed Altair with the Palomar Testbed Interferometer (PTI), measuring its apparent axial ratio as 1.140 ? 0.029 and placing some constraints upon the relationship between rotation velocity and stellar inclination.

Achernar is a star of the hot B-type, with a mass of 6 times that of the Sun. The surface temperature is about 20,000 ?C and it is located at a distance of 145 light-years.

The apparent profile of Achernar (PR Photo 15b/03), based on about 20,000 VLTI interferograms (in the K-band at wavelength 2.2 ?m) with a total integration time of over 20 hours, indicates a surprisingly high axial ratio of 1.56 ? 0.05 [3]. This is obviously a result of Achernar’s rapid rotation.

Theoretical implications of the VLTI observations
The angular size of Achernar’s elliptical profile as indicated in PR Photo 15b/03 is 0.00253 ? 0.00006 arcsec (major axis) and 0.00162 ? 0.00001 arcsec (minor axis) [4], respectively. At the indicated distance, the corresponding stellar radii are equal to 12.0 ? 0.4 and 7.7 ? 0.2 solar radii, or 8.4 and 5.4 million km, respectively. The first value is a measure of the star’s equatorial radius. The second is an upper value for the polar radius – depending on the inclination of the star’s polar axis to the line-of-sight, it may well be even smaller.

The indicated ratio between the equatorial and polar radii of Achernar constitutes an unprecedented challenge for theoretical astrophysics, in particular concerning mass loss from the surface enhanced by the rapid rotation (the centrifugal effect) and also the distribution of internal angular momentum (the rotation velocity at different depths).

The astronomers conclude that Achernar must either rotate faster (and hence, closer to the “critical” (break-up) velocity of about 300 km/sec) than what the spectral observations show (about 225 km/sec from the widening of the spectral lines) or it must violate the rigid-body rotation.

The observed flattening cannot be reproduced by the “Roche-model” that implies solid-body rotation and mass concentration at the center of the star. The failure of that model is even more evident if the so-called “gravity darkening” effect is taken into account – this is a non-uniform temperature distribution on the surface which is certainly present on Achernar under such a strong geometrical deformation.

Outlook
This new measurement provides a fine example of what is possible with the VLT Interferometer already at this stage of implementation. It bodes well for the future research projects at this facility.

With the interferometric technique, new research fields are now opening which will ultimately provide much more detailed information about the shapes, surface conditions and interior structure of stars. And in a not too distant future, it will become possible to produce interferometric images of the disks of Achernar and other stars.

Original Source: ESO News Release
Survey Finds 1000 Variable Stars in Nearby Galaxy

Image credit: ESO

An international survey by the European Southern Observatory has uncovered more than 1000 luminous red variable stars in nearby galaxy Centaurus A (aka NGC 5128). This is the first survey that’s ever been performed on a galaxy outside our own Milky Way. These stars, known as Mira-variables, pulse in a very specific way; the longer the cycle, the brighter they are – by comparing the visual brightness to their actual brightness, they can judge distances to these stars very accurately. This allows a very accurate measurement of the distance to Centaurus A.

An international team led by ESO astronomer Marina Rejkuba [1] has discovered more than 1000 luminous red variable stars in the nearby elliptical galaxy Centaurus A (NGC 5128).

Brightness changes and periods of these stars were measured accurately and reveal that they are mostly cool long-period variable stars of the so-called “Mira-type”. The observed variability is caused by stellar pulsation.

This is the first time a detailed census of variable stars has been accomplished for a galaxy outside the Local Group of Galaxies (of which the Milky Way galaxy in which we live is a member).

It also opens an entirely new window towards the detailed study of stellar content and evolution of giant elliptical galaxies. These massive objects are presumed to play a major role in the gravitational assembly of galaxy clusters in the Universe (especially during the early phases).

This unprecedented research project is based on near-infrared observations obtained over more than three years with the ISAAC multi-mode instrument at the 8.2-m VLT ANTU telescope at the ESO Paranal Observatory.

Mira-type variable stars
Among the stars that are visible in the sky to the unaided eye, roughly one out of three hundred (0.3%) displays brightness variations and is referred to by astronomers as a “variable star”. The percentage is much higher among large, cool stars (“red giants”) – in fact, almost all luminous stars of that type are variable. Such stars are known as Mira-variables; the name comes from the most prominent member of this class, Omicron Ceti in the constellation Cetus (The Whale), also known as “Stella Mira” (The Wonderful Star). Its brightness changes with a period of 332 days and it is about 1500 times brighter at maximum (visible magnitude 2 and one of the fifty brightest stars in the sky) than at minimum (magnitude 10 and only visible in small telescopes) [2].

Stars like Omicron Ceti are nearing the end of their life. They are very large and have sizes from a few hundred to about a thousand times that of the Sun. The brightness variation is due to pulsations during which the star’s temperature and size change dramatically.

In the following evolutionary phase, Mira-variables will shed their outer layers into surrounding space and become visible as planetary nebulae with a hot and compact star (a “white dwarf”) at the middle of a nebula of gas and dust (cf. the “Dumbbell Nebula” – ESO PR Photo 38a-b/98).

Several thousand Mira-type stars are currently known in the Milky Way galaxy and a few hundred have been found in other nearby galaxies, including the Magellanic Clouds.

The peculiar galaxy Centaurus A
Centaurus A (NGC 5128) is the nearest giant galaxy, at a distance of about 13 million light-years. It is located outside the Local Group of Galaxies to which our own galaxy, the Milky Way, and its satellite galaxies, the Magellanic Clouds, belong.

Centaurus A is seen in the direction of the southern constellation Centaurus. It is of elliptical shape and is currently merging with a companion galaxy, making it one of the most spectacular objects in the sky, cf. PR Photo 14a/03. It possesses a very heavy black hole at its centre (see ESO PR 04/01) and is a source of strong radio and X-ray emission.

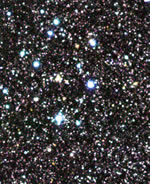
During the present research programme, two regions in Centaurus A were searched for stars of variable brightness; they are located in the periphery of this peculiar galaxy, cf. PR Photos 14b-d/03. An outer field (“Field 1”) coincides with a stellar shell with many blue and luminous stars produced by the on-going galaxy merger; it lies at a distance of 57,000 light-years from the centre. The inner field (“Field 2”) is more crowded and is situated at a projected distance of about 30,000 light-years from the centre.

Three years of VLT observations
Under normal circumstances, any team of professional astronomers will have access to the largest telescopes in the world for only a very limited number of consecutive nights each year. However, extensive searches for variable stars like the present require repeated observations lasting minutes-to-hours over periods of months-to-years. It is thus not feasible to perform such observations in the classical way in which the astronomers travel to the telescope each time.

Fortunately, the operational system of the VLT at the ESO Paranal Observatory (Chile) is also geared to encompass this kind of long-term programme. Between April 1999 and July 2002, the 8.2-m VLT ANTU telescope on Cerro Paranal in Chile) was operated in service mode on many occasions to obtain K-band images of the two fields in Centaurus A by means of the near-infrared ISAAC multi-mode instrument. Each field was observed over 20 times in the course of this three-year period; some of the images were obtained during exceptional seeing conditions of 0.30 arcsec. One set of complementary optical images was obtained with the FORS1 multi-mode instrument (also on VLT ANTU) in July 1999.

Each image from the ISAAC instrument covers a sky field measuring 2.5 x 2.5 arcmin2. The combined images, encompassing a total exposure of 20 hours are indeed the deepest infrared images ever made of the halo of any galaxy as distant as Centaurus A, about 13 million light-years.

Discovering one thousand Mira variables
Once the lengthy observations were completed, two further steps were needed to identify the variable stars in Centaurus A.

First, each ISAAC frame was individually processed to identify the thousands and thousands of faint point-like images (stars) visible in these fields. Next, all images were compared using a special software package (“DAOPHOT”) to measure the brightness of all these stars in the different frames, i.e., as a function of time.

While most stars in these fields as expected were found to have constant brightness, more than 1000 stars displayed variations in brightness with time; this is by far the largest number of variable stars ever discovered in a galaxy outside the Local Group of Galaxies.

The detailed analysis of this enormous dataset took more than a year. Most of the variable stars were found to be of the Mira-type and their light curves (brightness over the pulsation period) were measured, cf. PR Photo 14i/03. For each of them, values of the characterising parameters, the period (days) and brightness amplitude (magnitudes) were determined. A catalogue of the newly discovered variable stars in Centaurus A has now been made available to the astronomical community via the European research journal Astronomy & Astrophysics.

Marina Rejkuba is pleased and thankful: “We are really very fortunate to have carried out this ambitious project so successfully. It all depended critically on different factors: the repeated granting of crucial observing time by the ESO Observing Programmes Committee over different observing periods in the face of rigorous international competition, the stability and reliability of the telescope and the ISAAC instrument over a period of more than three years and, not least, the excellent quality of the service mode observations, so efficiently performed by the staff at the Paranal Observatory.”

What have we learned about Centaurus A?
The present study of variable stars in this giant elliptical galaxy is the first-ever of its kind. Although the evaluation of the very large observational data material is still not finished, it has already led to a number of very useful scientific results.
Confirmation of the presence of an intermediate-age population

Based on earlier research (optical and near-IR colour-magnitude diagrams of the stars in the fields), the present team of astronomers had previously detected the presence of intermediate-age and young stellar populations in the halo of this galaxy. The youngest stars appear to be aligned with the powerful jet produced by the massive black hole at the centre.

Some of the very luminous red variable stars now discovered confirm the presence of a population of intermediate-age stars in the halo of this galaxy. It also contributes to our understanding of how giant elliptical galaxies form.

New measurement of the distance to Centaurus A
The pulsation of Mira-type variable stars obeys a period-luminosity relation. The longer its period, the more luminous is a Mira-type star.

This fact makes it possible to use Mira-type stars as “standard candles” (objects of known intrinsic luminosity) for distance determinations. They have in fact often been used in this way to measure accurate distances to more nearby objects, e.g., to individual clusters of stars and to the center in our Milky Way galaxy, and also to galaxies in the Local Group, in particular the Magellanic Clouds.

This method works particularly well with infrared measurements and the astronomers were now able to measure the distance to Centaurus A in this new way. They found 13.7 ? 1.9 million light-years, in general agreement with and thus confirming other methods.
Study of stellar population gradients in the halo of a giant elliptical galaxy

The two fields here studied contain different populations of stars. A clear dependence on the location (a “gradient”) within the galaxy is observed, which can be due to differences in chemical composition or age, or to a combination of both.

Understanding the cause of this gradient will provide additional clues to how Centaurus A – and indeed all giant elliptical galaxies – was formed and has since evolved.

Comparison with other well-known nearby galaxies
Past searches have discovered Mira-type variable stars thoughout the Milky Way, our home galaxy, and in other nearby galaxies in the Local Group. However, there are no giant elliptical galaxies like Centaurus A in the Local Group and this is the first time it has been possible to identify this kind of stars in that type of galaxy.

The present investigation now opens a new window towards studies of the stellar constituents of such galaxies.

Original Source: ESO News Release
Watch the Mars Explorer Launch Live

If you’re going to be anywhere near a computer connected to the Internet on Tuesday, why not tune into NASA television and watch the launch of the first Mars Explorer rover. NASA’s set up a fast-loading page that will have operational links when their coverage gets started, so you can tune in.

Coverage begins 1600 GMT (12:00pm EDT). Click here to see the page, and then bookmark it so you can check back tomorrow.

I’ll be watching.

Fraser Cain
Publisher
Universe Today

New Station Modules Arrive in Florida

Image credit: NASA

Two major components of the International Space Station arrived at NASA’s Kennedy Space Center in Florida this week. Node 2, built by the European Space Agency, will increase the station’s living and work space, while the Japanese Experiment Module (JEM) will enhance its research capabilities. NASA engineers will perform integration tests over the course of the summer and then the modules will be moved to the KSC Space Station Processing Facility for a future launch on the space shuttle.

After traveling thousands of miles, two major components of the International Space Station completed the first leg of a journey that will eventually end 240 miles above the Earth. NASA’s Node 2, built for the agency by the European Space Agency (ESA) in Italy, and the Pressurized Module of the Japanese Experiment Module (JEM) arrived in Florida and are
being transported to the Kennedy Space Center (KSC) this week.

“Delivery of these components, built in Europe and Japan, to KSC for integrated testing prior to flight is yet another indication of the significant global cooperation and proactive planning required for successful operation of the International Space Station program,” said Bill Gerstenmaier, NASA’s Station Program Manager. “Their arrival in the United States signifies the Space Station international partnership is continuing to move forward with the steps necessary to construct our unique research platform in space,” he said.

The arrival of Node 2, the next pressurized module to be installed on the Station, sets in motion the final steps toward completing assembly of essential U.S. components. When
installed, Node 2 will increase the living and working space inside the Space Station to approximately 18,000 cubic feet. It will also allow the addition of international laboratories
from Europe and Japan.

The Pressurized Module is the first element of the JEM, named “Kibo” (Hope), to be delivered to KSC. The JEM is Japan’s primary contribution to the Station. It will enhance the unique research capabilities of the orbiting complex by providing an additional environment for astronauts to conduct science experiments.

The JEM also includes an exposed facility (platform) for space environment experiments, a robotic manipulator system, and two logistics modules. The various JEM components will be
assembled in space over the course of three Shuttle missions.

An Airbus Beluga heavy-lift aircraft, carrying Node 2, departed May 30 from Turin, Italy, where the Italian Space Agency’s (ASI) contractor, Alenia Spazio, built it. Following post-transportation inspections, ASI will formally transfer ownership of Node 2 to ESA, which, in turn, will sign it over to NASA.

The container transport ship carrying JEM departed May 2 from Yokohama Harbor in Japan for the voyage to the United States. The National Space Development Agency of Japan (NASDA) developed the laboratory at the Tsukuba Space Center near Tokyo.

Later this summer, integrated testing will confirm module compatibility and, ultimately, lead to pre-launch processing at KSC’s Space Station Processing Facility.

Original Source: NASA News Release

Astronomers Begin a Massive Survey of the Milky Way

Image credit: RAVE

Researchers from 11 countries are working together to measure the motion and composition of 50 million stars in the Milky Way. This new survey is called RAVE (Radial Velocity Experiment), and astronomers will be able to use the data gathered to construct a very detailed history of our galaxy. They will be able to determine which widely separated stars were formed at a single location, and help answer competing theories about how our galaxy formed. The pilot phase of the project will begin with the UK Schmidt telescope which can measure 600 stars a night, and then production will pick up as other observatories join the hunt.

Clues to how galaxies formed in the early Universe lie right under our nose – in our own Galaxy. The Galaxy formed by the accretion of infalling satellite galaxies, many astronomers think. Theoretical models of the formation of galaxies predict such a scenario. But not all astronomers are convinced yet and the topic is still controversial.

Now researchers from eleven countries have launched an ambitious project to reconstruct our Galaxy’s history by gathering key components of motion and chemi cal compositions for its apparently brightest 50 million stars.

RAVE (RAdial Velocity Experiment) is an all-sky stellar spectroscopy survey just started on the 1.2-m UK Schmidt telescope in eastern Australia.

Projects such as Hipparcos and Tycho have accurately measured the positions and proper motions – movement across the sky – of more than 2.5 million stars.

But to get a complete picture of stellar motions, and thus to enable astronomers to reconstruct the structure and formation history of our Galaxy, they also need radial velocities – the movement of stars towards or away from the observer. And before RAVE began only about 20,000 stellar radial velocities were in the archives.

RAVE will be able to achieve velocities accurate to within 2 km/s – about 1% of the speed at which stars typically move in the Galaxy.

“With this accuracy and this number of radial velocities we will be able to identify dozens, perhaps hundreds, of streams of stars in the solar vicinity. The streams represent debris from disrupted old satellite galaxies now engulfed by our Galaxy,” said Professor Matthias Steinmetz, Director at the Astrophysical Institute Potsdam and leader of the RAVE science team.

Even after plunging into our Galaxy, the stars of a satellite galaxy continue to move as a coherent group, and can be identified by their common velocity even after billions of years. However, only a very few of those disrupted satellites have been identified to date.

RAVE will also gather the chemical compositions of stars. These should help show which widely separated stars were formed at a common site. They should also determine whether these stars have been formed before or after the satellite galaxy of which they were a part broke up.

“RAVE will help us decide between competing models for the formation of the various structures of the Galaxy, such as the central bulge of stars and the so-called ‘thick disk’,” said Steinmetz.

“For a survey such as this, field of view is more important than aperture. The UK Schmidt telescope is a perfect tool for this work,” said Professor Brian Boyle, Director of the Anglo-Australian Observatory, which operates the telescope. The field of view of the UK Schmidt telescope covers an area more than 100 times larger than that of the Moon.

RAVE’s initial pilot phase is being carried out with the 6dF (six-degree field) instrument on the UK Schmidt. Designed and built by the Anglo-Australian Observatory, the 6dF instrument is a ‘pick and place’ robot that positions 150 fibres on the telescope’s focal plane.

Using 6dF, astronomers can collect up to 600 stellar spectra per night. And by 2005 they plan to have 100,000 – five times as many as have been measured since Hermann Carl Vogel started such work at the Astrophysical Observatory Potsdam in 1888.

In 2006 the pace of data collection will pick up even further, when 6dF instrument is replaced by a radical new instrument from the AAO – UKidna, with 2250 fibres mounted on independently movable spines.

“With UKidna we’ll be taking up to 22,000 spectra on a clear night,” said Boyle.

“Then we’ll be able to push beyond our local Galactic neighbourhood, out into the furthest corners of the Milky Way,” said Professor Rosie Wyse of Johns-Hopkins University in Baltimore.

As well as uncovering the history of our Galaxy, RAVE will establish a huge database of stellar spectra – by far the largest to date.

“This will be a vast resource for studies of the properties and evolution of stars,” said Professor Ulisse Munari of the Padova Observatory in Asagio.

With its large database of stellar spectra RAVE will also provide an ideal training set for the design of future space missions such as the European Space Agency’s cornerstone mission GAIA, which will attempt to measure positions and velocities of up to a billion stars in the Milky Way.

Original Source: AIP News Release

Closest Gamma Ray Burst Ever Discovered

Image credit: NRAO

Gamma ray bursts (GRB) are the largest known explosions in the Universe; immensely powerful, quick to fade, but usually incredibly far away. Astronomers with the National Radio Astronomy Observatory got lucky, though, when they analyzed a recent GRB and discovered it was only 2.6 billion light-years away (most are usually 4 times more distant). What causes these bursts is a mystery, but the theories usually incorporate black holes in some catastrophic way – colliding into another black hole; wrapping a magnetic field like a spring, etc. This close burst didn’t answer the mystery, but it did allow the astronomers to rule out one idea, that material from a GRB blasts out like “cannonballs”.

The closest Gamma Ray Burst (GRB) yet known is providing astronomers with a rare opportunity to gain information vital to understanding these powerful cosmic explosions. Extremely precise radio-telescope observations already have ruled out one proposed mechanism for the bursts.

“This is the closest and brightest GRB we’ve ever seen, and we can use it to decipher the physics of how these bursts work,” said Greg Taylor of the National Radio Astronomy Observatory (NRAO) in Socorro, NM. Taylor worked with Dale Frail, also of the NRAO, along with Prof. Shri Kulkarni and graduate student Edo Berger of Caltech in studying a GRB detected on March 29, 2003. The scientists presented their findings to the American Astronomical Society’s meeting in Nashville, TN.

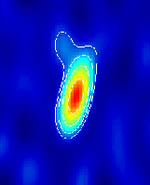
VLBA IMAGE of GRB 030329

CREDIT: NRAO/AUI/NSF
(Click on Image for Larger Version)

Taylor and Frail used the National Science Foundation’s (NSF) Very Long Baseline Array (VLBA) and other radio telescopes to study the burst, known as GRB 030329. In a series of observations from April 1 to May 19, they determined the size of the expanding “fireball” from the burst and measured its position in the sky with great precision.

At a distance of about 2.6 billion light-years, GRB 030329 is hardly next door. However, compared to other GRBs at typical distances of 8-10 billion light-years, it presents an easier target for study.

“We only expect to see one burst per decade this close,” said Frail.

The precise measurement of the object’s position allowed the scientists to show that one theoretical model for GRBs can be ruled out. This model, proposed in 2000, says that the radio-wave energy emitted by the GRB comes from “cannonballs” of material shot from the explosion at extremely high speeds.

“The ‘cannonball model’ predicted that we should see the radio-emitting object move across the sky by a specific amount. We have not seen that motion,” Taylor said.

The currently standard “fireball model” of GRBs says that the radio emission comes from a rapidly-expanding shock wave. This model was first proposed by Peter Meszaros, Bohdan Paczynski and Sir Martin Rees, who won the American Astronomical Society’s Bruno Rossi Prize in 2000 for their work. In this standard model, as the shock wave expands outward, the emission becomes fainter, but the center of the observed emission does not change position.

The cannonball model, however, proposes that the emission arises from distinct concentrations of matter shot outward from the burst. As they move farther from the burst, their motion should be detected as a change in their position in the sky. On April 3, proponents of the cannonball model predicted a specific amount of motion for GRB 030329 and suggested that the VLBA’s sharp radio “vision” could detect the motion and confirm their prediction.

Instead, “our observations are consistent with no motion at all,” Taylor said. “This is at odds with the cannonball model — they made a specific prediction based on their model and the observations do not bear them out,” he added.

The scientists’ direct measurement of the size of the GRB fireball also will provide new insights into the physics behind the burst.

“By directly measuring the size and the expansion rate, we can start putting some real limits on the physics involved,” Taylor said. First, he said, “We already can confirm that the fireball is expanding at nearly the speed of light, as the standard model predicts. Next, once our May observations are fully analyzed, we can put limits on the energy of the burst and provide a test of the standard model.”

Taylor and Frail observed GRB 030329 with the VLBA on April 1 and April 6. On April 22, they used the 100-meter radio telescope in Effelsberg, Germany in addition to the VLBA. On May 19, they used the VLBA, the Very Large Array (VLA) in New Mexico, the NSF’s Robert C. Byrd Green Bank Telescope in West Virginia, and the Effelsberg telescope.

In addition to gamma-ray and X-ray observations, visible light from GRB 030329 was observed by 65 telescopes around the world. At its brightest, the visible light from this burst was detectable with moderate-sized amateur telescopes.

Gamma Ray Bursts were first detected in 1967 by a satellite monitoring compliance with the 1963 atmospheric nuclear test-ban treaty. For three decades thereafter, astronomers were unable to determine their distances from Earth, and thus were unable to begin understanding the physics underlying the explosions. In 1997, the first distance measurements were made to GRBs, and the NSF’s Very Large Array (VLA) detected the first radio emission from a GRB afterglow.

Once scientists determined that GRBs originate in distant galaxies and that they probably occur in regions of those galaxies where stars are actively forming, some 200 proposed models for what causes GRBs were reduced to a handful of viable models.

Most scientists now believe that GRBs arise from a violent explosion that ends the life of a star much more massive than the Sun. Whereas such an explosion as a typical supernova leaves a dense neutron star, a GRB explosion leaves a black hole, a concentration of mass with gravitational pull so strong that not even light can escape it.

The VLBA is a continent-wide system of ten radio- telescope antennas, ranging from Hawaii in the west to the U.S. Virgin Islands in the east, providing the greatest resolving power, or ability to see fine detail, in astronomy. Dedicated in 1993, the VLBA is operated from the NRAO’s Array Operations Center in Socorro, New Mexico.

The National Radio Astronomy Observatory is a facility of the National Science Foundation, operated under cooperative agreement by Associated Universities, Inc.

Original Source: NRAO News Release

Sea Launch Heads for the Equator

Image credit: Sea Launch

The Odyssey Launch Platform and Sea Launch Commander set sail from their port in Los Angeles on Wednesday in preparation to launch the Thuraya-2 satellite on board a Zenit 3SL rocket. The ship and launch platform will reach the launch site, located in the Pacific Ocean at the Equator, and then begin a 72-hour countdown for launch – the 44-minute launch window begins June 10 at 1356 GMT (9:56am PDT). The Thuraya-2 satellite will provide communications in the Middle East, Europe, Africa and Asia.

The Odyssey Launch Platform and the Sea Launch Commander departed Sea Launch Home Port this week, for the launch of the Thuraya-2 satellite. Liftoff is scheduled for June 10, in a 44-minute launch window that opens at 6:56 am PDT (13:56:00 GMT).

The two Sea Launch vessels will travel from Sea Launch Home Port, in the Port of Long Beach, to the launch site on the Equator at 154o West Longitude, where a 72-hour countdown will begin upon arrival. Once the platform is ballasted to launch depth, the team will perform final tests on the rocket and spacecraft, and prepare for launch operations. The 200-foot Zenit-3SL rocket will lift the 5177 kg (11,413 lb) Thuraya-2 satellite to geosynchronous transfer orbit with a liftoff thrust of 1.6 million lbs.

Thuraya-2 was built by Boeing [NYSE:BA] for the Thuraya Satellite Telecommunications Company, of United Arab Emirates, and shipped from its satellite manufacturing facility in El Segundo, Calif. The GEO-Mobile (GEM) model satellite uses a Boeing 702 body-stabilized design and integrates a ground segment and user handsets to provide a range of cellular-like voice and data services over a vast geographic region. Sea Launch successfully inserted the first Boeing GEM model, Thuraya-1, to orbit in October 2000. It is the heaviest commercial spacecraft launched successfully to date.

Thuraya-2 will enable Thuraya Satellite Telecommunications to continue to grow and expand its successful business, providing communications services to the people of 100 nations in the Middle East, Europe, North and Central Africa, and South and Central Asia. Thuraya?s advanced satellite telecommunications provides blanket border-to-border coverage to nearly one third of the globe. Based in Abu Dhabi, Thuraya offers uninterrupted and seamless services that link urban and rural areas, and ensure call continuity over regions with fragmented conventional telecommunication networks.

Sea Launch Company, LLC, headquartered in Long Beach, Calif., is a world leader in providing heavy-lift commercial launch services. This multinational partnership offers the most direct and cost-effective route to geostationary orbit. With the advantage of a launch site on the Equator, the proven Zenit-3SL rocket can lift a heavier spacecraft mass or provide longer life on orbit, offering best value plus schedule assurance. Sea Launch has a current backlog of 16 firm launch contracts. For additional information, visit the Sea Launch website at: www.sea-launch.com

Original Source: Boeing News Release

Astronomers Weigh a Pulsar’s Planets

Image credit: NASA

A team of astronomers have weighed a group of planets orbiting a pulsar by precisely measuring their orbits. So far, two of the system’s three planets have been weighed, and they’re 4.3 and 3.0 times the mass of the Earth. What’s unusual is that the spacing between the planets almost exactly match the spacing of Mercury, Venus and Earth – making this bizarre system the most similar to our own Solar System so far discovered. The pulsar, 1257+12, was discovered 13 years ago using the Arecibo radio telescope.

For the first time, the planets orbiting a pulsar have been “weighed” by measuring precisely variations in the time it takes them to complete an orbit, according to a team of astronomers from the California Institute of Technology and Pennsylvania State University.

Reporting at the summer meeting of the American Astronomical Society, Caltech postdoctoral researcher Maciej Konacki and Penn State astronomy professor Alex Wolszczan announced today that masses of two of the three known planets orbiting a rapidly spinning pulsar 1,500 light-years away in the constellation Virgo have been successfully measured. The planets are 4.3 and 3.0 times the mass of Earth, with an error of 5 percent.

The two measured planets are nearly in the same orbital plane. If the third planet is co-planar with the other two, it is about twice the mass of the moon. These results provide compelling evidence that the planets must have evolved from a disk of matter surrounding the pulsar, in a manner similar to that envisioned for planets around sun-like stars, the researchers say.

The three pulsar planets, with their orbits spaced in an almost exact proportion to the spacings between Mercury, Venus, and Earth, comprise a planetary system that is astonishingly similar in appearance to the inner solar system. They are clearly the precursors to any Earth-like planets that might be discovered around nearby sun-like stars by the future space interferometers such as the Space Interferometry Mission or the Terrestrial Planet Finder.

“Surprisingly, the planetary system around the pulsar 1257+12 resembles our own solar system more than any extrasolar planetary system discovered around a sun-like star,” Konacki said. “This suggests that planet formation is more universal than anticipated.”

The first planets orbiting a star other than the sun were discovered by Wolszczan and Frail around an old, rapidly spinning neutron star, PSR B1257+12, during a large search for pulsars conducted in 1990 with the giant, 305-meter Arecibo radio telescope. Neutron stars are often observable as radio pulsars, because they reveal themselves as sources of highly periodic, pulse-like bursts of radio emission. They are extremely compact and dense leftovers from supernova explosions that mark the deaths of massive, normal stars.

The exquisite precision of millisecond pulsars offers a unique opportunity to search for planets and even large asteroids orbiting the pulsar. This “pulsar timing” approach is analogous to the well-known Doppler effect so successfully used by optical astronomers to identify planets around nearby stars. Essentially, the orbiting object induces reflex motion to the pulsar which result in perturbing the arrival times of the pulses. However, just like the Doppler method, the pulsar timing method is sensitive to stellar motions along the line-of-sight, the pulsar timing can only detect pulse arrival time variations caused by a pulsar wobble along the same line. The consequence of this limitation is that one can only measure a projection of the planetary motion onto the line-of-sight and cannot determine the true size of the orbit.

Soon after the discovery of the planets around PSR 1257+12, astronomers realized that the heavier two must interact gravitationally in a measurable way, because of a near 3:2 commensurability of their 66.5- and 98.2-day orbital periods. As the magnitude and the exact pattern of perturbations resulting from this near-resonance condition depend on a mutual orientation of planetary orbits and on planet masses, one can, in principle, extract this information from precise timing observations.

Wolszczan showed the feasibility of this approach in 1994 by demonstrating the presence of the predicted perturbation effect in the timing of the planet pulsar. In fact, it was the first observation of such an effect beyond the solar system, in which resonances between planets and planetary satellites are commonly observed. In recent years, astronomers have also detected examples of gravitational interactions between giant planets around normal stars.

Konacki and Wolszczan applied the resonance-interaction technique to the microsecond-precision timing observations of PSR B1257+12 made between 1990 and 2003 with the giant Arecibo radio telescope. In a paper to appear in the Astrophysical Journal Letters, they demonstrate that the planetary perturbation signature detectable in the timing data is large enough to obtain surprisingly accurate estimates of the masses of the two planets orbiting the pulsar.

The measurements accomplished by Konacki and Wolszczan remove a possibility that the pulsar planets are much more massive, which would be the case if their orbits were oriented more “face-on” with respect to the sky. In fact, these results represent the first unambiguous identification of Earth-sized planets created from a protoplanetary disk beyond the solar system.

Wolszczan said, “This finding and the striking similarity of the appearance of the pulsar system to the inner solar system provide an important guideline for planning the future searches for Earth-like planets around nearby stars.”

Original Source: Caltech News Release

A View of the Universe Only 900 Million Years Old

Image credit: ESO

A team of astronomers based in Hawaii have discovered a distant galaxy 12.8 billion light years away which shows us what the Universe looked like when it was only 900 million years old. They found the galaxy by using a special camera installed on the Canada-France-Hawaii telescope which searches for distant objects in a very specific frequency of light. By uncovering this galaxy, located in the constellation of Cetus, right near the star Mira, the team has developed a new methodology for discovering distant objects which should help future observers look even further into the past.

With improved telescopes and instruments, observations of extremely remote and faint galaxies have become possible that were until recently astronomers’ dreams.

One such object was found by a team of astronomers [2] with a wide-field camera installed at the Canada-France-Hawaii telescope at Mauna Kea (Hawaii, USA) during a search for extremely distant galaxies. Designated “z6VDF J022803-041618”, it was detected because of its unusual colour, being visible only on images obtained through a special optical filter isolating light in a narrow near-infrared band.

A follow-up spectrum of this object with the FORS2 multi-mode instrument at the ESO Very Large Telescope (VLT) confirmed that it is a very distant galaxy (the redshift is 6.17 [3]). It is seen as it was when the Universe was only about 900 million years old.

z6VDF J022803-041618 is one of the most distant galaxies for which spectra have been obtained so far. Interestingly, it was discovered because of the light emitted by its massive stars and not, as originally expected, from emission by hydrogen gas.

A brief history of the early Universe
Most scientists agree that the Universe emanated from a hot and extremely dense initial state in a Big Bang. The latest observations indicate that this crucial event took place about 13,700 million years ago.

During the first few minutes, enormous quantities of hydrogen and helium nuclei with protons and neutrons were produced. There were also lots of free electrons and during the following epoch, the numerous photons were scattered from these and the atomic nuclei. At this stage, the Universe was completely opaque.

After some 100,000 years, the Universe had cooled down to a few thousand degrees and the nuclei and electrons now combined to form atoms. The photons were then no longer scattered from these and the Universe suddenly became transparent. Cosmologists refer to this moment as the “recombination epoch”. The microwave background radiation we now observe from all directions depicts the state of great uniformity in the Universe at that distant epoch.

In the next phase, the primeval atoms – more than 99% of which were of hydrogen and helium – moved together and began to form huge clouds from which stars and galaxies later emerged. The first generation of stars and, somewhat later, the first galaxies and quasars [4], produced intensive ultraviolet radiation. That radiation did not travel very far, however, despite the fact that the Universe had become transparent a long time ago. This is because the ultraviolet (short-wavelength) photons would be immediately absorbed by the hydrogen atoms, “knocking” electrons off those atoms, while longer-wavelength photons could travel much farther. The intergalactic gas thus again became ionized in steadily growing spheres around the ionizing sources.

At some moment, these spheres had become so big that they overlapped completely; this is referred to as the “epoch of re-ionization”. Until then, the ultraviolet radiation was absorbed by the atoms, but the Universe now also became transparent to this radiation. Before, the ultraviolet light from those first stars and galaxies could not be seen over large distances, but now the Universe suddenly appeared to be full of bright objects. It is for this reason that the time interval between the epochs of “recombination” and “re-ionization” is referred to as the “Dark Ages”.

When was the end of the “Dark Ages”?
The exact epoch of re-ionization is a subject of active debate among astronomers, but recent results from ground and space observations indicate that the “Dark Ages” lasted a few hundred million years. Various research programmes are now underway which attempt to determine better when these early events happened. For this, it is necesary to find and study in detail the earliest and hence, most distant, objects in the Universe – and this is a very demanding observational endeavour.

Light is dimmed by the square of the distance and the further we look out in space to observe an object – and therefore the further back in time we see it – the fainter it appears. At the same time, its dim light is shifted towards the red region of the spectrum due to the expansion of the Universe – the larger the distance, the larger the observed redshift [3].

The Lyman-alpha emission line
With ground-based telescopes, the faintest detection limits are achieved by observations in the visible part of the spectrum. The detection of very distant objects therefore requires observations of ultraviolet spectral signatures which have been redshifted into the visible region. Normally, the astronomers use for this the redshifted Lyman-alpha spectral emission line with rest wavelength 121.6 nm; it corresponds to photons emitted by hydrogen atoms when they change from an excited state to their fundamental state.

One obvious way of searching for the most distant galaxies is therefore to search for Lyman-alpha emission at the reddest (longest) possible wavelengths. The longer the wavelength of the observed Lyman-alpha line, the larger is the redshift and the distance, and the earlier is the epoch at which we see the galaxy and the closer we come towards the moment that marked the end of the “Dark Ages”.

CCD-detectors used in astronomical instruments (as well as in commercial digital cameras) are sensitive to light of wavelengths up to about 1000 nm (1 ?m), i.e., in the very near-infrared spectral region, beyond the reddest light that can be perceived by the human eye at about 700-750 nm.

The bright near-infrared night sky
There is another problem, however, for this kind of work. The search for faint Lyman-alpha emission from distant galaxies is complicated by the fact that the terrestrial atmosphere – through which all ground-based telescopes must look – also emits light. This is particularly so in the red and near-infrared part of the spectrum where hundreds of discrete emission lines originate from the hydroxyl molecule (the OH radical) that is present in the upper terrestrial atmosphere at an altitude of about 80 km (see PR Photo 13a/03).

This strong emission which the astronomers refer to as the “sky background” is responsible for the faintness limit at which celestial objects can be detected with ground-based telescopes at near-infrared wavelengths. However, there are fortunately spectral intervals of “low OH-background” where these emission lines are much fainter, thus allowing a fainter detection limit from ground observations. Two such “dark-sky windows” are evident in PR Photo 13a/03 near wavelengths of 820 and 920 nm.

Considering these aspects, a promising way to search efficiently for the most distant galaxies is therefore to observe at wavelengths near 920 nm by means of a narrow-band optical filter. Adapting the spectral width of this filter to about 10 nm allows the detection of as much light from the celestial objects as possible when emitted in a spectral line matching the filter, while minimizing the adverse influence of the sky emission.

In other words, with a maximum of light collected from the distant objects and a minimum of disturbing light from the terrestrial atmosphere, the chances for detecting those distant objects are optimal. The astronomers talk about “maximizing the contrast” of objects showing emission lines at this wavelength.

The CFHT Search Programme
Based on the above considerations, an international team of astronomers [2] installed a narrow-band optical filter centered at the near-infrared wavelength 920 nm on the CFH12K instrument at the Canada-France-Hawaii telescope on Mauna Kea (Hawaii, USA) to search for extremely distant galaxies. The CFH12K is a wide-field camera used at the prime focus of the CFHT, providing a field-of-view of approx. 30 x 40 arcmin2, somewhat larger than the full moon [5].

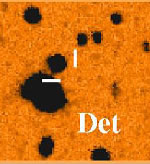
By comparing images of the same sky field taken through different filters, the astronomers were able to identify objects which appear comparatively “bright” in the NB920 image and “faint” (or are even not visible) in the corresponding images obtained through the other filters. A striking example is shown in PR Photo 13b/03 – the object at the center is well visible in the 920nm image, but not at all in the other images.

The most probable explanation for an object with such an unusual colour is that it is a very distant galaxy for which the observed wavelength of the strong Lyman-alpha emission line is close to 920 nm, due to the redshift. Any light emitted by the galaxy at wavelengths shorter than Lyman-alpha is strongly absorbed by intervening interstellar and intergalactic hydrogen gas; this is the reason that the object is not visible in all the other filters.

The VLT spectrum
In order to learn the true nature of this object, it is necessary to perform a spectroscopic follow-up, by observing its spectrum. This was accomplished with the FORS 2 multi-mode instrument at the 8.2-m VLT YEPUN telescope at the ESO Paranal Observatory. This facility provides a perfect combination of moderate spectral resolution and high sensitivity in the red for this kind of very demanding observation. The resulting (faint) spectrum is shown in PR Photo 13c/03.

PR Photo 13d/03 shows a tracing of the final (“cleaned”) spectrum of the object after extraction from the image shown in PR Photo 13c/03. One broad emission line is clearly detected (to the left of the center; enlarged in the insert). It is asymmetric, being depressed on its blue (left) side. This, combined with the fact that no continuum light is detected to the left of the line, is a clear spectral signature of the Lyman-alpha line: photons “bluer” than Lyman-alpha are heavily absorbed by the gas present in the galaxy itself, and in the intergalactic medium along the line-of-sight between the Earth and the object.

The spectroscopic observations therefore allowed the astronomers to identify unambiguously this line as Lyman-alpha, and therefore to confirm the great distance (high redshift) of this particular object. The measured redshift is 6.17, making this object one of the most distant galaxies ever detected. It received the designation “z6VDF J022803-041618” – the first part of this somewhat unwieldy name refers to the survey and the second indicates the position of this galaxy in the sky.

Starlight in the early Universe
However, these observations did not come without surprise! The astronomers had hoped (and expected) to detect the Lyman-alpha line from the object at the center of the 920 nm spectral window. However, while the Lyman-alpha line was found, it was positioned at a somewhat shorter wavelength.

Thus, it was not the Lyman-alpha emission that caused this galaxy to be “bright” in the narrow-band (NB920) image, but “continuum” emission at wavelengths longer than that of Lyman-alpha. This radiation is very faintly visible as a horizontal, diffuse line in PR Photo 13c/03.

One consequence is that the measured redshift of 6.17 is lower than the originally predicted redshift of about 6.5. Another is that z6VDF J022803-041618 was detected by light from its massive stars (the “continuum”) and not by emission from hydrogen gas (the Lyman-alpha line).

This interesting conclusion is of particular interest as it shows that it is in principle possible to detect galaxies at this enormous distance without having to rely on the Lyman-alpha emission line, which may not always be present in the spectra of the distant galaxies. This will provide the astronomers with a more complete picture of the galaxy population in the early Universe.

Moreover, observing more and more of these distant galaxies will help to better understand the ionization state of the Universe at this age: the ultraviolet light emitted by these galaxies should not reach us in a “neutral” Universe, i.e., before re-ionization occurred. The hunt for more such galaxies is now on to clarify how the transition from the Dark Ages happened!

Original Source: ESO News Release