One of the more challenging aspects of space exploration and spacecraft design is planning for re-entry. Even in the case of thinly-atmosphered planets like Mars, entering a planet’s atmosphere is known to cause a great deal of heat and friction. For this reason, spacecraft have always been equipped with heat shields to absorb this energy and ensure that the spacecraft do not crash or burn up during re-entry.
Unfortunately, current spacecraft must rely on huge inflatable or mechanically deployed shields, which are often heavy and complicated to use. To address this, a PhD student from the University of Manchester has developed a prototype for a heat shield that would rely on centrifugal forces to stiffen flexible, lightweight materials. This prototype, which is the first of its kind, could reduce the cost of space travel and facilitate future missions to Mars.
The concept was proposed by Rui Wu, a PhD student from Manchester’s School of Mechanical, Aerospace and Civil Engineering (MACE). He was joined by Peter C.E. Roberts and Carl Driver – a Senior Lecturer in Spacecraft Engineering and a Lecturer at MACE, respectively – and Constantinos Soutis of The University of Manchester Aerospace Research Institute.
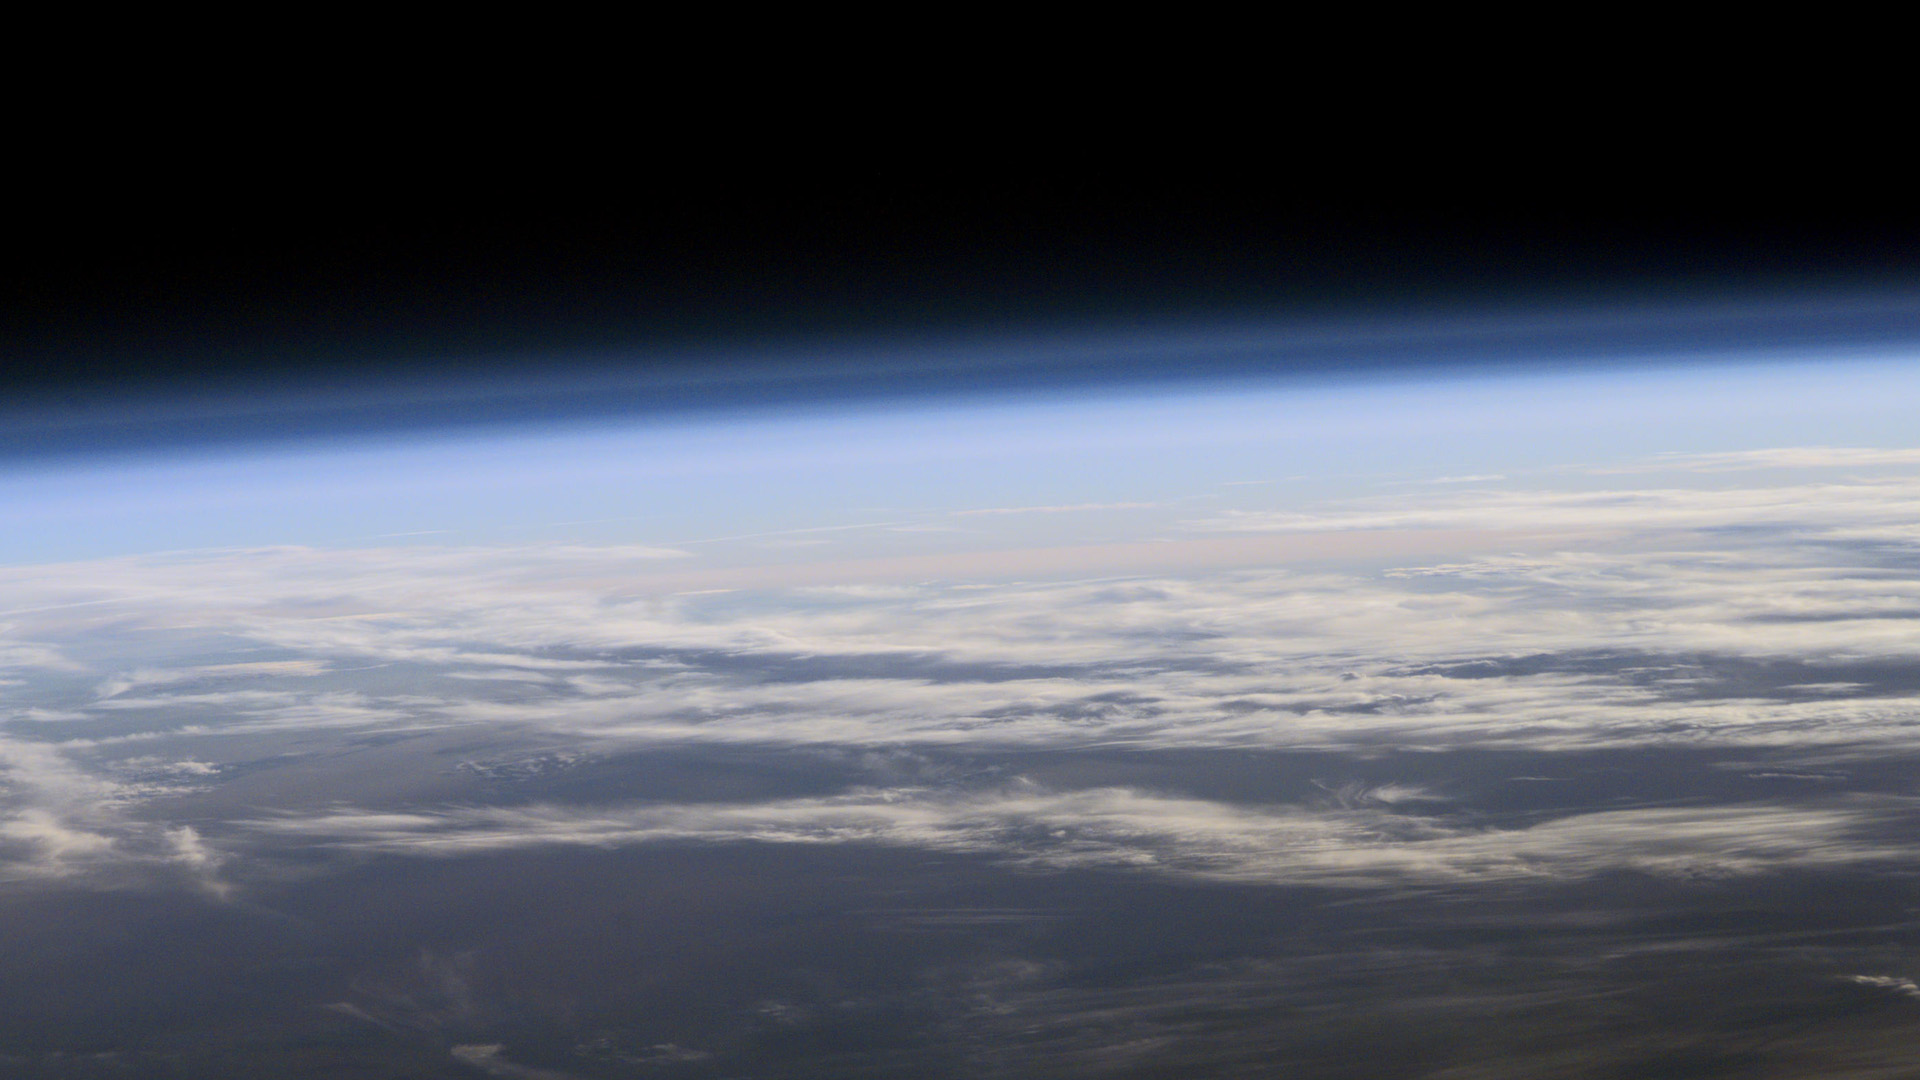
To put it simply, planets with atmospheres allow spacecraft to utilize aerodynamic drag to slow down in preparation for landing. This process creates a tremendous amount of heat. In the case of Earth’s atmosphere, temperatures of 10,000 °C (18,000 °F) are generated and the air around the spacecraft can turn into plasma. For this reason, spacecraft require a front-end mounted heat shield that can tolerate extreme heat and is aerodynamic in shape.
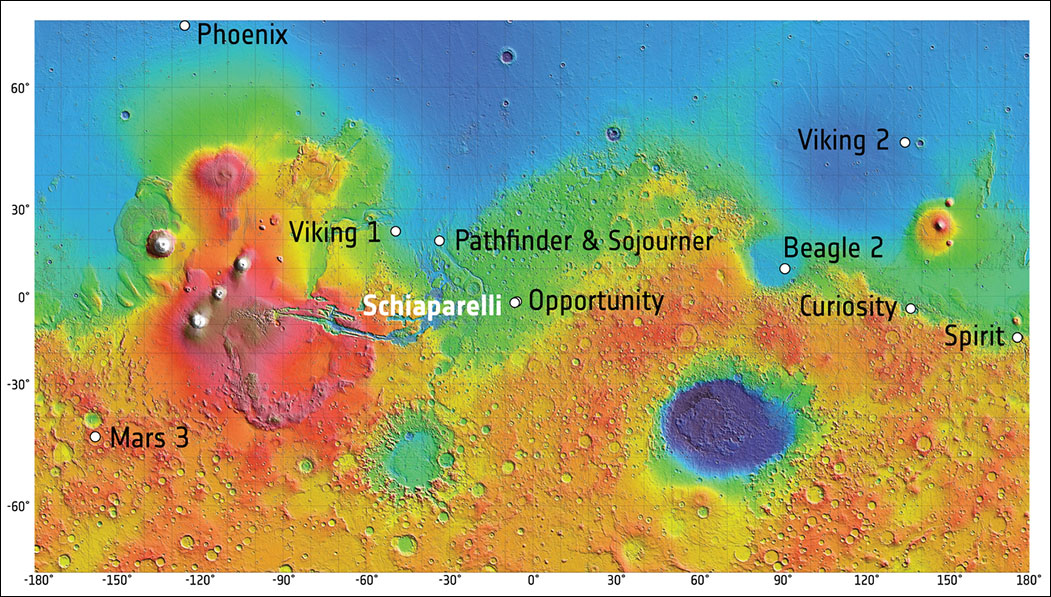
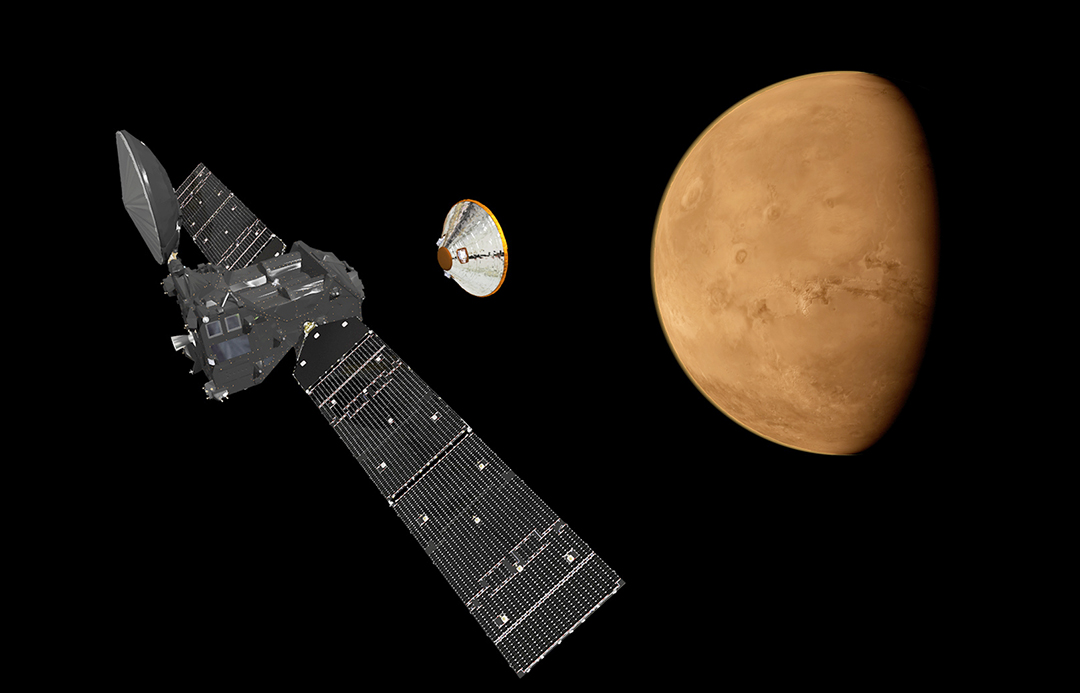
When deploying to Mars, the circumstances are somewhat different, but the challenge remains the same. While the Martian atmosphere is less than 1% that of Earth’s – with an average surface pressure of 0.636 kPa compared to Earth’s 101.325 kPa – spacecraft still require heat shields to avoid burnup and carry heavy loads. Wu’s design potentially solves both of these issues.
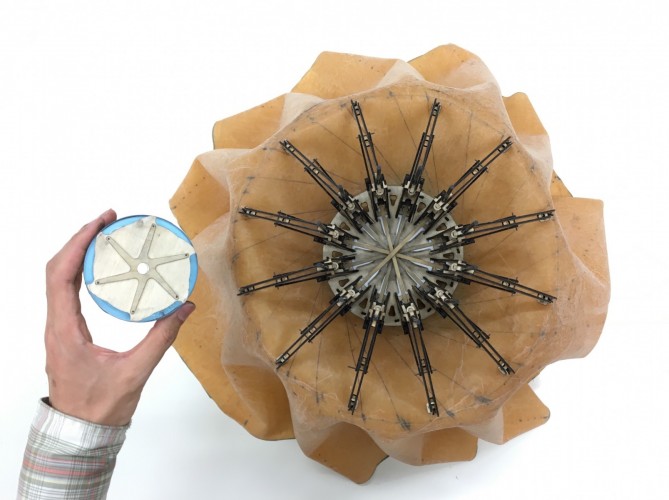
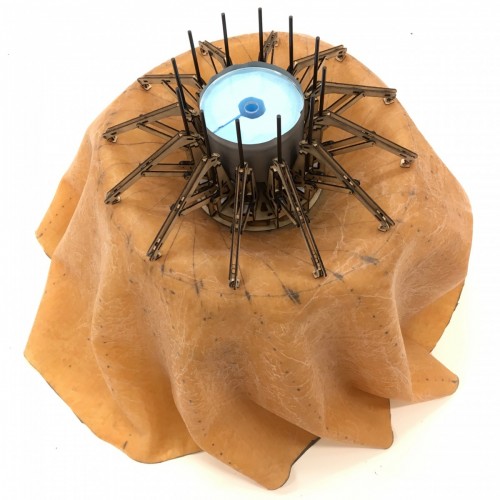
The prototype’s design, which consists of a skirt-shaped shield designed to spin, seeks to create a heat shield that can accommodate the needs of current and future space missions. As Wu explained:
“Spacecraft for future missions must be larger and heavier than ever before, meaning that heat shields will become increasingly too large to manage… Spacecraft for future missions must be larger and heavier than ever before, meaning that heat shields will become increasingly too large to manage.”
Wu and his colleagues described their concept in a recent study that appeared in the journal Arca Astronautica (titled “Flexible heat shields deployed by centrifugal force“). The design consists of an advanced, flexible material that has a high temperature tolerance and allows for easy-folding and storage aboard a spacecraft. The material becomes rigid as the shield applies centrifugal force, which is accomplished by rotating upon entry.
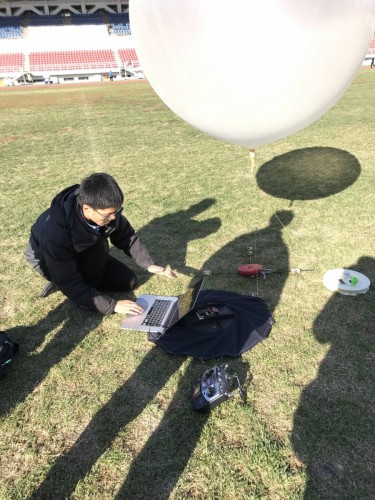
So far, Wu and his team have conducted a drop test with the prototype from an altitude of 100 m (328 ft) using a balloon (the video of which is posted below). They also conducted a structural dynamic analysis that confirmed that the heat shield is capable of automatically engaging in a sufficient spin rate (6 revolutions per second) when deployed from altitudes of higher than 30 km (18.64 mi) – which coincides with the Earth’s stratosphere.
The team also conducted a thermal analysis that indicated that the heat shield could reduce front end temperatures by 100 K (100 °C; 212 °F) on a CubeSat-sized vehicle without the need for thermal insulation around the shield itself (unlike inflatable structures). The design is also self-regulating, meaning that it does not rely on additional machinery, reducing the weight of a spacecraft even further.
And unlike conventional designs, their prototype is scalable for use aboard smaller spacecraft like CubeSats. By being equipped with such a shield, CubeSats could be recovered after they re-enter the Earth’s atmosphere, effectively becoming reusable. This is all in keeping with current efforts to make space exploration and research cost-effective, in part through the development of reusable and retrievable parts. As Wu explained:
“More and more research is being conducted in space, but this is usually very expensive and the equipment has to share a ride with other vehicles. Since this prototype is lightweight and flexible enough for use on smaller satellites, research could be made easier and cheaper. The heat shield would also help save cost in recovery missions, as its high induced drag reduces the amount of fuel burned upon re-entry.”
When it comes time for heavier spacecraft to be deployed to Mars, which will likely involve crewed missions, it is entirely possible that the heat shields that ensure they make it safely to the surface are composed of lightweight, flexible materials that spin to become rigid. In the meantime, this design could enable lightweight and compact entry systems for smaller spacecraft, making CubeSat research that much more affordable.
Such is the nature of modern space exploration, which is all about cutting costs and making space more accessible. And be sure to check out this video from the team’s drop test as well, courtesy of Rui Wui and the MACE team:
Further Reading: University of Manchester, Acta Astronica