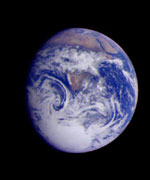
Image credit: NASA
Christopher Chyba is the principal investigator for The SETI Institute lead team of the NASA Astrobiology Institute. Chyba formerly headed the SETI Institute’s Center for the Study of Life in the Universe. His NAI team is pursuing a wide range of research activities, looking at both life’s beginnings on Earth and the possibility of life on other worlds. Astrobiology Magazine’s managing editor, Henry Bortman, spoke recently with Chyba about several of his team’s projects that will explore the origin and significance of oxygen in Earth’s atmosphere.
Astrobiology Magazine: Many of the projects that members of your team will be working on have to do with oxygen in Earth’s atmosphere. Today oxygen is a significant component of the air we breathe. But on early Earth, there was very little oxygen in the atmosphere. There is a great deal of debate about just how and when the planet’s atmosphere became oxygenated. Can you explain how your team’s research will approach this question?
Christopher Chyba: The usual story, with which you’re probably familiar, is that after oxygenic photosynthesis evolved, there was then a huge biological source of oxygen on early Earth. That’s the usual view. It may be right, and what’s usually the case in these kinds of arguments is not whether one effect is right or not. Probably many effects were active. It’s a question of what was the dominant effect, or whether there were several effects of comparable importance.
SETI Institute researcher Friedemann Freund has a completely non-biological hypothesis about the rise of oxygen, which has some experimental support from laboratory work that he’s done. The hypothesis is that, when rocks solidify from magma, they incorporate small amounts of water. Cooling and subsequent reactions leads to the production of peroxy links (consisting of oxygen and silicon atoms) and molecular hydrogen in the rocks.
Then, when the igneous rock is subsequently weathered, the peroxy links produce hydrogen peroxide, which decomposes into water and oxygen. So, if this is right, simply weathering igneous rocks is going to be a source of free oxygen into the atmosphere. And if you look at some of the quantities of oxygen that Friedemann is able to release from rocks in well-controlled situations in his initial experiments, it might be that this was a substantial and significant source of oxygen on early Earth.
So even apart from photosynthesis, there might be a kind of natural source of oxygen on any Earth-like world that had igneous activity and liquid water available. This would suggest that the oxidation of the surface might be something that you expect to occur, whether photosynthesis happens early or late. (Of course, the timing of this depends on oxygen sinks as well.) I emphasize that’s all a hypothesis at this point, for much more careful investigation. Friedemann’s done only pilot experiments so far.
One of the interesting things about Friedemann’s idea is that it suggests there might be an important source of oxygen on planets completely independent of biological evolution. So there might be a natural driver towards the oxidation of the surface of a world, with all the ensuing consequences for evolution. Or maybe not. The point is to do the work and find out.
Another component of his work, which Friedemann will do with the microbiolologist Lynn Rothschild of NASA Ames Research Center, has to do with this question of whether in environments associated with weathered igneous rocks and the production of oxygen, you could have created micro-environments that would have allowed certain microorganisms living in those environments to have pre-adapted to an oxygen-rich environment. They’ll be doing work with microorganisms to try to address that question.
AM: Emma Banks will be looking at chemical interactions in the atmosphere of Saturn’s moon Titan. How does that tie into understanding oxygen on early Earth?
CC: Emma’s looking at another abiotic way that might be important in oxidizing a world’s surface. Emma does chemical computational models, all the way down to the quantum mechanical level. She does them in a number of contexts, but what’s relevant to this proposal has to do with haze formation.
On Titan – and possibly on the early Earth as well, depending on your model for the atmosphere of the early Earth – there’s a polymerization of methane [the combination of methane molecules into larger hydrocarbon-chain molecules] in the upper atmosphere. Titan’s atmosphere is several percent methane; almost all the rest of it is molecular nitrogen. It’s bombarded with ultraviolet light from the sun. It’s also bombarded with charged particles from Saturn’s magnetosphere. The effect of that, acting on the methane, CH4 , is to break the methane up and polymerize it into longer-chain hydrocarbons.
If you start polymerizing methane into longer and longer carbon chains, each time you add another carbon onto the chain, you’ve got to get rid of some hydrogen. For example, to go from CH4 (methane) to C2H6, (ethane) you have to get rid of two hydrogens. Hydrogen is an extremely light atom. Even if it makes H2, that’s an extremely light molecule, and that molecule’s lost off the top of Titan’s atmosphere, just as it’s lost off the top of the Earth’s atmosphere. If you bleed hydrogen off the top of your atmosphere, the net effect is to oxidize the surface. So it’s another way that gives you a net oxidation of a world’s surface.
Emma’s interested in this primarily with respect to what takes place on Titan. But it’s also potentially relevant as a kind of global oxidizing mechanism for the early Earth. And, bringing nitrogen into the picture, she’s interested in the potential production of amino acids out of these conditions.
AM: One of the mysteries about early life on Earth is how it survived the damaging effects of ultraviolet (UV) radiation before there was enough oxygen in the atmosphere to provide an ozone shield. Janice Bishop, Nathalie Cabrol and Edmond Grin, all of whom are with the SETI Institute, are exploring some of these strategies.
CC: And there are a lot of potential strategies there. One is just being deep enough below the surface, whether you’re talking about the land or the sea, to be completely shielded. Another is to be shielded by minerals within the water itself. Janice and Lynn Rothschild are working on a project that is examining the role of ferric oxide minerals in water as a kind of UV shield.
In the absence of oxygen the iron in water would be present as ferric oxide. (When you have more oxygen, the iron oxidizes further; it becomes ferrous and drops out.) Ferric oxide could potentially have played the role of an ultraviolet shield in the early oceans, or in early ponds or lakes. To investigate how good it is as a potential UV shield, there are some measurements you might want to make, including measurements in natural environments, such as in Yellowstone. And once again there’s a microbiological component to the work, with Lynn’s involvement.
This is related to the project that Nathalie Cabrol and Edmond Grin are pursuing, from a different perspective. Nathalie and Edmond are very interested in Mars. They are both on the Mars Exploration Rover science team. In addition to their Mars work, Nathalie and Edmond explore environments on Earth as Mars analog sites. One of their topics of investigation is strategies for survival in high-UV environments. There’s a lake six kilometers high on Licancabur (a dormant volcano in the Andes). We now know there’s microscopic life in that lake. And we’d like to know what are its strategies for surviving in the high-UV environment there? And that’s a different, very empirical way of getting at this question of how life survived in the high-UV environment that existed on early Earth.
These four projects are all coupled, because they have to do with the rise of oxygen on early Earth, how organisms survived before there was substantial oxygen in the atmosphere, and then, how all this relates to Mars.
Original Source: Astrobiology Magazine