Researchers Create the Most Detailed Simulation of the Universe Ever Made

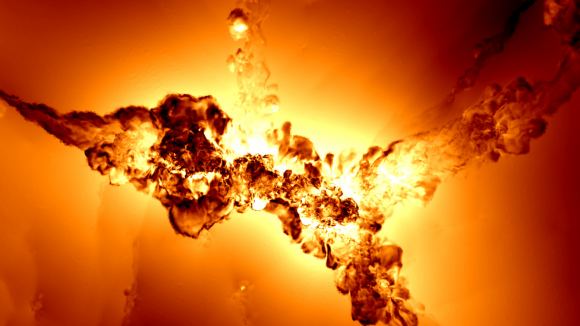
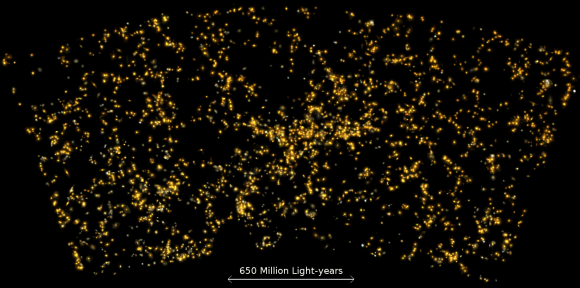
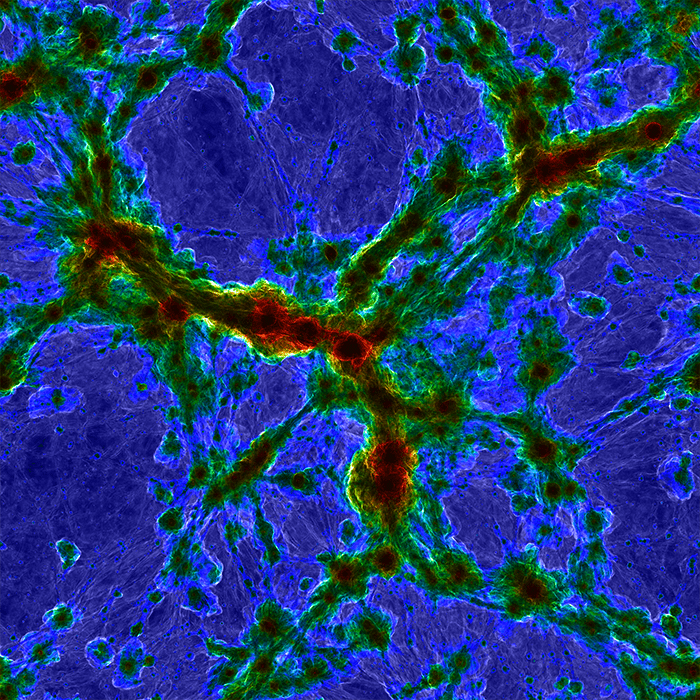
Composite which combines gas temperature (as the color) and shock mach number (as the brightness). Red indicates 10 million Kelvin gas at the centers of massive galaxy clusters, while bright structures show diffuse gas from the intergalactic medium shock heating at the boundary between cosmic voids and filaments. Credit: Illustris Team

Since time immemorial, philosophers and scholars have sought to determine how existence began. With the birth of modern astronomy, this tradition has continued and given rise to the field known as cosmology. And with the help of supercomputing, scientists are able to conduct simulations that show how the first stars and galaxies formed in our Universe and evolved over the course of billions of years.

Until recently, the most extensive and complete study was the “Illustrus” simulation, which looked at the process of galaxy formation over the course of the past 13 billion years. Seeking to break their own record, the same team recently began conducting a simulation known as “Illustris, The Next Generation,” or “IllustrisTNG”. The first round of these findings were recently released, and several more are expected to follow.

These findings appeared in three articles recently published in the Monthly Notices of the Royal Astronomical Society. The Illustris team consists of researchers from the Heidelberg Institute for Theoretical Studies, the Max-Planck Institutes for Astrophysics and for Astronomy, the Massachusetts Institute of Technology, Harvard University, and the Center for Computational Astrophysics in New York.
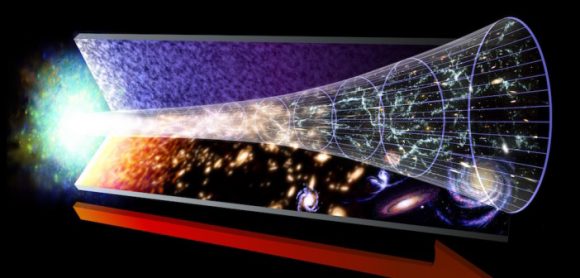
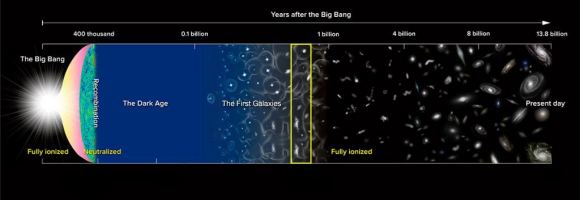
This illustration shows the evolution of the Universe, from the Big Bang on the left, to modern times on the right. Image: NASA

Using the Hazel Hen supercomputer at the High-Performance Computing Center Stuttgart (HLRS) – one of the three world-class German supercomputing facilities that comprise the Gauss Centre for Supercomputing (GCS) – the team conducted a simulation that will help to verify and expand on existing experimental knowledge about the earliest stages of the Universe – i.e. what happened from 300,000 years after the Big Bang to the present day.

To create this simulation, the team combined equations (such as the Theory of General Relativity) and data from modern observations into a massive computational cube that represented a large cross-section of the Universe. For some processes, such as star formation and the growth of black holes, the researchers were forced to rely on assumptions based on observations. They then employed numerical models to set this simulated Universe in motion.

Compared to their previous simulation, IllustrisTNG consisted of 3 different universes at three different resolutions – the largest of which measured 1 billion light years (300 megaparsecs) across. In addition, the research team included more precise accounting for magnetic fields, thus improving accuracy. In total, the simulation used 24,000 cores on the Hazel Hen supercomputer for a total of 35 million core hours.

As Prof. Dr. Volker Springel, professor and researcher at the Heidelberg Institute for Theoretical Studies and principal investigator on the project, explained in a Gauss Center press release:

“Magnetic fields are interesting for a variety of reasons. The magnetic pressure exerted on cosmic gas can occasionally be equal to thermal (temperature) pressure, meaning that if you neglect this, you will miss these effects and ultimately compromise your results.”
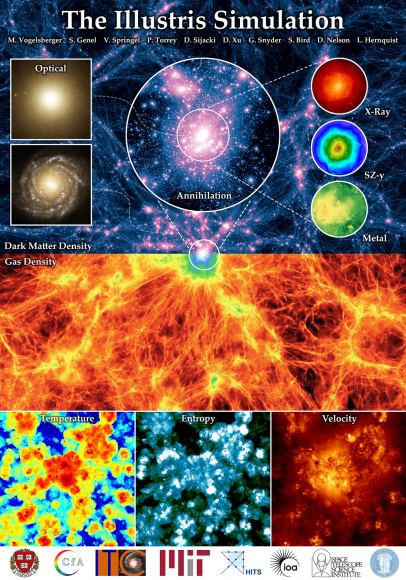
Illustris simulation overview poster. Shows the large scale dark matter and gas density fields in projection (top/bottom). Credit: Illustris Project

Another major difference was the inclusion of updated black hole physics based on recent observation campaigns. This includes evidence that demonstrates a correlation between supermassive black holes (SMBHs) and galactic evolution. In essence, SMBHs are known to send out a tremendous amount of energy in the form of radiation and particle jets, which can have an arresting effect on star formation in a galaxy.

While the researchers were certainly aware of this process during the first simulation, they did not factor in how it can arrest star formation completely. By including updated data on both magnetic fields and black hole physics in the simulation, the team saw a greater correlation between the data and observations. They are therefore more confident with the results and believe it represents the most accurate simulation to date.

But as Dr. Dylan Nelson – a physicist with the Max Planck Institute of Astronomy and an llustricTNG member – explained, future simulations are likely to be even more accurate, assuming advances in supercomputers continue:

“Increased memory and processing resources in next-generation systems will allow us to simulate large volumes of the universe with higher resolution. Large volumes are important for cosmology, understanding the large-scale structure of the universe, and making firm predictions for the next generation of large observational projects. High resolution is important for improving our physical models of the processes going on inside of individual galaxies in our simulation.”
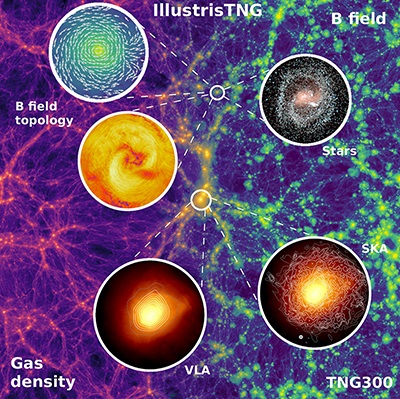
Gas density (left) and magnetic field strength (right) centered on the most massive galaxy cluster. Credit: Illustris Team

This latest simulation was also made possible thanks to extensive support provided by the GCS staff, who assisted the research team with matters related to their coding. It was also the result of a massive collaborative effort that brought together researchers from around the world and paired them with the resources they needed. Last, but not least, it shows how increased collaboration between applied research and theoretical research lead to better results.

Looking ahead, the team hopes that the results of this latest simulation proves to be even more useful than the last. The original Illustris data release gained over 2,000 registered users and resulted in the publication of 130 scientific studies. Given that this one is more accurate and up-to-date, the team expects that it will find more users and result in even more groundbreaking research.

Who knows? Perhaps someday, we may create a simulation that captures the formation and evolution of our Universe with complete accuracy. In the meantime, be sure to enjoy this video of the first Illustris Simulation, courtesy of team member and MIT physicist Mark Vogelsberger:

Further Reading: GCS, Illustrus

The First Results From The IllustrisTNG Simulation Of The Universe Has Been Completed, Showing How Our Cosmos Evolved From The Big Bang

IllustrisTNG is a new simulation model for the Universe. It used over 24,000 processors over the course of more than two months to produce the largest hydrodynamic simulation project to date for the emergence of cosmic structures. Image: IllustrisTNG

The first results of the IllustrisTNG Project have been published in three separate studies, and they’re shedding new light on how black holes shape the cosmos, and how galaxies form and grow. The IllustrisTNG Project bills itself as “The next generation of cosmological hydrodynamical simulations.” The Project is an ongoing series of massive hydrodynamic simulations of our Universe. Its goal is to understand the physical processes that drive the formation of galaxies.

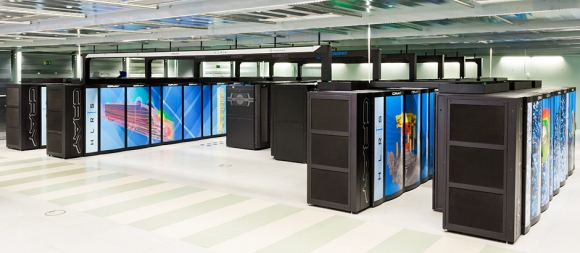
At the heart of IllustriousTNG is a state of the art numerical model of the Universe, running on one of the most powerful supercomputers in the world: the Hazel Hen machine at the High-Performance Computing Center in Stuttgart, Germany. Hazel Hen is Germany’s fastest computer, and the 19th fastest in the world.

The Hazel Hen Supercomputer is based on Intel processors and Cray network technologies. Image: IllustrisTNG

Our current cosmological model suggests that the mass-energy density of the Universe is dominated by dark matter and dark energy. Since we can’t observe either of those things, the only way to test this model is to be able to make precise predictions about the structure of the things we can see, such as stars, diffuse gas, and accreting black holes. These visible things are organized into a cosmic web of sheets, filaments, and voids. Inside these are galaxies, which are the basic units of cosmic structure. To test our ideas about galactic structure, we have to make detailed and realistic simulated galaxies, then compare them to what’s real.

Astrophysicists in the USA and Germany used IllustrisTNG to create their own universe, which could then be studied in detail. IllustrisTNG correlates very strongly with observations of the real Universe, but allows scientists to look at things that are obscured in our own Universe. This has led to some very interesting results so far, and is helping to answer some big questions in cosmology and astrophysics.

How Do Black Holes Affect Galaxies?

Ever since we’ve learned that galaxies host supermassive black holes (SMBHs) at their centers, it’s been widely believed that they have a profound influence on the evolution of galaxies, and possibly on their formation. That’s led to the obvious question: How do these SMBHs influence the galaxies that host them? Illustrious TNG set out to answer this, and the paper by Dr. Dylan Nelson at the Max Planck Institute for Astrophysics shows that “the primary driver of galaxy color transition is supermassive blackhole feedback in its low-accretion state.”

“The only physical entity capable of extinguishing the star formation in our large elliptical galaxies are the supermassive black holes at their centers.” – Dr. Dylan Nelson, Max Planck Institute for Astrophysics,

Galaxies that are still in their star-forming phase shine brightly in the blue light of their young stars. Then something changes and the star formation ends. After that, the galaxy is dominated by older, red stars, and the galaxy joins a graveyard full of “red and dead” galaxies. As Nelson explains, “The only physical entity capable of extinguishing the star formation in our large elliptical galaxies are the supermassive black holes at their centers.” But how do they do that?

Nelson and his colleagues attribute it to supermassive black hole feedback in its low-accretion state. What that means is that as a black hole feeds, it creates a wind, or shock wave, that blows star-forming gas and dust out of the galaxy. This limits the future formation of stars. The existing stars age and turn red, and few new blue stars form.

This is a rendering of gas velocity in a massive galaxy cluster in IllustrisTNG. Black areas are hardly moving, and white areas are moving at greater than 1000km/second. The black areas are calm cosmic filaments, the white areas are near super-massive black holes (SMBHs). The SMBHs are blowing away the gas and preventing star formation. Image: IllustrisTNG

How Do Galaxies Form and How Does Their Structure Develop?

It’s long been thought that large galaxies form when smaller galaxies join up. As the galaxy grows larger, its gravity draws more smaller galaxies into it. During these collisions, galaxies are torn apart. Some stars will be scattered, and will take up residence in a halo around the new, larger galaxy. This should give the newly-created galaxy a faint background glow of stellar light. But this is a prediction, and these pale glows are very hard to observe.

“Our predictions can now be systematically checked by observers.” – Dr. Annalisa Pillepich (Max Planck Institute for Astrophysics)

IllustrisTNG was able to predict more accurately what this glow should look like. This gives astronomers a better idea of what to look for when they try to observe this pale stellar glow in the real Universe. “Our predictions can now be systematically checked by observers,” Dr. Annalisa Pillepich (MPIA) points out, who led a further IllustrisTNG study. “This yields a critical test for the theoretical model of hierarchical galaxy formation.”

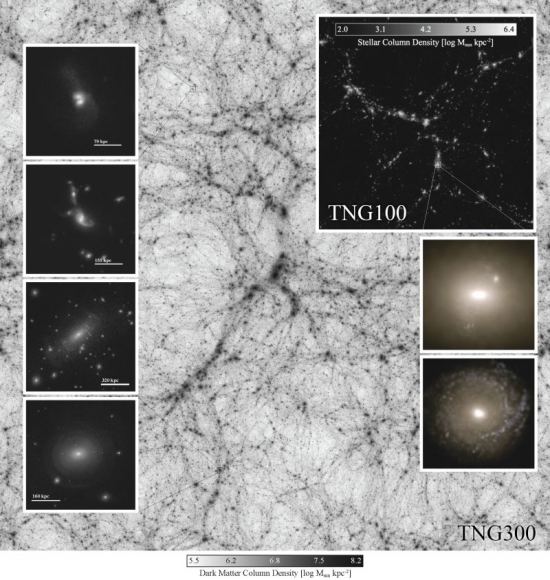
A composite image from IllustrisTNG. Panels on the left show galaxy-galaxy interactions and the fine-grained structure of extended stellar halos. Panels on the right show stellar light projections from two massive central galaxies at the present day. It’s easy to see how the light from massive central galaxies overwhelms the light from stellar halos. Image: IllustrisTNG

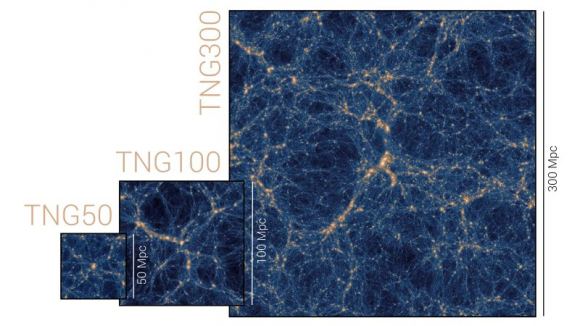
IllustrisTNG is an on-going series of simulations. So far, there have been three IllustrisTNG runs, each one creating a larger simulation than the previous one. They are TNG 50, TNG 100, and TNG 300. TNG300 is much larger than TNG50 and allows a larger area to be studied which reveals clues about large-scale structure. Though TNG50 is much smaller, it has much more precise detail. It gives us a more detailed look at the structural properties of galaxies and the detailed structure of gas around galaxies. TNG100 is somewhere in the middle.

TNG 50, TNG 100, and TNG 300. Image: IllustrisTNG

IllustrisTNG is not the first cosmological hydrodynamical simulation. Others include Eagle, Horizon-AGN, and IllustrisTNG’s predecessor, Illustris. They have shown how powerful these predictive theoretical models can be. As our computers grow more powerful and our understanding of physics and cosmology grow along with them, these types of simulations will yield greater and more detailed results.

New Map Shows the Motion of all the Galaxies in Our Supercluster

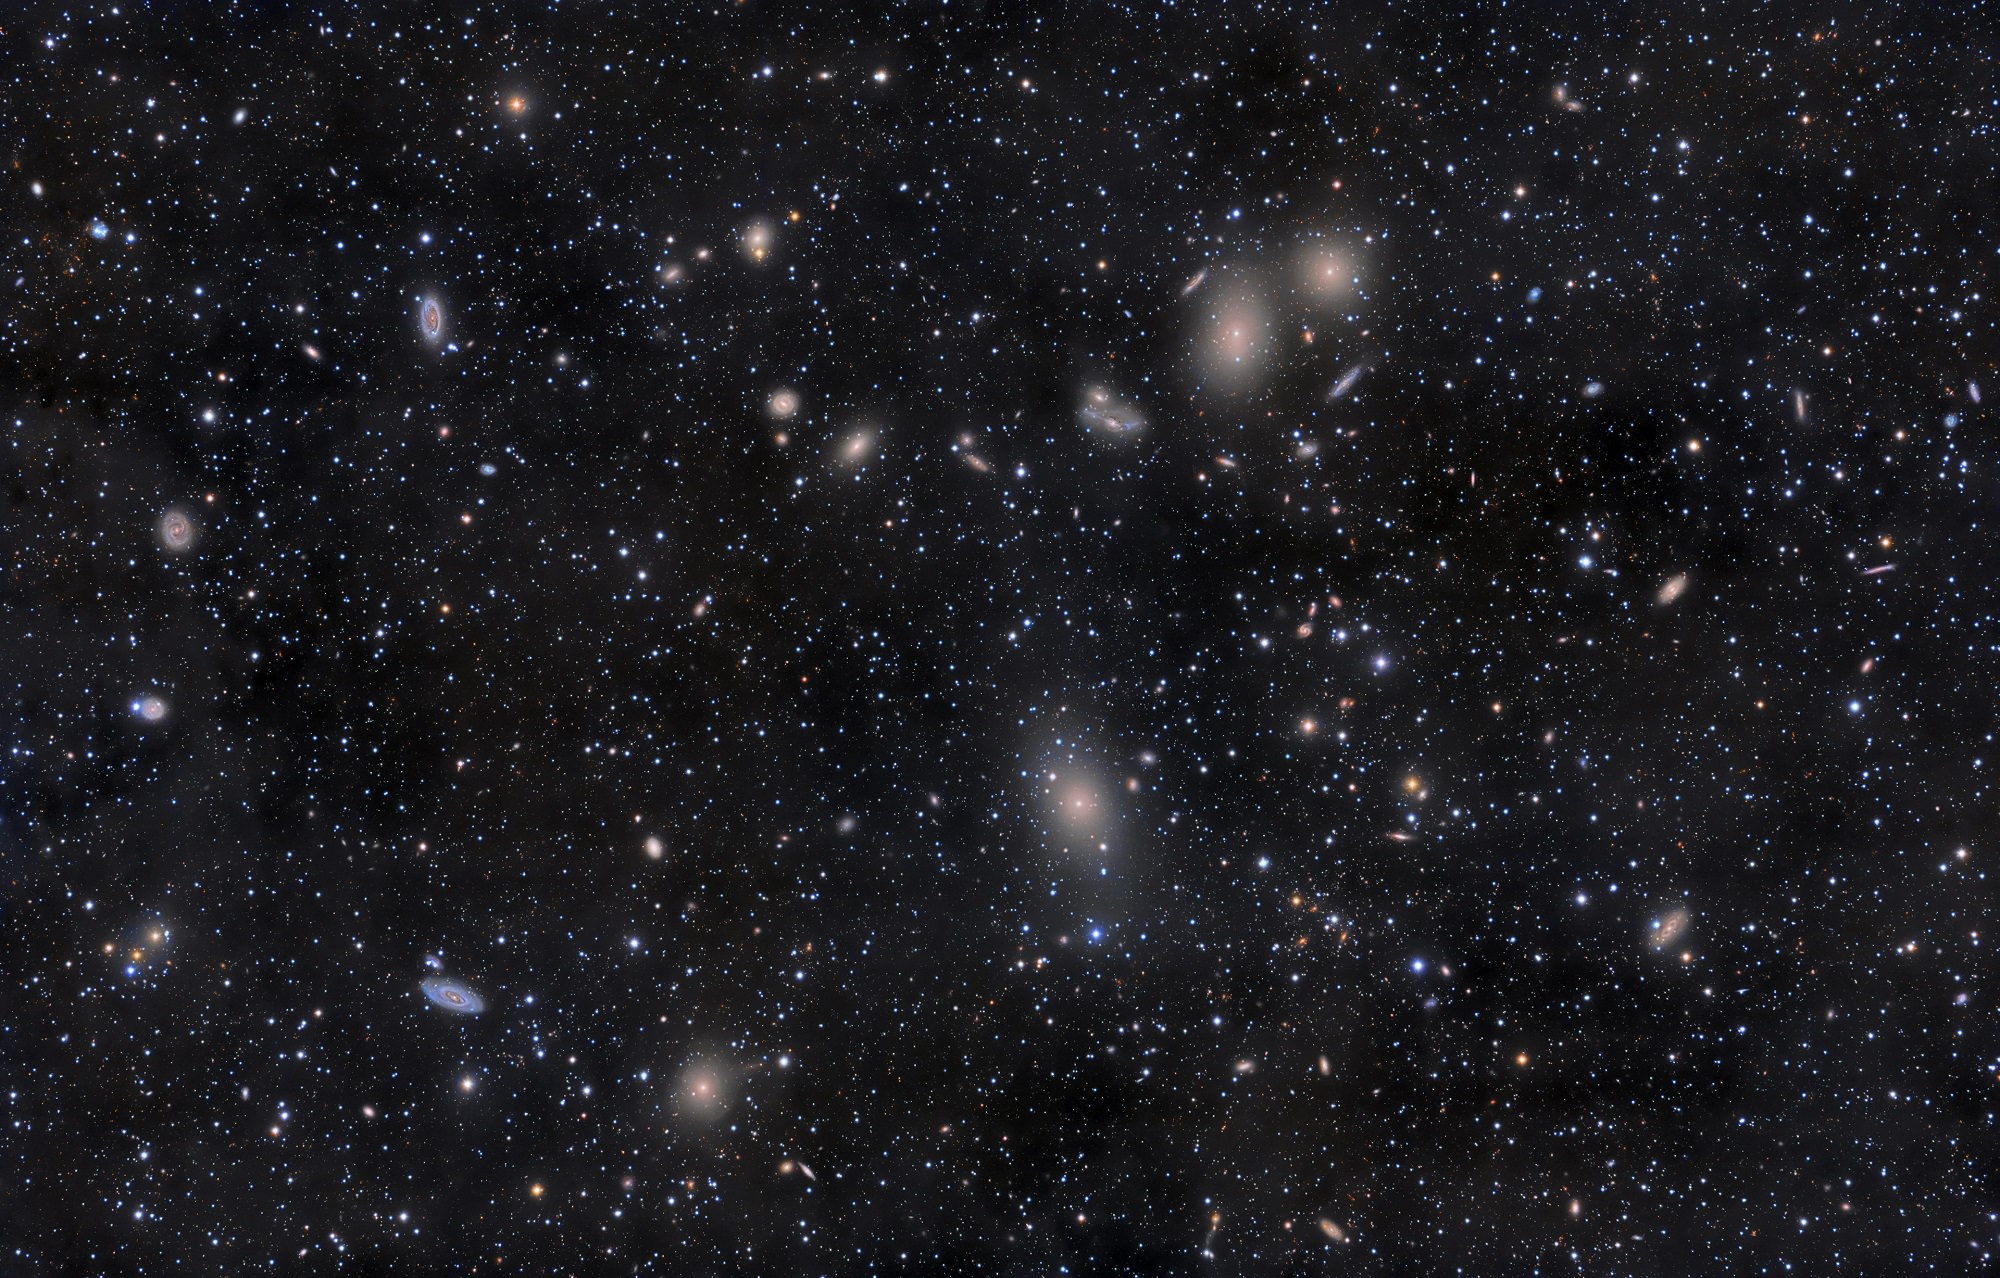
A mosaic of telescopic images showing the galaxies of the Virgo Supercluster. It's part of the cosmic web in which a galaxy can exist during part of its evolution. Credit: NASA/Rogelio Bernal Andreo

For almost a century, astronomers have understood that the Universe is in a state of expansion. This is a consequence of General Relativity, and the rate at which it is expanding is known as the Hubble Constant – named after the man who first noticed the phenomena. However, astronomers have also learned that withing the large-scale structures of the Universe, galaxies and clusters have also been moving closer and relative to one other.

For decades, astronomers have sought to track how these movements have taken place over the course of cosmic history. And thanks to the efforts of international team of astronomers, the most detailed map to date of the orbits of galaxies that lie within the Virgo Supercluster has been created. This map encompasses the past motions of almost 1,400 galaxies within 100 million light years of space, showing how our cosmic neighborhood has changed.

The study which details their research recently appeared in The Astrophysical Journal under the title “Action Dynamics of the Local Supercluster“. Led by Edward J. Shaya of the University of Maryland, the team included members from the UH Institute of Astronomy, the Racah Institute of Physics in Jerusalem, and the Institute for Research of the Fundamental Laws of the Universe (IRFU) in Paris.

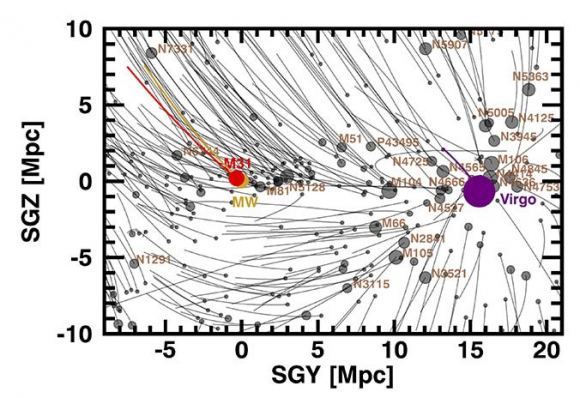
Orbits of galaxies in the Local Supercluster. Credit: Brent Tully.

For the sake of their study, the team used data from the CosmicFlows surveys, a series of three studies that calculated the distance and speed of neighboring galaxies between 2011 and 2016. Several members of the study team were involved in these surveys, which they then paired with other distance and gravity field estimates to construct a massive flow study of the Virgo Supercluster.

From this, they were able to create computer models that charted the motions of almost 1,400 galaxies within 100 million light years, and over the course of 13 billion years (just 800 million years after the Big Bang). As Brent Tully, an astronomer with the UH Institute of Astronomy and a co-author on the study, explained in a UH press release:

“For the first time, we are not only visualizing the detailed structure of our Local Supercluster of galaxies but we are seeing how the structure developed over the history of the universe. An analogy is the study of the current geography of the Earth from the movement of plate tectonics.”

What they found was that their models fit the present day velocity flow well, meaning that the structures and speeds they observed in their models fit with what has been observed from galaxies in the present day. They also determined that within the area of space they mapped, the main gravitational attractor is the Virgo Cluster – which is located about 50 million light years away and contains between 1300 and 2000 galaxies.

Moreover, their study indicated that more than a thousand galaxies have fallen into the Virgo Cluster in the past 13 billion years, while all galaxies within 40 million light-years of the cluster will eventually be captured. At present, the Milky Way lies just outside this capture zone, but both the Milky Way and the Andromeda Galaxy are destined to merge in the next 4 billion years.

Once they do, the fate of the resulting massive galaxy will be similar to the rest of the galaxies in the area of study. This was another takeaway from the study, where the team determined that these merger events are merely part of a larger pattern. Basically, within the region of space they observed, there are two overarching flow patterns. Within one hemisphere of this region, all galaxies – including the Milky Way – are streaming towards a single flat sheet.

At the same time, every galaxy over the entire volume of space is moving towards gravitational attractors that are located far beyond the area of study. They determined that these outside forces are none other than the Centaurus Supercluster – a cluster of hundreds of galaxies, located approximately 170 million light years away in the Centaurus constellation – and the Great Attractor.

The Great Attractor is located 150 million light years away, and is a mysterious region that cannot be seen because of its location (on the opposite side of the Milky Way). However, for decades, scientists have known that our galaxy and other nearby galaxies are moving towards it. The region is also the core of the Laniakea Supercluster, a region that spans more than 500 million light-years and contains about 100,000 large galaxies.

In short, while the Universe is in a state of expansion, the dynamics of galaxies and galaxy clusters indicate that they still gravitate into tighter structures.  Within our cosmic neighborhood, the main attractor is clearly the Virgo Cluster, which is affecting all galaxies within a 40 million light-year radius. Beyond this, it is the Centaurus Supercluster and the Great Attractor (as part of the larger Laniakea Supercluster) that is tugging at our strings.

By charting this process of attraction that has been taking place over the past 13 billion years, astronomers and cosmologists are able to see just how our Universe has evolved over the course of the majority of its history. With time, and improved instruments that are capable of looking even deeper into the cosmos (such as the James Webb Space Telescope) we are expected to be able to probe even further back towards the beginning of the cosmos.

Charting how our Universe has changed over time not only confirms our cosmological models and verifies predominant theories about how matter behaves on the largest of scales (i.e. General Relativity). It also allows scientists to predict the future of our Universe with a fair degree of certainty, modelling how galaxies and superclusters will eventually come together to form even larger structures.

The team also created a video showing the results of their study, as well as an interactive model that let’s users examine the frame of reference from multiple vantage points. Be sure to check out the video below, and head on over to the UH page to access their interactive model.

Further Reading: University of Hawaii, The Astrophysical Journal

Book Review: Cosmology for the Curious

Ancient woodcarving of where heaven and earth meet. Credit: Heikenwaelder Hugo at Wikimedia Commons.

What will Curious George grow up to be? Being curious, then George will ask a lot of questions. And if lucky then physics will be George’s destiny, for physics seems to have so many answers. From the biggest to the smallest, that’s its purview. And for Delia Perlov and Alex Vilenkin in their book “Cosmology for the Curious” aim to answer a great many of those questions. Or at least those questions pertaining to mankind’s place in space.

Cosmology is all about space and time. Which means that this book begins by traveling back in time. Traveling to the time of the Greeks. Hundreds of years b.c.e.  Apparently the Greek philosophers did a lot of pondering about the smallest of things they called atoms. And the largest, they called planetary epicycles. From this baseline the book very quickly progresses through the traditional growth of knowledge with some choice descriptions.

As an example it proposes energy as nature’s ultimate currency. And it allows the reader to wonder. Wonder why the sky is black at night. And ask questions. As in “why is the speed of light the same as the Earth travels about the Sun?”

Most of the descriptions rely on Newtonian mechanics for explanation but it is only a slight passing for the book quickly raises Einstein’s field equations, particularly emphasizing inertial frames of reference. With this, the reader is accorded a pleasant view of Lorentz transforms, a somewhat abstract view of the Sun being flung out of the solar system by a very large golf club and a realization of how the GPS navigation system incorporates gravitational time dilation. Still all this is simply the cosmological baseline for the reader.

Now the neat thing about cosmology is that there is simply no first hand observation. Most everything of interest happened a long time ago and in a somewhat different relative location. And this is the book’s next and most rewarding destination. Through many arguments or thought experiments, it associates the cosmic microwave background with redshifts and the changing spatial dimensions.

Later, postulated dark matter and dark energy refocus the reader’s attention on the very beginning of the universe in a big bang. Or perhaps a multiverse of many shapes and various physical laws. Which of course leads to considerations about what’s next. How will our universe continue? Will it go to a quiet heat death or will we be gobbled up by another bubble universe? We can’t determine from our vantage point on Earth. But this book does provide its own vantage point.

Helping this book along are a number of pleasant additions. For one, often when an accomplished researcher is mentioned, there’s an accompanying, quite complementary photograph. And equations are liberally spread throughout as if teasing the reader to explore more. But the book has very little math. And best of all are the questions at the end of each chapter. Now these questions aren’t your typical textbook questions. For example, consider “Inflation is almost certainly eternal to the future. Is it eternal to the past too? Why/why not?” Isn’t this a great question? And one that you really can’t get wrong.

Which of course begs the question “Why aren’t you as curious as George?” There’s a whole universe out there waiting for us to explore and understand. Let’s not take it for granted. Let’s satisfy our curiosity perhaps with reading the marvellous book “Cosmology for the Curious” by Delia Perlov and Alex Vilenkin. After all you don’t want to be upstaged by George, do you?

Astronomers Find the Missing Normal Matter in the Universe, Still Looking for Dark Matter, Though

The structure of the universe at the largest scale. Credit: NASA, ESA, and E. Hallman (University of Colorado, Boulder)

For decades, the predominant cosmological model used by scientists has been based on the theory that in addition to baryonic matter – aka. “normal” or “luminous” matter, which we can see – the Universe also contains a substantial amount of invisible mass. This “Dark Matter” accounts for roughly 26.8% of the mass of the Universe, whereas normal matter accounts for just 4.9%.

While the search for Dark Matter is ongoing and direct evidence is yet to be found, scientists have also been aware that roughly 90% of the Universe’s normal matter still remained undetected. According to two new studies that were recently published, much of this normal matter – which consists of filaments of hot, diffuse gas that links galaxies together – may have finally been found.

The first study, titled “A Search for Warm/Hot Gas Filaments Between Pairs of SDSS Luminous Red Galaxies“, appeared in the Monthly Notices of the Royal Astronomic Society. The study was led by Hideki Tanimura, a then-PhD candidate at the University of British Columbia, and included researchers from the Canadian Institute for Advanced Research (CIFAR), the Liverpool John Moores University and the University of KwaZulu-Natal.

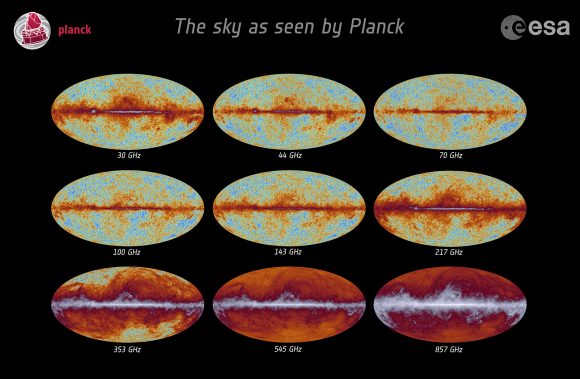
All-sky data obtained by the ESA’s Planck mission, showing the different wavelenghts. Credit: ESA

The second study, which recently appeared online, was titled “Missing Baryons in the Cosmic Web Revealed by the Sunyaev-Zel’dovich Effect“. This team consisted of researchers from the University of Edinburgh and was led Anna de Graaff, a undergraduate student from the Institute for Astronomy at Edinburgh’s Royal Observatory. Working independently of each other, these two team tackled a problem of the Universe’s missing matter.

Based on cosmological simulations, the predominant theory has been that the previously-undetected normal matter of the Universe consists of strands of baryonic matter – i.e. protons, neutrons and electrons – that is floating between galaxies. These regions are what is known as the “Cosmic Web”, where low density gas exists at a temperatures of 105 to 107 K (-168 t0 -166 °C; -270 to 266 °F).

For the sake of their studies, both teams consulted data from the Planck Collaboration, a venture maintained by the European Space Agency that includes all those who contributed to the Planck mission (ESA). This was presented in 2015, where it was used to create a thermal map of the Universe by measuring the influence of the Sunyaev-Zeldovich (SZ) effect.

This effect refers to a spectral distortion in the Cosmic Microwave Background, where photons are scattered by ionized gas in galaxies and larger structures. During its mission to study the cosmos, the Planck satellite measured the spectral distortion of CMB photons with great sensitivity, and the resulting thermal map has since been used to chart the large-scale structure of the Universe.

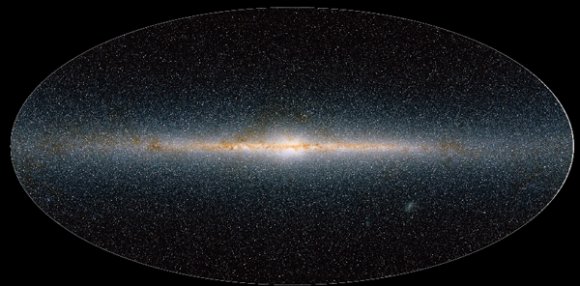
IR map of the whole Galaxy showing the plane and bulge of the Galaxy full of stars and dust. Credit: SDSS

However, the filaments between galaxies appeared too faint for scientists to examine at the time. To remedy this, the two teams consulted data from the North and South CMASS galaxy catalogues, which were produced from the 12th data release of the Sloan Digital Sky Survey (SDSS). From this data set, they then selected pairs of galaxies and focused on the space between them.

They then stacked the thermal data obtained by Planck for these areas on top of each other in order to strengthen the signals caused by SZ effect between galaxies. As Dr. Hideki told Universe Today via email:

“The SDSS galaxy survey gives a shape of the large-scale structure of the Universe. The Planck observation provides an all-sky map of gas pressure with a better sensitivity. We combine these data to probe the low-dense gas in the cosmic web.”

While Tanimura and his team stacked data from 260,000 galaxy pairs, de Graaff and her team stacked data from over a million. In the end, the two teams came up with strong evidence of gas filaments, though their measurements differed somewhat. Whereas Tanimura’s team found that the density of these filaments was around three times the average density in the surrounding void, de Graaf and her team found that they were six times the average density.

“We detect the low-dense gas in the cosmic web statistically by a stacking method,” said Hideki. “The other team uses almost the same method. Our results are very similar. The main difference is that we are probing a nearby Universe, on the other hand, they are probing a relatively farther Universe.”

This illustration shows the evolution of the Universe, from the Big Bang on the left, to modern times on the right. Image: NASA

This particular aspect of particularly interesting, in that it hints that over time, baryonic matter in the Cosmic Web has become less dense. Between these two results, the studies accounted for between 15 and 30% of the total baryonic content of the Universe. While that would mean that a significant amount of the Universe’s baryonic matter still remains to be found, it is nevertheless an impressive find.

As Hideki explained, their results not only support the current cosmological model of the Universe (the Lambda CDM model) but also goes beyond it:

“The detail in our universe is still a mystery. Our results shed light on it and reveals a more precise picture of the Universe. When people went out to the ocean and started making a map of our world, it was not used for most of the people then, but we use the world map now to travel abroad. In the same way, a map of the entire universe may not be valuable now because we do not have a technology to go far out to the space. However, it could be valuable 500 years later. We are in the first stage of making a map of the entire Universe.”

It also opens up opportunities for future studies of the Comsic Web, which will no doubt benefit from the deployment of next-generation instruments like James Webb Telescope, the Atacama Cosmology Telescope and the Q/U Imaging ExperimenT (QUIET). With any luck, they will be able to spot the remaining missing matter. Then, perhaps we can finally zero in on all the invisible mass!

Further Reading: MNRAS, arXiv,

LIGO and Virgo Observatories Detect Black Holes Colliding

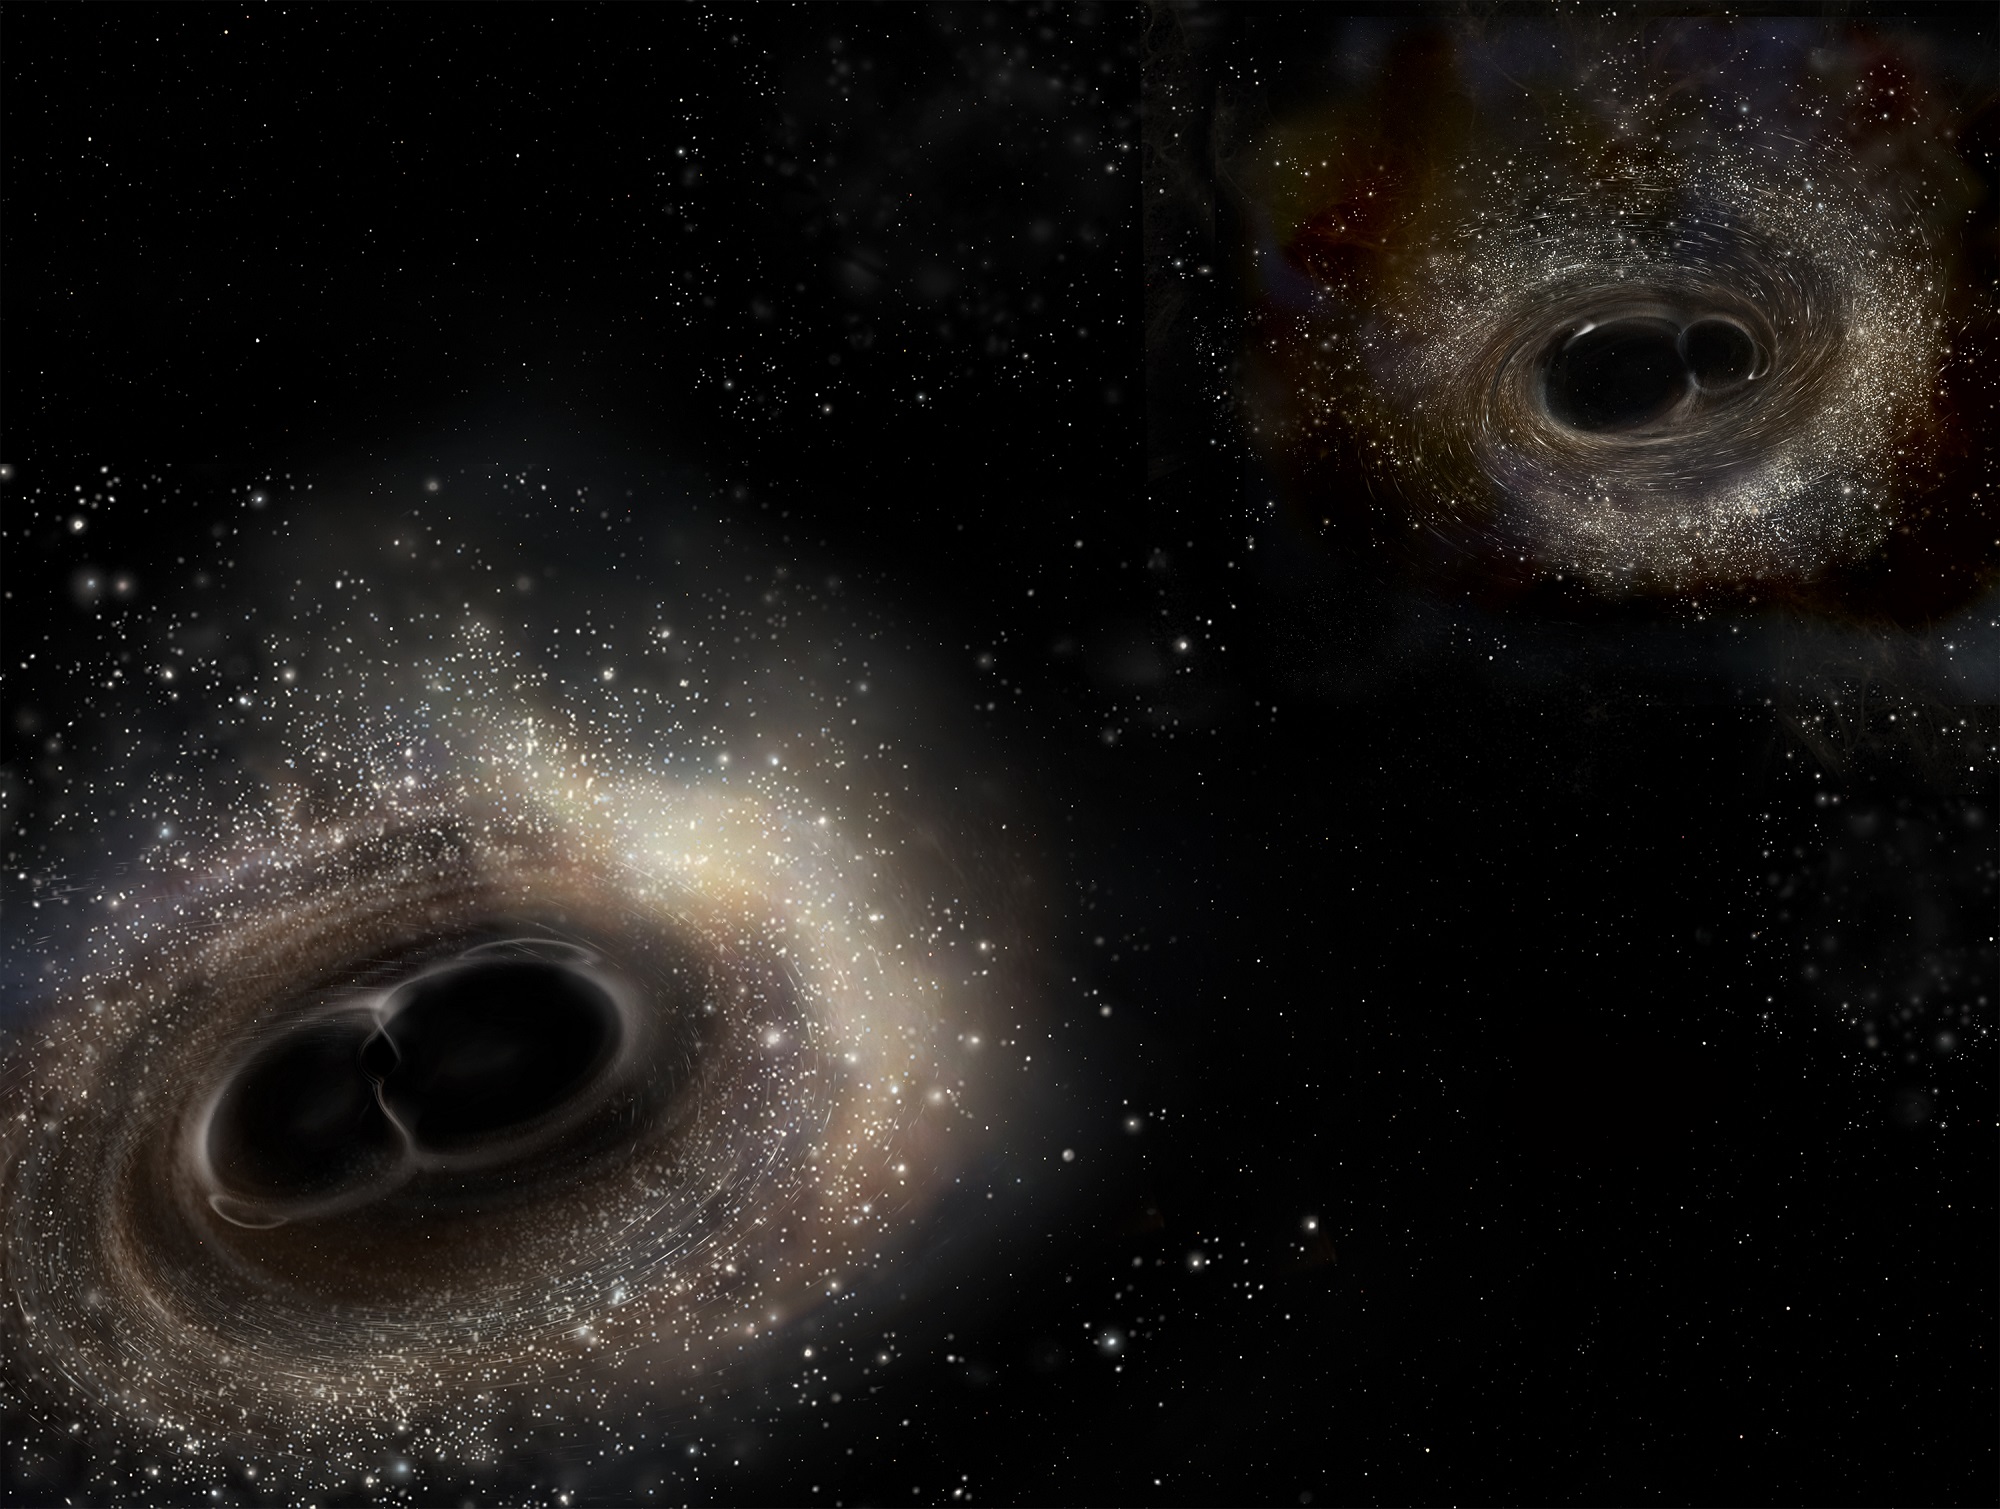
In February 2016, LIGO detected gravity waves for the first time. As this artist's illustration depicts, the gravitational waves were created by merging black holes. The third detection just announced was also created when two black holes merged. Credit: LIGO/A. Simonnet.
Artist's impression of merging binary black holes. Credit: LIGO/A. Simonnet.

On February 11th, 2016, scientists at the Laser Interferometer Gravitational-wave Observatory (LIGO) announced the first detection of gravitational waves. This development, which confirmed a prediction made by Einstein’s Theory of General Relativity a century ago, has opened up new avenues of research for cosmologists and astrophysicists. Since that time, more detections have been made, all of which were said to be the result of black holes merging.

The latest detection took place on August 14th, 2017, when three observatories – the Advanced LIGO and the Advanced Virgo detectors – simultaneously detected the gravitational waves created by merging black holes. This was the first time that gravitational waves were detected by three different facilities from around the world, thus ushering in a new era of globally-networked research into this cosmic phenomena.

The study which detailed these observations was recently published online by the LIGO Scientific Collaboration and the Virgo Collaboration. Titled “GW170814 : A Three-Detector Observation of Gravitational Waves from a Binary Black Hole Coalescence“, this study has also been accepted for publication in the scientific journal Physical Review Letters.

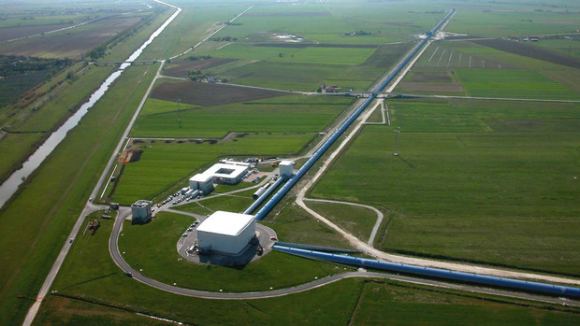
Aerial view of the Virgo Observatory. Credit: The Virgo collaboration/CCO 1.0

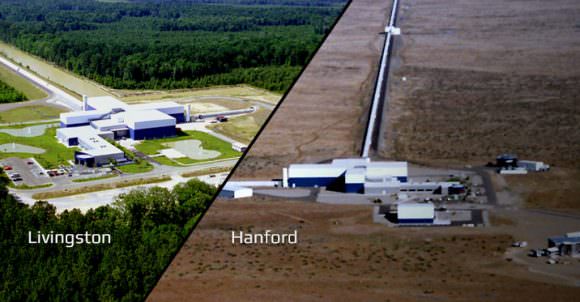
The event, designated as GW170814, was observed at 10:30:43 UTC (06:30:43 EDT; 03:30:43 PDT) on August 14th, 2017. The event was detected by the National Science Foundation‘s two LIGO detectors (located in Livingston, Louisiana, and Hanford, Washington) and the Virgo detector located near Pisa, Italy – which is maintained by the National Center for Scientific Research (CNRS) and the National Institute for Nuclear Physics (INFN).

Though not the first instance of gravitational waves being detected, this was the first time that an event was detected by three observatories simultaneously. As France Córdova, the director of the NSF, said in a recent LIGO press release:

“Little more than a year and a half ago, NSF announced that its Laser Interferometer Gravitational Wave Observatory had made the first-ever detection of gravitational waves, which resulted from the collision of two black holes in a galaxy a billion light-years away. Today, we are delighted to announce the first discovery made in partnership between the Virgo gravitational-wave observatory and the LIGO Scientific Collaboration, the first time a gravitational wave detection was observed by these observatories, located thousands of miles apart. This is an exciting milestone in the growing international scientific effort to unlock the extraordinary mysteries of our universe.”

Based on the waves detected, the LIGO Scientific Collaboration (LSC) and Virgo collaboration were able to determine the type of event, as well as the mass of the objects involved. According to their study, the event was triggered by the merger of two black holes – which were 31 and 25 Solar Masses, respectively. The event took place about 1.8 billion light years from Earth, and resulted in the formation of a spinning black hole with about 53 Solar Masses.

LIGO’s two facilities, located in Livingston, Louisiana, and Hanford, Washington. Credit: ligo.caltech.edu

What this means is that about three Solar Masses were converted into gravitational-wave energy during the merger, which was then detected by LIGO and Virgo. While impressive on its own, this latest detection is merely a taste of what gravitational wave detectors like the LIGO and Virgo collaborations can do now that they have entered their advanced stages, and into cooperation with each other.

Both Advanced LIGO and Advanced Virgo are second-generation gravitational-wave detectors that have taken over from previous ones. The LIGO facilities, which were conceived, built, and are operated by Caltech and MIT, collected data unsuccessfully between 2002 and 2010. However, as of September of 2015, Advanced LIGO went online and began conducting two observing runs – O1 and O2.

Meanwhile, the original Virgo detector conducted observations between 2003 and October of 2011, once again without success. By February of 2017, the integration of the Advanced Virgo detector began, and the instruments went online by the following April. In 2007, Virgo and LIGO also partnered to share and jointly analyze the data recorded by their respective detectors.

In August of 2017, the Virgo detector joined the O2 run, and the first-ever simultaneous detection took place on August 14th, with data being gathered by all three LIGO and Virgo instruments. As LSC spokesperson David Shoemaker – a researcher with the Massachusetts Institute of Technology (MIT) – indicated, this detection is just the first of many anticipated events.

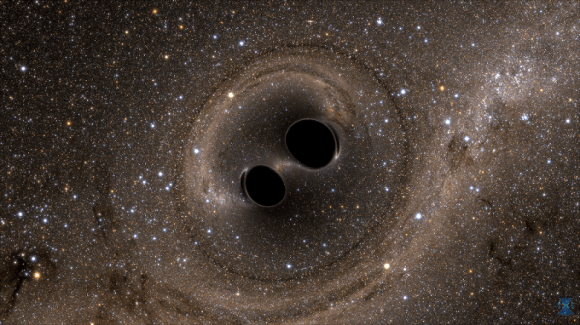
Artist’s impression of two merging black holes, which has been theorized to be a source of gravitational waves. Credit: Bohn, Throwe, Hébert, Henriksson, Bunandar, Taylor, Scheel/SXS

“This is just the beginning of observations with the network enabled by Virgo and LIGO working together,” he said. “With the next observing run planned for fall 2018, we can expect such detections weekly or even more often.”

Not only will this mean that scientists have a better shot of detecting future events, but they will also be able to pinpoint them with far greater accuracy. In fact, the transition from a two- to a three-detector network is expected to increase the likelihood of pinpointing the source of GW170814 by a factory of 20. The sky region for GW170814 is just 60 square degrees – more than 10 times smaller than with data from LIGO’s interferometers alone.

In addition, the accuracy with which the distance to the source is measured has also benefited from this partnership. As Laura Cadonati, a Georgia Tech professor and the deputy spokesperson of the LSC, explained:

“This increased precision will allow the entire astrophysical community to eventually make even more exciting discoveries, including multi-messenger observations. A smaller search area enables follow-up observations with telescopes and satellites for cosmic events that produce gravitational waves and emissions of light, such as the collision of neutron stars.”

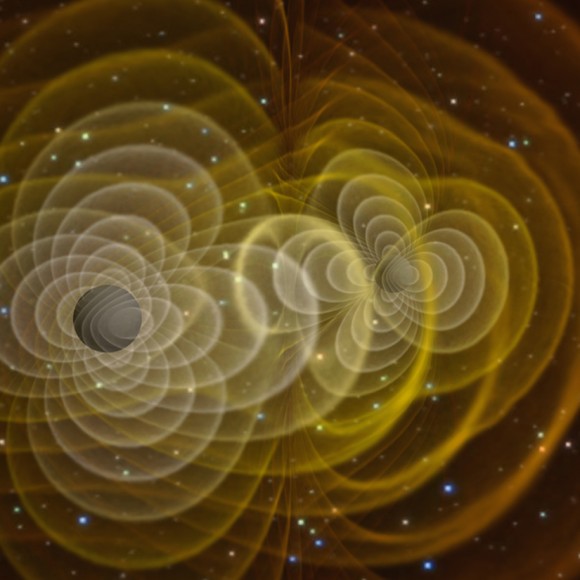
Artist’s impression of gravitational waves. Credit: NASA

In the end, bringing more detectors into the gravitational-wave network will also allow for more detailed test’s of Einstein’s theory of General Relativity. Caltech’s David H. Reitze, the executive director of the LIGO Laboratory, also praised the new partnership and what it will allow for.

“With this first joint detection by the Advanced LIGO and Virgo detectors, we have taken one step further into the gravitational-wave cosmos,” he said. “Virgo brings a powerful new capability to detect and better locate gravitational-wave sources, one that will undoubtedly lead to exciting and unanticipated results in the future.”

The study of gravitational waves is a testament to the growing capability of the world’s science teams and the science of interferometry. For decades, the existence of gravitational waves was merely a theory; and by the turn of the century, all attempts to detect them had yielded nothing. But in just the past eighteen months, multiple detections have been made, and dozens more are expected in the coming years.

What’s more, thanks to the new global network and the improved instruments and methods, these events are sure to tell us volumes about our Universe and the physics that govern it.

Further Reading: NSF, LIGO-Caltech, LIGO DD

New Study Says a Fast Radio Burst Happens Every Second in the Universe

An artist's impression of the cosmic web, the filamentary structure that fills the entire Universe. Credit: M. Weiss/CfA

When astronomers first noted the detection of a Fast Radio Burst (FRB) in 2007 (aka. the Lorimer Burst), they were both astounded and intrigued. This high-energy burst of radio pulses, which lasted only a few milliseconds, appeared to be coming from outside of our galaxy. Since that time, astronomers have found evidence of many FRBs in previously-recorded data, and are still speculating as to what causes them.

Thanks to subsequent discoveries and research, astronomers now know that FRBs are far more common than previously thought. In fact, according to a new study by a team of researchers from the Harvard-Smithsonian Center for Astrophysics (CfA), FRBs may occur once every second within the observable Universe. If true, FRBs could be a powerful tool for researching the origins and evolution of the cosmos.

The study, titled “A Fast Radio Burst Occurs Every Second throughout the Observable Universe“, recently appeared in The Astrophysical Journal Letters. The study was led by Anastasia Fialkov, a postdoc researcher and Fellow at the CfA’s Institute for Theory and Computation (ITC). She was joined by Professor Abraham Loeb, the director of the ITC and the Frank B. Baird, Jr. Professor of Science at Harvard.

As noted, FRBs have remained something of a mystery since they were first discovered. Not only do their causes remain unknown, but much about their true nature is still not understood. As Dr. Fialkov told Universe Today via email:

“FRBs (or fast radio bursts) are astrophysical signals of an undetermined nature. The observed bursts are short (or millisecond duration), bright pulses in the radio part of the electromagnetic spectrum (at GHz frequencies). Only 24 bursts have been observed so far and we still do not know for sure which physical processes trigger them. The most plausible explanation is that they are launched by rotating magnetized neutron stars. However, this theory is to be confirmed.”

For the sake of their study, Fialkov and Loeb relied on observations made by multiple telescopes of the repeating fast radio burst known as FRB 121102. This FRB was first observed in 2012 by researchers using the Arecibo radio telescope in Puerto Rico, and has since been confirmed to be coming from a galaxy located 3 billion light years away in the direction of the Auriga constellation.

Since it was discovered, additional bursts have been detected coming from its location, making FRB 121102 the only known example of a repeating FRB. This repetitive nature has also allowed astronomers to conduct more detailed studies of it than any other FRB. As Prof. Loeb told Universe Today via email, these and other reasons made it an ideal target for their study:

“FRB 121102 is the only FRB for which a host galaxy and a distance were identified. It is also the only repeating FRB source from which we detected hundreds of FRBs by now. The radio spectrum of its FRBs is centered on a characteristic frequency and not covering a very broad band. This has important implications for the detectability of such FRBs, because in order to find them the radio observatory needs to be tuned to their frequency.”

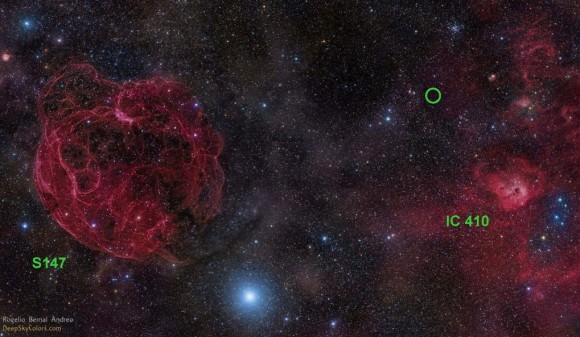
Image of the sky where the radio burst FRB 121102 was found, in the constellation Auriga. You can see its location with a green circle. At left is supernova remnant S147 and at right, a star formation area called IC 410. Credit: Rogelio Bernal Andreo (DeepSkyColors.com)

Based on what is known about FRB 121102, Fialkov and Loeb conducted a series of calculations that assumed that it’s behavior was representative of all FRBs. They then projected how many FRBs would exist across the entire sky and determined that within the observable Universe, a FRB would likely be taking place once every second. As Dr. Fialkov explained:

“Assuming that FRBs are produced by galaxies of a particular type (e.g., similar to FRB 121102) we can calculate how many FRBs have to be produced by each galaxy to explain the existing observations (i.e., 2000 per sky per day). With this number in mind we can infer the production rate for the entire population of galaxies. This calculation shows that an FRB occurs every second when accounting for all the faint events.”

While the exact nature and origins of FRBs are still unknown – suggestions include rotating neutron stars and even alien intelligence! – Fialkov and Loeb indicate that they could be used to study the structure and evolution of the Universe. If indeed they occur with such regular frequency throughout the cosmos, then more distant sources could act as probes which astronomers would then rely on to plumb the depths of space.

For instance, over vast cosmic distances, there is a significant amount of intervening material that makes it difficult for astronomers to study the Cosmic Microwave Background (CMB) – the leftover radiation from the Big Bang. Studies of this intervening material could lead to a new estimates of just how dense space is – i.e. how much of it is composed of ordinary matter, dark matter, and dark energy – and how rapidly it is expanding.

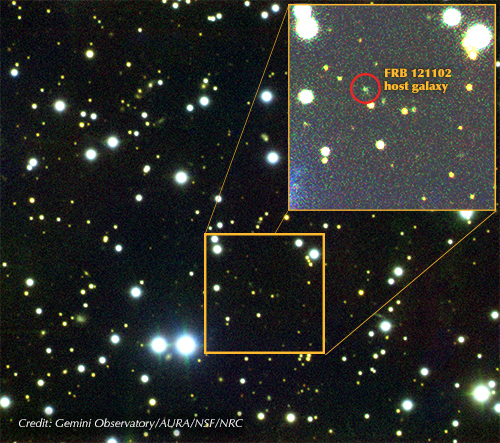
Gemini composite image of the field around FRB 121102, the only repeating FRB discovered so far. Credit: Gemini Observatory/AURA/NSF/NRC

And as Prof. Loeb indicated, FRBs could also be used to explore enduring cosmlogical questions, like how the “Dark Age” of the Universe ended:

“FRBs can be used to measure the column of free electrons towards their source. This can be used to measure the density of ordinary matter between galaxies in the present-day universe. In addition, FRBs at early cosmic times can be used to find out when the ultraviolet light from the first stars broke up the primordial atoms of hydrogen left over from the Big Bang into their constituent electrons and protons.”

The “Dark Age”, which occurred between 380,000 and 150 million years after the Big Bang, was characterized by a “fog” of hydrogen atoms interacting with photons. As a result of this, the radiation of this period is undetectable by our current instruments. At present, scientists are still attempting to resolve how the Universe made the transition between these “Dark Ages” and subsequent epochs when the Universe was filled with light.

This period of “reionization”, which took place 150 million to 1 billion years after the Big Bang, was when the first stars and quasars formed. It is generally believed that UV light from the first stars in the Universe traveled outwards to ionize the hydrogen gas (thus clearing the fog). A recent study also suggested that black holes that existed in the early Universe created the necessary “winds” that allowed this ionizing radiation to escape.

To this end, FRBs could be used to probe into this early period of the Universe and determine what broke down this “fog” and allowed light to escape. Studying very distant FRBs could allow scientists to study where, when and how this process of “reionization” occurred. Looking ahead, Fialkov and Loeb explained how future radio telescopes will be able to discover many FRBs.

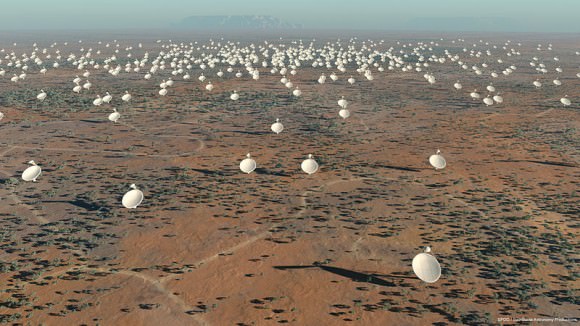
The planned Square Kilometer Array will be the world’s largest radio telescope when it begins operations in 2018. Credit: SKA

“Future radio observatories, like the Square Kilometer Array, will be sensitive enough to detect FRBs from the first generation of galaxies at the edge of the observable universe,” said Prof. Loeb. “Our work provides the first estimate of the number and properties of the first flashes of radio waves that lit up in the infant universe.”

And then there’s the Canadian Hydrogen Intensity Mapping Experiment (CHIME) at the at the Dominion Radio Astrophysical Observatory in British Columbia, which recently began operating. These and other instruments will serve as powerful tools for detecting FRBs, which in turn could be used to view previously unseen regions of time and space, and unlock some of the deepest cosmological mysteries.

“[W]e find that a next generation telescope (with a much better sensitivity than the existing ones) is expected to see many more FRBs than what is observed today,” said Dr. Fialkov. “This would allow to characterize the population of FRBs and identify their origin. Understanding the nature of FRBs will be a major breakthrough. Once the properties of these sources are known, FRBs can be used as cosmic beacons to explore the Universe. One application is to study the history of reionization (cosmic phase transition when the inter-galactic gas was ionized by stars).”

It is an inspired thought, using natural cosmic phenomena as research tools. In that respect, using FRBs to probe the most distant objects in space (and as far back in time as we can) is kind of like using quasars as navigational beacons. In the end, advancing our knowledge of the Universe allows us to explore more of it.

Further Reading: CfA, Astrophysical Journal Letters

Researchers Tackle Question of How the Universe Became Filled With Light

A billion years after the big bang, hydrogen atoms were mysteriously torn apart into a soup of ions. Credit: NASA/ESA/A. Felid (STScI)).

In accordance with the Big Bang model of cosmology, shortly after the Universe came into being there was a period known as the “Dark Ages”. This occurred between 380,000 and 150 million years after the Big Bang, where most of the photons in the Universe were interacting with electrons and protons. As a result, the radiation of this period is undetectable by our current instruments – hence the name.

Astrophysicists and cosmologists have therefore been pondering how the Universe could go from being in this dark, cloudy state to one where it was filled with light. According to a new study by a team of researchers from the University of Iowa and the Harvard-Smithsonian Center for Astrophysics, it may be that black holes violently ejected matter from the early Universe, thus allowing light to escape.

Their study, titled “Resolving the X-ray emission from the Lyman continuum emitting galaxy Tol 1247-232“, recently appeared in the Monthly Notices of the Royal Astronomical Society. Led by Phillip Kaaret, a professor of Physics and Astronomy at the University of Iowa – and supported by an award from the Chandra X-ray Observatory – the research team arrived at this conclusion by observing a nearby galaxy from which ultraviolet light is escaping.

Milestones in the history of the Universe, from the Big Bang to the present day. Credit: NAOJ/NOAO

This galaxy, known as Tol 1247-232, is a small (and possibly elliptical) galaxy located 652 million light-years away, in the direction of the southern Hydra constellation. This galaxy is one of just nine in the local Universe (and one of only three galaxies close to the Milky Way) that has been shown to emit Lyman continuum photons – a type of radiation in the ultraviolet band.

Back in May of 2016, the team spotted a single X-ray source coming from a star-forming region in this galaxy, using the Chandra X-ray observatory. Based on their observations, they determined that it was not caused by the formation of a new star. For one, new stars do not experience sudden changes in brightness, as this x-ray source did. In addition, the radiation emitted by new stars does not come in the form of a point-like source.

Instead, they determined that what they were seeing had to be the result of a very small object, which left only one likely explanation: a black hole. As Philip Kaaret, a professor in the UI Department of Physics and Astronomy and the lead author on the study, explained:

“The observations show the presence of very bright X-ray sources that are likely accreting black holes. It’s possible the black hole is creating winds that help the ionizing radiation from the stars escape. Thus, black holes may have helped make the universe transparent.”

Where is the Nearest Black Hole
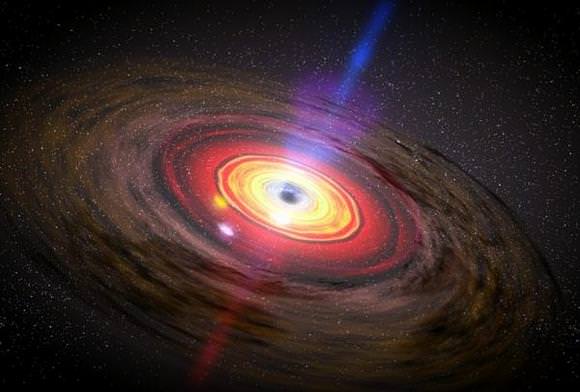
Artist concept of matter swirling around a black hole. Credit: NASA/Dana Berry/SkyWorks Digital

However, this also raised the question of how a black hole could be emitting matter. This is something that astrophysicists have puzzled over for quite some time. Whereas all black holes have tendency to consume all that is in their path, a small number of supermassive black holes (SMBHs) have been found to have high-speed jets of charged particles streaming from their cores.

These SMBHs are what power Active Galactic Nuclei, which are compact, bright regions that has been observed at the centers of particularly massive galaxies. At present, no one is certain how these SMBHs manage to fire off jets of hot matter. But it has been theorized that they could be caused by the accelerated rotational energy of the black holes themselves.

In keeping with this, the team considered the possibility that accreting X-ray sources could explain the escape of matter from a black hole. In other words, as a black hole’s intense gravity pulls matter inward, the black hole responds by spinning faster. As the hole’s gravitational pull increases, the speed creates energy, which inevitably causes charged particles to be pushed out. As Kaaret explained:

“As matter falls into a black hole, it starts to spin and the rapid rotation pushes some fraction of the matter out. They’re producing these strong winds that could be opening an escape route for ultraviolet light. That could be what happened with the early galaxies.”

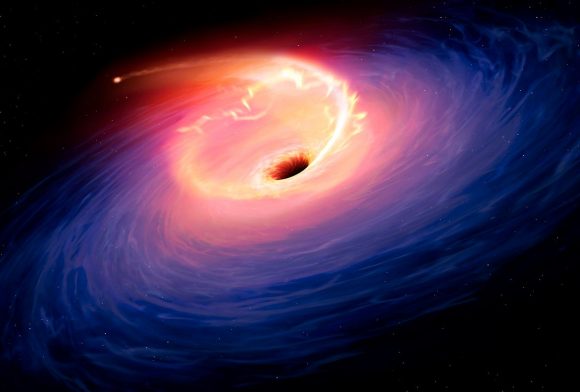
Depiction of the tidal disruption event in F01004-2237. The release of gravitational energy as the debris of the star is accreted by the black hole leads to a flare in the optical light of the galaxy. Credit and copyright: Mark Garlick

Taking this a step further, the team hypothesized that this could be what was responsible for light escaping the “Dark Ages”. Much like the jets of hot material being emitted by SMBHs today, similarly massive black holes in the early Universe could have sped up due to the accretion of matter, spewing out light from the cloudiness and allowing for the Universe to become a clear, bright place.

In the future, the UI team plans to study Tol 1247-232 in more detail and locate other nearby galaxies that are also emitting ultraviolet light. This will corroborate their theory that black holes could be responsible for the observed point source of high-energy X-rays. Combined with studies of the earliest periods of the Universe, it could also validate the theory that the “Dark Ages” ended thanks to the presence of black holes.

Further Reading: Iowa Now, Monthly Notices of the Royal Astronomical Society

The Most Distant Massive Galaxy Observed to Date Provides Insight into the Early Universe

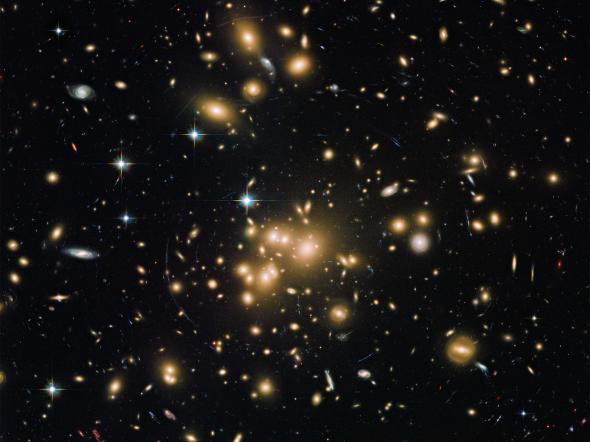
A Hubble image of the galaxy cluster Abell 1689, which acts as a lens to focus the light from much more distant galaxies, including some very dusty star-forming galaxies in the early universe (seen as the nearly point-like blue smudges in this image). Credit: NASA-Hubble

In their pursuit of learning how our Universe came to be, scientists have probed very deep into space (and hence, very far back in time). Ultimately, their goal is to determine when the first galaxies in our Universe formed and what effect they had on cosmic evolution. Recent efforts to locate these earliest formations have probed to distances of up to 13 billion light-years from Earth – i.e. about 1 billion years after the Big Bang.

From this, scientist are now able to study how early galaxies affected matter around them – in particular, the reionization of neutral atoms. Unfortunately, most early galaxies are very faint, which makes studying their interiors difficult. But thanks to a recent survey conducted by an international team of astronomers, a more luminous, massive galaxy was spotted that could provide a clear look at how early galaxies led to reionization.

The study which details their findings, titled “ISM Properties of a Massive Dusty Star-forming Galaxy Discovered at z ~ 7“, was recently published in The Astrophysical Journal Letters. Led by researchers from the Max Planck Institute for Radio Astronomy  in Bonn, Germany, the team relied on data from the South Pole Telescope (SPT)-SZ survey and ALMA to spot a galaxy that existed 13 billion years ago (just 800 million years after the Big Bang).

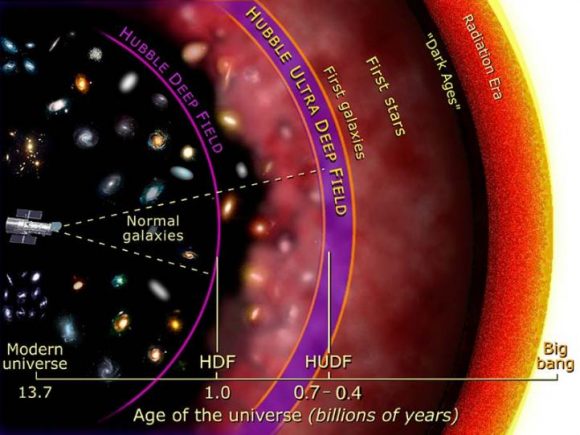
Illustration of the depth by which Hubble imaged galaxies in prior Deep Field initiatives, in units of the Age of the Universe. Credit: NASA and A. Feild (STScI)

In accordance with Big Bang model of cosmology, reionization refers to the process that took place after the period known as the “Dark Ages”. This occurred between 380,000 and 150 million years after the Big Bang, where most of the photons in the Universe were interacting with electrons and protons. As a result, the radiation of this period is undetectable by our current instruments – hence the name.

Just prior to this period, the “Recombination” occurred, where hydrogen and helium atoms began to form. Initially ionized (with no electrons bound to their nuclei) these molecules gradually captured ions as the Universe cooled, becoming neutral. During the period that followed – i.e. between 150 million to 1 billion years after the Big Bang – the large-scale structure of the Universe began to form.

Intrinsic to this was the process of reionization, where the first stars and quasars formed and their radiation reionized the surrounding Universe. It is therefore clear why astronomers want to probe this era of the Universe. By observing the first stars and galaxies, and what effect they had on the cosmos, astronomers will get a clearer picture of how this early period led to the Universe as we know it today.

Luckily for the research team, the massive, star-forming galaxies of this period are known to contain a great deal of dust. While very faint in the optical band, these galaxies emit strong radiation at submillimeter wavelengths, which makes them detectable using today’s advanced telescopes – including the South Pole Telescope (SPT), the Atacama Pathfinder Experiment (APEX), and Atacama Large Millimeter Array (ALMA).

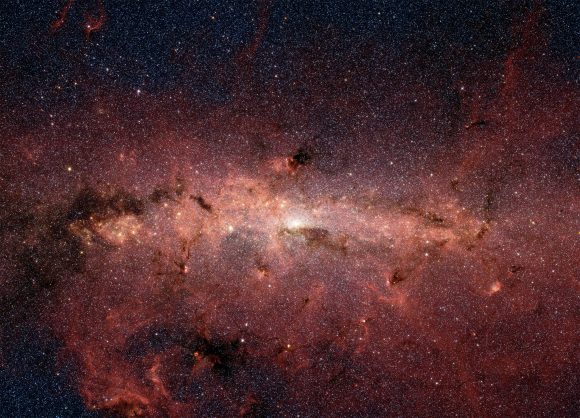
NASA’s Spitzer Space Telescope captured this stunning infrared image of the center of the Milky Way Galaxy, where the black hole Sagitarrius A resides. Image: NASA/JPL-Caltech

For the sake of their study, Strandet and Weiss relied on data from the SPT to detect a series of dusty galaxies from the early Universe. As Maria Strandet and Axel Weiss of the Max Planck Institute for Radio Astronomy (and the lead author and co-authors on the study, respectively) told Universe Today via email:

“We have used light of about 1 mm wavelength, which can be observed by mm telescopes like SPT, APEX or ALMA. At this wavelength the photons are produced by the thermal radiation of dust. The beauty of using this long wavelength is, that for a large redshift range (look back time), the dimming of galaxies [caused] by increasing distance is compensated by the redshift – so the observed intensity is independent of the redshift. This is because, for higher redshift galaxies, one is looking at intrinsically shorter wavelengths (by (1+z)) where the radiation is stronger for a thermal spectrum like the dust spectrum.”

This was followed by data from ALMA, which the team used to determine the distance of the galaxies by looking at the redshifted wavelength of carbon monoxide molecules in their interstellar mediums (ISM). From all the data they collected, they were able to constrain the properties of one of these galaxies – SPT0311-58 – by observing its spectral lines. In so doing, they determined that this galaxy existed just 760 million years after the Big Bang.

“Since the signal strength at 1mm is independent of the redshift (look back time), we do not have an a priori clue if an object is relatively near (in the cosmological sense) or at the epoch of reionization,” they said. “That is why we undertook a large survey to determine the redshifts via the emission of molecular lines using ALMA. SPT0311-58 turns out to be the highest redshift object discovered in this survey and in fact the most distant massive dusty star-forming galaxy so far discovered.”

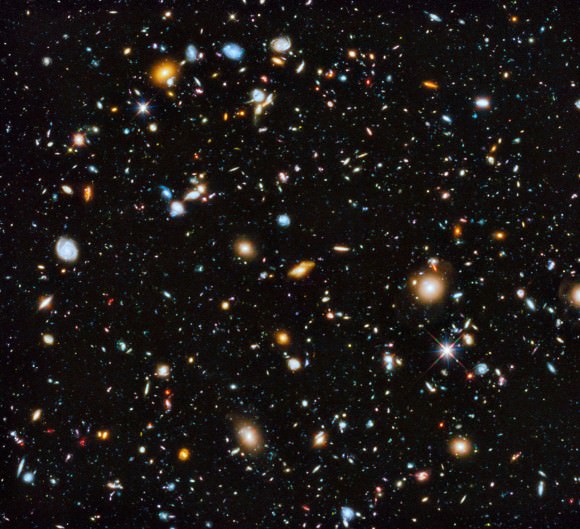
The Hubble Ultra Deep Field seen in ultraviolet, visible, and infrared light. Image Credit: NASA, ESA, H. Teplitz and M. Rafelski (IPAC/Caltech), A. Koekemoer (STScI), R. Windhorst (Arizona State University), and Z. Levay (STScI)

From their observations, they also determined that SPT0311-58 has a mass of about 330 billion Solar-masses, which is about 66 times as much as the Milky Way Galaxy (which has about 5 billion Solar-masses). They also estimated that it is forming new stars at a rate of several thousand per year, which could as be the case for neighboring galaxies that are dated to this period.

This rare and distant object is one of the best candidates yet for studying what the early Universe looked like and how it has evolved since. This in turn will allow astronomers and cosmologists to test the theoretical basis for the Big Bang Theory. As Strandet and Weiss told Universe Today about their discovery:

“These objects are important to understanding the evolution of galaxies as a whole since the large amounts of dust already present in this source, only 760 million years after the Big Bang, means that it is an extremely massive object. The mere fact that such massive galaxies already existed when the Universe was still so young puts strong constraints on our understanding of galaxy mass buildup. Furthermore the dust needs to form in a very short time, which gives additional insights on the dust production from the first stellar population.”

The ability to look deeper into space, and farther back in time, has led to many surprising discoveries of late. And these have in turn challenged some of our assumptions about what happened in the Universe, and when. And in the end, they are helping scientists to create a more detailed and complete account of cosmic evolution. Someday soon, we might even be able to probe the earliest moments in the Universe, and watch creation in action!

Further Reading: CfA, The Astrophysical Journal Letters


This is the One of the Largest Structures We Know of in the Universe

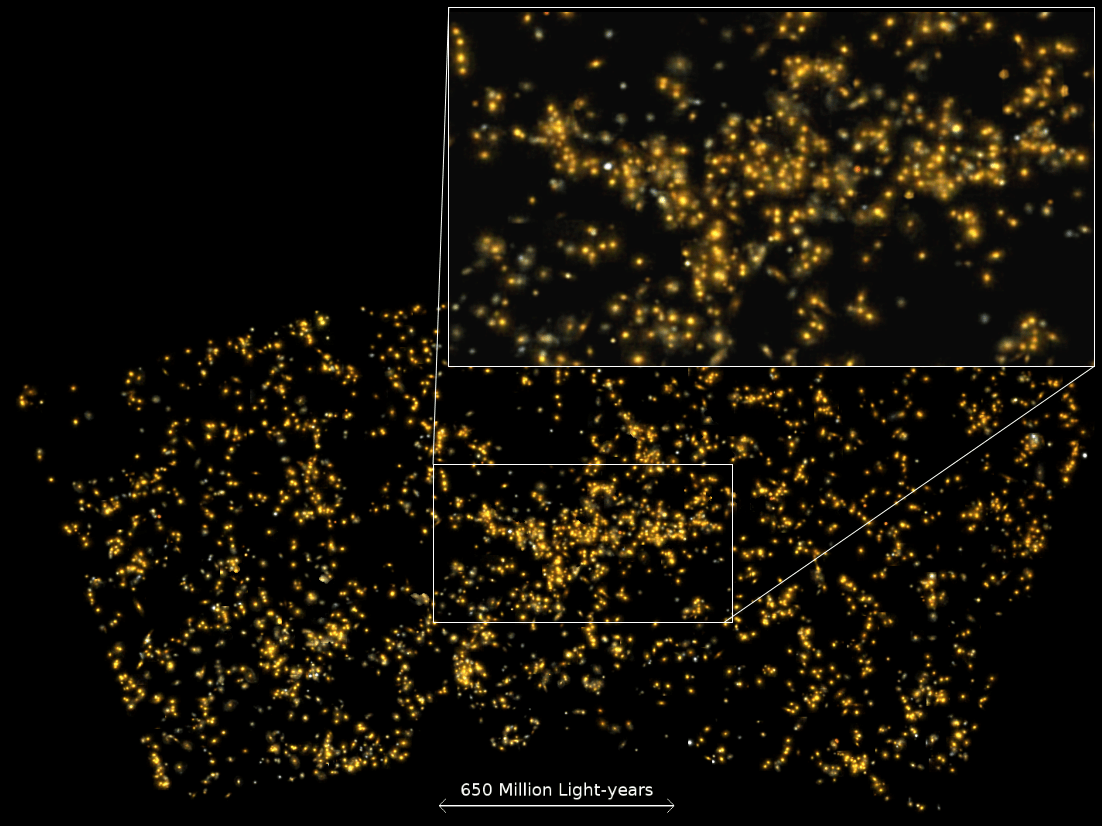
Enlarged region of the Saraswati Supercluster, the largest known structure in the Universe, showing the distribution of galaxies. Credit: IUCAA

The Milky Way Galaxy, which measures 100,000 to 180,000 light years (31 – 55 kiloparsecs) in diameter and contains 100 to 400 billion stars, is so immense that it boggles the mind. And yet, when it comes to the large-scale structure of the Universe, our galaxy is merely a drop in the bucket. Looking farther, astronomers have noted that galaxies form clusters, which in turn form superclusters – the largest known structures in the Universe.

The supercluster in which our galaxy resides is known as the Laniakea Supercluster, which spans 500 million light-years. But thanks to a new study by a team of Indian astronomers, a new supercluster has just been identified that puts all previously known ones to shame. Known as Saraswati, this supercluster is over 650 million light years (200 megaparsecs) in diameter, making it one the largest large-scale structures in the known Universe.

The study, which recently appeared in The Astrophysical Journal under the title “Saraswati: An Extremely Massive ~ 200 Megaparsec Scale Supercluster, was conducted by astronomers from the Inter University Center for Astronomy & Astrophysics (IUCAA) and the Indian Institute of Science Education and Research (IISER), with assistance provided by a number of Indian universities.

The distribution of galaxies, from Sloan Digital Sky Survey (SDSS), in Saraswati supercluster. Credit: IUCAA

For the sake of their study, the team relied on data obtained by the Sloan Digital Sky Survey (SDSS) to examine the large-scale structure of the Universe. In the past, astronomers have found that the cosmos is hierarchically assembled, with galaxies being arranged in clusters, superclusters, sheets, walls and filaments. These are separated by immense cosmic voids, which together create the vast “Cosmic Web” structure of the Universe.

Superclusters, which are the largest coherent structures in the Cosmic Web, are basically chains of galaxies and galaxy clusters that can extend for hundreds of millions of light years and contain trillions of stars. In the end, the team found a supercluster located about 4 billion (1226 megaparsecs) light-years from Earth – in the constellation Pisces – that is 600 million light-years wide and may contain the mass equivalent of over 20 million billion suns.

They gave this supercluster the name “Saraswati”, the name of an ancient river that played an important role in the emergence of Indian civilization. Saraswait is also the name of a goddess that is worshipped in India today as the keeper of celestial rivers and the goddess of knowledge, music, art, wisdom and nature. This find was particularly surprising, seeing as how Saraswati was older than expected.

Essentially, the supercluster appeared in the SDSS data as it would have when the Universe was roughly 10 billion years old. So not only is Saraswati one of the largest superclusters discovered to date, but its existence raises some serious questions about our current cosmological models. Basically, the predominant model for cosmic evolution does not predict that such a superstructure could exist when the Universe was 10 billion years old.

Diagram of the Lambda-CDM model, which shows cosmic evolution from the Big Bang/Inflation Era and the subsequent expansion of the universe.  Credit: Alex Mittelmann.

Known as the “Cold Dark Matter” model, this theory predicts that small structures (i.e. galaxies) formed first in the Universe and then congregated into larger structures. While variations within this model exist, none predict that something as large as Saraswati could have existed 4 billion years ago. Because of this, the discovery may require astronomers to rethink their theories of how the Universe became what it is today.

To put it simply, the Saraswati supercluster formed at a time when Dark Energy began to dominate structure formation, replacing gravitation as the main force shaping cosmic evolution. As Joydeep Bagchi, a researcher from IUCAA and the lead author of the paper, and co-author Shishir Sankhyayan (of IISER) explained in a IUCAA press release:

‘’We were very surprised to spot this giant wall-like supercluster of galaxies… This supercluster is clearly embedded in a large network of cosmic filaments traced by clusters and large voids. Previously only a few comparatively large superclusters have been reported, for example the ‘Shapley Concentration’ or the ‘Sloan Great Wall’ in the nearby universe, while the ‘Saraswati’ supercluster is far more distant one. Our work will help to shed light on the perplexing question; how such extreme large scale, prominent matter-density enhancements had formed billions of years in the past when the mysterious Dark Energy had just started to dominate structure formation.’’

As such, the discovery of this most-massive of superclusters may shed light on how and when Dark Energy played an important role in supercluster formation. It also opens the door to other cosmological theories that are in competition with the CDM model, which may offer more consistent explanations as to why Saraswati could exist 10 billion years after the Big Bang.

One thing is clear thought: this discovery represents an exciting opportunity for new research into cosmic formation and evolution. And with the aid of new instruments and observational facilities, astronomers will be able to look at Saraswait and other superclusters more closely in the coming years and study just how they effect their cosmic environment.

Further Reading: IUCAA, The Astrophysical Journal