Rare Rectangle Galaxy Discovered

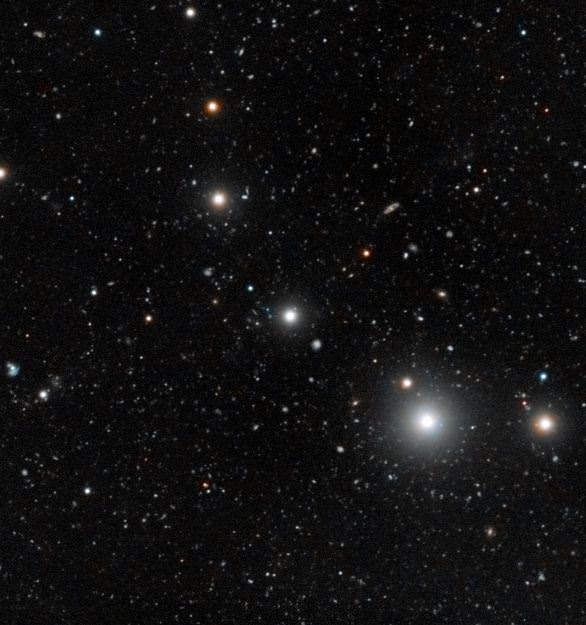
LEDA 074886: a dwarf galaxy with a curious rectangular shape

[/caption]

It’s being called the “emerald-cut galaxy” — recently discovered by an international team of astronomers with the Swinburne University of Technology in Australia, LEDA 074886 is a dwarf galaxy located 70 million light-years (21 Mpc) away, within a group of about 250 other galaxies.

“It’s an exciting find,” Dr. Alister Graham, lead author and associate professor at Swinburne University Center for Astrophysics and Supercomputing told Universe Today in an email. “I’ve seen thousands of galaxies, and they don’t look like this one.”

The gem-cut galaxy was detected in a wide-field image taken with the Japanese Subaru Telescope by astrophysicist Dr. Lee Spitler.

It’s thought that the unusual shape is the result of a collision between two galaxies, possibly two former satellite galaxies of the larger NGC 1407, the brightest of all the approximately 250 galaxies within its local group.

“At first we thought that there was probably some gravitational-tidal interaction which has caused LEDA 074886 to have its unusual shape, but now we’re not so sure, as its features better match that of two colliding disk galaxies,” Dr. Graham said.

In addition to being oddly angular, LEDA 074886 also features a stellar disk inside it, aligned edge-on to our line of sight. This disk of stars is rotating at speeds of up to 33 km/second, although it can’t be discerned if it has a spiral structure or not  because of our position relative to it.

False-color image of LEDA 074886 taken with Subaru Telescope's Suprime-Cam. Contrast enhanced to show central disk structure. (Graham et al.)

 “It’s one of those things that just makes you smile because it shouldn’t exist, or rather you don’t expect it to exist.”

– Dr. Alister Graham, Associate Professor, Swinburne University of Technology

Although rectangular galaxies are rare, we may eventually become part of one ourselves.

“Curiously,” Dr. Graham said, “if the orientation was just right, when our own disc-shaped galaxy collides with the disc-shaped Andromeda galaxy about three billion years from now we may find ourselves the inhabitants of a square-looking galaxy.”

(Let’s hope that it’s still “hip to be square” in another 3 billion years!)

The team’s paper will be published in The Astrophysical Journal. Read more on the Swinburne University press release here or on the Subaru Telescope site.

Image credit: Swinburne University of Technology

Hubble Spots Mysterious Dark Matter ‘Core’

This composite image shows the distribution of dark matter, galaxies, and hot gas in the core of the merging galaxy cluster Abell 520, formed from a violent collision of massive galaxy clusters. Image Credit: NASA, ESA, CFHT, CXO, M.J. Jee (University of California, Davis), and A. Mahdavi (San Francisco State University)

[/caption]Astronomers are left scratching their heads over a new observation of a “clump” of dark matter apparently left behind after a massive merger between galaxy clusters. What is so puzzling about the discovery is that the dark matter collected into a “dark core” which held far fewer galaxies than expected. The implications of this discovery present challenges to current understandings of how dark matter influences galaxies and galaxy clusters.

Initially, the observations made in 2007 were dismissed as bad data. New data obtained by the Hubble Space Telescope in 2008 confirmed the previous observations of dark matter and galaxies parting ways. The new evidence is based on observations of a distant merging galaxy cluster named Abell 520. At this point, astronomers have a challenge ahead of them in order to explain why dark matter isn’t behaving as expected.

“This result is a puzzle,” said astronomer James Jee (University of California, Davis). “Dark matter is not behaving as predicted, and it’s not obviously clear what is going on. Theories of galaxy formation and dark matter must explain what we are seeing.”

Current theories on dark matter state that it may be a kind of gravitational “glue” that holds galaxies together. One of the other interesting properties of dark matter is that by all accounts, it’s not made of same stuff as people and planets, yet interacts “gravitationally” with normal matter. Current methods to study dark matter are to analyze galactic mergers, since galaxies will interact differently than their dark matter halos. The current theories are supported by visual observations of galaxy mergers in the Bullet Cluster, and have become a classic example of our current understanding of dark matter.

Studies of Abell 520 are causing astronomers to think twice about our current understanding of dark matter. Initial observations found dark matter and hot gas, but lacked luminous galaxies – which are normally detected in the same regions as dark matter concentrations. Attempting to make sense of the observations, the astronomers used Hubble’s Wide Field Planetary Camera 2 to map dark matter in the cluster using a gravitational lensing technique.

“Observations like those of Abell 520 are humbling in the sense that in spite of all the leaps and bounds in our understanding, every now and then, we are stopped cold,” said Arif Babul (University of Victoria, British Columbia).

Jee added, “We know of maybe six examples of high-speed galaxy cluster collisions where the dark matter has been mapped, but the Bullet Cluster and Abell 520 are the two that show the clearest evidence of recent mergers, and they are inconsistent with each other. No single theory explains the different behavior of dark matter in those two collisions. We need more examples.”

The team has worked on numerous possibilities for their findings, each with their own set of unanswered questions. One such possibility is that Abell 520 was a more complicated merger than the Bullet Cluster encounter. There may have been several galaxies merging in Abell 520 instead of the two responsible for the Bullet Cluster. Another possibility is that like well-cooked rice, dark matter may be sticky. When particles of ordinary matter collide, they lose energy and, as a result, slow down. It may be possible for some dark matter to interact with itself and remain behind after a collision between two galaxies.

Another possibility may be that there were more galaxies in the core, but were too dim for Hubble to detect. Being dimmer, the galaxies would have formed far fewer stars than other types of galaxies. The team plans to use their Hubble data to create computer simulations of the collision, in the hopes of obtaining vital clues in the efforts to better understand the unusual behavior of dark matter.

If you’d like to learn more about the Hubble Space Telescope, visit: http://www.nasa.gov/hubble

Journal Club – Theory constraint

Today's Journal Club is about a new addition to the Standard Model of fundamental particles.

[/caption]

According to Wikipedia, a journal club is a group of individuals who meet regularly to critically evaluate recent articles in the scientific literature. And of course, the first rule of Journal Club is… don’t talk about Journal Club.

So, without further ado – today’s journal article is about how new data are limiting the theoretical options available to explain the observed accelerating expansion of the universe.

Today’s article:
Zhang et al Testing modified gravity models with recent cosmological observations..

Theorists can develop some pretty ‘out there’ ideas when using limited data sets. But with the advent of new technologies, or new ways to measure things, or even new things to measure – new data becomes available that then constrains the capacity of various theories to explain what we have measured.

Mind you, when new data conflicts with theory, the first question should always be whether the theory is wrong or the data is wrong – and it may take some time to decide which. A case in point is the Gran Sasso faster-than-light neutrino data. This finding conflicts with a range of well established theories which explain a mountain of other data very well. But to confirm that the neutrino data are wrong, we will need to reproduce the test – perhaps with different equipment under different conditions. This might establish an appropriate level of confidence that the data are really wrong – or otherwise that we need to revise the entire theoretical framework of modern physics.

Zhang et al seek to replicate this sort of evidence-based thinking using Bayesian and also Akaike statistics to test whether the latest available data on the expansion of the universe alters the likelihood of existing theories being able to explain that expansion.

These latest available data include:

  • the SNLS3 SN1a data set (of 472 Type 1a supernovae);
  • the Wilkinson Microwave Anisotropy Probe (WMAP) 7 year observations;
  • Baryonic acoustic oscillation results for the Sloan Digital Sky Survey release 7; and
  • the latest Hubble constant measures from the Wide Field Camera 3 on the Hubble Space telescope.

The authors run a type of chi-squared analysis to see how the standard Lambda Cold Dark Matter (CDM) model and a total of five different modified gravity (MG models) fit against both the earlier data and now this latest data. Or in their words ‘we constrain the parameter space of these MG models and compare them with the Lambda CDM model’.

It turns out that the latest data best fit the Lambda CDM model, fit less well with most MG models and at least one of the MG models is ‘strongly disfavored’.

They caveat their findings by noting that this analysis only indicates how things stand currently and yet more new data may change the picture again.

And not surprisingly, the paper concludes by determining that what we really need is more new data. Amen to that.

So… comments? Are Bayesian statistics just a fad or a genuinely smarter way to test a hypothesis? Are the first two paragraphs of the paper’s introduction confusing – since Lambda is traditionally placed on ‘the left side of the Einstein equation’? Does anyone feel constrained to suggest an article for the next edition of Journal Club?

Emerging Supermassive Black Holes Choke Star Formation

The LABOCA camera on the ESO-operated 12-metre Atacama Pathfinder Experiment (APEX) telescope reveals distant galaxies undergoing the most intense type of star formation activity known, called a starburst. This image shows these distant galaxies, found in a region of sky known as the Extended Chandra Deep Field South, in the constellation of Fornax (The Furnace). The galaxies seen by LABOCA are shown in red, overlaid on an infrared view of the region as seen by the IRAC camera on the Spitzer Space Telescope. Credit: ESO, APEX (MPIfR/ESO/OSO), A. Weiss et al., NASA Spitzer Science Center

[/caption]

Located on the Chajnantor plateau in the foothills of the Chilean Andes, ESO’s APEX telescope has been busy looking into deep, deep space. Recently a group of astronomers released their findings regarding massive galaxies in connection with extreme times of star formation in the early Universe. What they found was a sharp cut-off point in stellar creation, leaving “massive – but passive – galaxies” filled with mature stars. What could cause such a scenario? Try the materialization of a supermassive black hole…

By integrating data taken with the LABOCA camera on the ESO-operated 12-metre Atacama Pathfinder Experiment (APEX) telescope with measurements made with ESO’s Very Large Telescope, NASA’s Spitzer Space Telescope and other facilities, astronomers were able to observe the relationship of bright, distant galaxies where they form into clusters. They found that the density of the population plays a major role – the tighter the grouping, the more massive the dark matter halo. These findings are the considered the most accurate made so far for this galaxy type.

Located about 10 billion light years away, these submillimetre galaxies were once home to starburst events – a time of intense formation. By obtaining estimations of dark matter halos and combining that information with computer modeling, scientists are able to hypothesize how the halos expanding with time. Eventually these once active galaxies settled down to form giant ellipticals – the most massive type known.

“This is the first time that we’ve been able to show this clear link between the most energetic starbursting galaxies in the early Universe, and the most massive galaxies in the present day,” says team leader Ryan Hickox of Dartmouth College, USA and Durham University, UK.

However, that’s not all the new observations have uncovered. Right now there’s speculation the starburst activity may have only lasted around 100 million years. While this is a very short period of cosmological time, this massive galactic function was once capable of producing double the amount of stars. Why it should end so suddenly is a puzzle that astronomers are eager to understand.

“We know that massive elliptical galaxies stopped producing stars rather suddenly a long time ago, and are now passive. And scientists are wondering what could possibly be powerful enough to shut down an entire galaxy’s starburst,” says team member Julie Wardlow of the University of California at Irvine, USA and Durham University, UK.

Right now the team’s findings are offering up a new solution. Perhaps at one point in cosmic history, starburst galaxies may have clustered together similar to quasars… locating themselves in the same dark matter halos. As one of the most kinetic forces in our Universe, quasars release intense radiation which is reasoned to be fostered by central black holes. This new evidence suggests intense starburst activity also empowers the quasar by supplying copious amounts of material to the black hole. In response, the quasar then releases a surge of energy which could eradicate the galaxy’s leftover gases. Without this elemental fuel, stars can no longer form and the galaxy growth comes to a halt.

“In short, the galaxies’ glory days of intense star formation also doom them by feeding the giant black hole at their centre, which then rapidly blows away or destroys the star-forming clouds,” explains team member David Alexander from Durham University, UK.

Original Story Source: European Southern Observatory News. For Further Reading: Research Paper Link.

Planck Spacecraft Loses Its Cool(ant) But Keeps Going

Artist's impression of the Planck spacecraft. Credit: ESA

[/caption]

After two and a half years of observing the Cosmic Microwave Background, the ESA Planck spacecraft’s High Frequency Instrument ran out of its on-board coolant gases over this past weekend, reaching the end of its very successful mission. But that doesn’t mean the end for Planck observations. The Low Frequency Instrument, which does not need to be super-cold (but is still at a bone-chilling -255 C), will continue taking data.

“The Low Frequency Instrument will now continue operating for another year,” said Richard Davis, of the University of Manchester in the UK. “During that time it will provide unprecedented sensitivity at the lower frequencies.”

From its location at the Earth/Sun’s L2 Lagrangian point, Planck was designed to ‘see’ the microwaves from the CMB and detects them by measuring temperature. The expansion of the Universe means that the CMB is brightest when seen in microwave light, with wavelengths between 100 and 10,000 times longer than visible light. To measure such long wavelengths Planck’s detectors have to be cooled to very low temperatures. The colder the spacecraft, the lower the temperatures the spacecraft can detect.

The High Frequency Instrument (HFI) was cooled to as close to 2.7K (about –270°C, near absolute zero) as possible.

Planck worked perfectly for 30 months, about twice the span originally required, and completed five full-sky surveys with both instruments.

“Planck has been a wonderful mission; spacecraft and instruments have been performing outstandingly well, creating a treasure trove of scientific data for us to work with,” said Jan Tauber, ESA’s Planck Project Scientist.

While it was the combination of both instruments that made Planck so powerful, there is still work for the LFI to do.

Now and Then. This single all-sky image simultaneously captured two snapshots that straddle virtually the entire 13.7 billion year history of the universe. One of them is ‘now’ – our galaxy and its structures seen as they are over the most recent tens of thousands of years (the thin strip extending across the image is the edge-on plane of our galaxy – the Milky Way). The other is ‘then’ – the red afterglow of the Big Bang seen as it was just 380,000 years after the Big Bang (top and bottom of image). The time between these two snapshots therefore covers about 99.997% of the 13.7 billion year age of the universe. The image was obtained by the Planck spacecraft. Credit: ESA

The scientists involved in Planck have been busy understanding and analyzing the data since Planck launched in May 2009. Initial results from Planck were announced last year, and with Planck data, scientists have created a map of the CMB identifying which bits of the map are showing light from the early Universe, and which parts are due to much closer objects, such as gas and dust in our galaxy, or light from other galaxies. The scientists have also produced a catalog of galaxy clusters in the distant Universe — many of which had not been seen before — and included some gigantic ‘superclusters,’ which are probably merging clusters.

The scientists expect to release data about star formation later next month, and reveal cosmological findings from the Big Bang and the very early Universe in 2013.

“The fact that Planck has worked so perfectly means that we have an incredible amount of data,” said George Efstathiou, a Planck Survey Scientist from the University of Cambridge. “Analyzing it takes very high-performance computers, sophisticated software, and several years of careful study to ensure that the results are correct.”

Source: ESA, UK Space Agency

Wandering Stars Shed Light on Milky Way’s Past

Measurements of the metal content of stars in the disk of our galaxy. The bottom panel shows the decrease in metal content as the distance from the galactic center increases for stars near the plane of the Milky Way disk. In contrast, the metal content for stars far above the plane, shown in the upper panel, is nearly constant at all distances from the center of the Galaxy. Image Credit: Judy Cheng and Connie Rockosi (UCSC) and the 2MASS Survey.

[/caption]Like a worldly backpacker, many stars in the Milky Way Galaxy have made interesting journeys, and have interesting stories to tell about their past. For over a decade, the Sloan Digital Sky Survey (SDSS) has been mapping stars in our Galaxy.

This week at the American Astronomical Society meeting in Austin, Texas, astronomers from University of California – Santa Cruz presented new evidence that claims to answer many questions about stars located in the disk of our galaxy. The team’s results are based on data from the Sloan Extension for Galactic Understanding and Exploration 2 (SEGUE-2).

The SEGUE-2 data is comprised of the motions and chemical compositions of over 118,000 stars, most of which are in the disk of our galaxy, but a few stars in the survey take the “scenic” route in their orbit.

“Some disk stars have orbits that take them far above and below the plane of the Milky Way,” said Connie Rockosi (University of California – Santa Cruz), “We want to understand what kinds of stars those are, where they came from, and how they got there.”

Aside from the orbital paths of these “wandering” stars being different from most other Milky Way stars, their chemical composition also makes them unique. A team led by Judy Cheng (University of California – Santa Cruz) studied the metallicity of stars at different locations in the galaxy. By studying the metallicity, Cheng and her team were able to examine how the disk of the Milky Way disk grew over time. Cheng’s study also showed that stars closer to the center of the galaxy have higher metallicity than those farther from the galactic center. “That tells us that the outer disk of our Galaxy has formed fewer generations of stars than the inner disk, meaning that the Milky Way disk grew from the inside out,” added Cheng.

When Cheng studied the “wandering” stars, she found their metallicity doesn’t follow the same trend – no matter where she looked in the target area of the Galaxy, stars had low metal content. “The fact that the metal content of those stars is the same everywhere is a new piece of evidence that can help us figure out how they got to be so far away from the plane,” Rockosi mentioned.

What the team has yet to determine is if the stars formed with their “wandering” orbits, or if something in the past caused them to migrate to their unique paths. “If these stars were born with these orbits, they were born at the same rate all over the galaxy,” Cheng said. “If they were born with regular orbits, then whatever happened to them must have been very efficient at mixing them up and erasing any patterns in the metal content, such as the inside-out trend we see in the plane.”

Some possible reasons for this mixing include past mergers of our Galaxy and others, or possibly spiral arms sweeping through the disk. Cheng’s observations will help determine what causes stars to wander far from their birthplace. Other galaxies have shown stars in their disks as well, so solving the puzzle presented by these stars will help researchers better understand how spiral galaxies like the Milky Way form.

If you’d like to read Cheng and Rockosi’s paper “Metallicity Gradients In The Milky Way Disk As Observed By The SEGUE Survey”, you can download a copy at: http://www.ucolick.org/~jyc/gradient/cheng_apj_fullres.pdf

Source: UC Santa Cruz press release

Astronomers Witness a Web of Dark Matter

Dark matter in the Universe is distributed as a network of gigantic dense (white) and empty (dark) regions, where the largest white regions are about the size of several Earth moons on the sky. Credit: Van Waerbeke, Heymans, and CFHTLens collaboration.

[/caption]

We can’t see it, we can’t feel it, we can’t even interact with it… but dark matter may very well be one of the most fundamental physical components of our Universe. The sheer quantity of the stuff – whatever it is – is what physicists have suspected helps gives galaxies their mass, structure, and motion, and provides the “glue” that connects clusters of galaxies together in vast networks of cosmic webs.

Now, for the first time, this dark matter web has been directly observed.

An international team of astronomers, led by Dr. Catherine Heymans of the University of Edinburgh, Scotland, and Associate Professor Ludovic Van Waerbeke of the University of British Columbia, Vancouver, Canada, used data from the Canada-France-Hawaii Telescope Legacy Survey to map images of about 10 million galaxies and study how their light was bent by gravitational lensing caused by intervening dark matter.

Inside the dome of the Canada-France-Hawaii Telescope. (CFHT)

The images were gathered over a period of five years using CFHT’s 1×1-degree-field, 340-megapixel MegaCam. The galaxies observed in the survey are up to 6 billion light-years away… meaning their observed light was emitted when the Universe was only a little over half its present age.

The amount of distortion of the galaxies’ light provided the team with a visual map of a dark matter “web” spanning a billion light-years across.

“It is fascinating to be able to ‘see’ the dark matter using space-time distortion,” said Van Waerbeke. “It gives us privileged access to this mysterious mass in the Universe which cannot be observed otherwise. Knowing how dark matter is distributed is the very first step towards understanding its nature and how it fits within our current knowledge of physics.”

This is one giant leap toward unraveling the mystery of this massive-yet-invisible substance that pervades the Universe.

The densest regions of the dark matter cosmic web host massive clusters of galaxies. Credit: Van Waerbeke, Heymans, and CFHTLens collaboration.

“We hope that by mapping more dark matter than has been studied before, we are a step closer to understanding this material and its relationship with the galaxies in our Universe,” Dr. Heymans said.

The results were presented today at the American Astronomical Society meeting in Austin, Texas. Read the release here.

Journal Club: On Nothing

Today's Journal Club is about a new addition to the Standard Model of fundamental particles.

[/caption]

According to Wikipedia, a journal club is a group of individuals who meet regularly to critically evaluate recent articles in scientific literature. Being Universe Today if we occasionally stray into critically evaluating each other’s critical evaluations, that’s OK too. And of course, the first rule of Journal Club is… don’t talk about Journal Club.

So, without further ado – today’s journal article under the spotlight is about nothing.

The premise of the article is that to define nothing we need to look beyond a simple vacuum and think of nothing in terms of what there was before the Big Bang – i.e. really nothing.

For example, you can have a bubble of nothing (no topology, no geometry), a bubble of next to nothing (topology, but no geometry) or a bubble of something (which has topology, geometry and most importantly volume). The universe is a good example of a bubble of something.

The paper walks the reader through a train of logic which ends by defining nothing as ‘anti De Sitter space as the curvature length approaches zero’. De Sitter space is essentially a ‘vacuum solution’ of Einstein’s field equations – that is, a mathematically modelled universe with a positive cosmological constant. So it expands at an accelerating rate even though it is an empty vacuum. Anti De Sitter space is a vacuum solution with a negative cosmological constant – so it’s shrinking inward even though it is an empty vacuum. And as its curvature length approaches zero, you get nothing.

Having so defined nothing, the authors then explore how you might get a universe to spontaneously arise from that nothing – and nope, apparently it can’t be done. Although there are various ways to enable ‘tunnelling’ that can produce quantum fluctuations within an apparent vacuum – you can’t ‘up-tunnel’ from nothing (or at least you can’t up-tunnel from ‘anti-de Sitter space as the curvature length approaches zero’ ).

The paper acknowledges this is obviously a problem, since here we are. By explanation, the authors suggest:

  • get past the problem by appealing to immeasurable extra dimensions (a common strategy in theoretical physics to explain impossible things without anyone being able to easily prove or disprove it);
  • that their definition of nothing is just plain wrong; or
  • that they (and we) are just not asking the right questions.

Clearly the third explanation is the authors’ favoured one as they end with the statement: ‘One thing seems clear… to truly understand everything, we must first understand nothing‘. Nice.

So – comments? Is appealing to extra dimensions just a way of dodging a need for evidence? Nothing to declare? Want to suggest an article for the next edition of Journal Club?

Today’s article:
Brown and Dahlen On Nothing.

Unlocking Cosmology With Type 1a Supernovae

New research shows that some old stars known as white dwarfs might be held up by their rapid spins, and when they slow down, they explode as Type Ia supernovae. Thousands of these "time bombs" could be scattered throughout our Galaxy. In this artist's conception, a supernova explosion is about to obliterate an orbiting Saturn-like planet. Credit: David A. Aguilar (CfA)

[/caption]Let’s face it, cosmologists catch a lot of flack. It’s easy to see why. These are people who routinely publish papers that claim to ever more finely constrain the size of the visible Universe, the rate of its breakneck expansion, and the distance to galaxies that lie closer and closer to the edges of both time and space. Many skeptics scoff at scientists who seem to draw such grand conclusions without being able to directly measure the unbelievable cosmic distances involved. Well, it turns out cosmologists are a creative bunch. Enter our star (ha, ha): the Type 1a Supernova. These stellar fireballs are one of the main tools astronomers use in order to make such fantastic discoveries about our Universe. But how exactly do they do it?

First, let’s talk physics. Type 1a supernovae result from a mismatched marriage gone wrong. When a red giant and white dwarf (or, less commonly, two white dwarfs) become trapped in a gravitational standoff, the denser dwarf star begins to accrete material from its bloated companion. Eventually the white dwarf reaches a critical mass (about 1.4 times that of our own Sun) and the natural pressure exerted by its core can no longer support its weight. A runaway nuclear reaction occurs, resulting in a cataclysmic explosion so large, it can be seen billions of light years away. Since type 1a supernovae always result from the collapse of a white dwarf, and since the white dwarf always becomes unstable at exactly the same mass, astronomers can easily work out the precise luminosity of such an event. And they have. This is great news, because it means that type 1a supernovae can be used as so-called standard candles with which to probe distances in the Universe. After all, if you know how bright something is and you know how bright it appears from where you are, you can easily figure out how far away it must be.

A Type Ia supernova occurs when a white dwarf accretes material from a companion star until it exceeds the Chandrasekhar limit and explodes. By studying these exploding stars, astronomers can measure dark energy and the expansion of the universe. CfA scientists have found a way to correct for small variations in the appearance of these supernovae, so that they become even better standard candles. The key is to sort the supernovae based on their color. Credit: NASA/CXC/M. Weiss

Now here’s where cosmology comes in. Photons naturally lose energy as they travel across the expanding Universe, so the light astronomers observe coming from type 1a supernovae will always be redshifted. The magnitude of that redshift depends on the amount of dark energy that is causing the Universe to expand. It also means that the apparent brightness of a supernova (that is, how bright it looks from Earth) can be monitored to determine how quickly it is receding from our line of view. Observations of the night sky will always be a function of a specific cosmology; but because their distances can be so easily calculated, type 1a supernovae actually allow astronomers to draw a physical map of the expansion of the Universe.

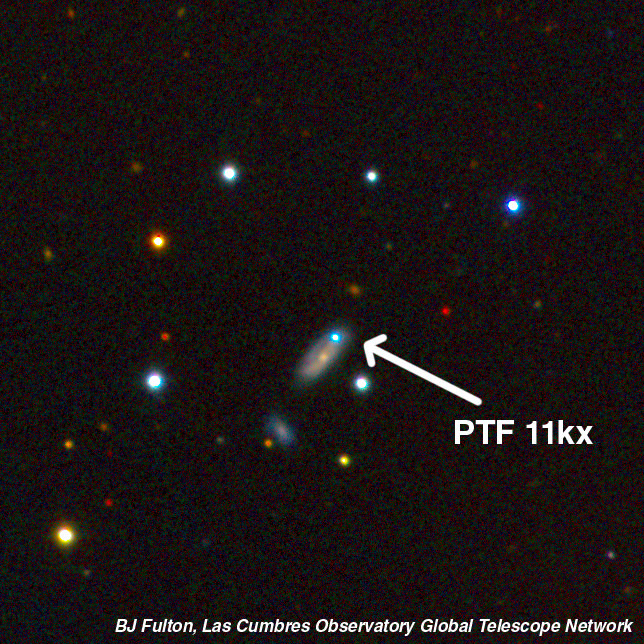
Spotting a type 1a supernova in its early, explosive throes is a rare event; after all, the Universe is a pretty big place. But when it does happen, it offers observers an unparalleled opportunity to dissect the chaos that leads to such a massive explosion. Sometimes astronomers are even lucky enough to catch one right in our cosmic backyard, a feat that occurred last August when Caltech’s Palomar Transit Factory (PTF) detected a type 1a supernova in M101, a galaxy just 25 million light years away. By the way, it isn’t just professionals that got to have all the fun! Amateur and career astronomers alike were able to use this supernova (the romantically named PTF11kly) to probe the inner workings of these precious standard candles. Want to learn more about how you can get in on the action the next time around? Check out UT’s podcast, Getting Started in Amateur Astronomy for more information.

Guest Post: The Cosmic Energy Inventory

The Cosmic Energy Inventory chart by Markus Pössel. Click for larger version.

[/caption]

Now that the old year has drawn to a close, it’s traditional to take stock. And why not think big and take stock of everything there is?

Let’s base our inventory on energy. And as Einstein taught us that energy and mass are equivalent, that means automatically taking stock of all the mass that’s in the universe, as well – including all the different forms of matter we might be interested in.

Of course, since the universe might well be infinite in size, we can’t simply add up all the energy. What we’ll do instead is look at fractions: How much of the energy in the universe is in the form of planets? How much is in the form of stars? How much is plasma, or dark matter, or dark energy?


The chart above is a fairly detailed inventory of our universe. The numbers I’ve used are from the article The Cosmic Energy Inventory by Masataka Fukugita and Jim Peebles, published in 2004 in the Astrophysical Journal (vol. 616, p. 643ff.). The chart style is borrowed from Randall Munroe’s Radiation Dose Chart over at xkcd.

These fractions will have changed a lot over time, of course. Around 13.7 billion years ago, in the Big Bang phase, there would have been no stars at all. And the number of, say, neutron stars or stellar black holes will have grown continuously as more and more massive stars have ended their lives, producing these kinds of stellar remnants. For this chart, following Fukugita and Peebles, we’ll look at the present era. What is the current distribution of energy in the universe? Unsurprisingly, the values given in that article come with different uncertainties – after all, the authors are extrapolating to a pretty grand scale! The details can be found in Fukugita & Peebles’ article; for us, their most important conclusion is that the observational data and their theoretical bases are now indeed firm enough for an approximate, but differentiated and consistent picture of the cosmic inventory to emerge.

Let’s start with what’s closest to our own home. How much of the energy (equivalently, mass) is in the form of planets? As it turns out: not a lot. Based on extrapolations from what data we have about exoplanets (that is, planets orbiting stars other than the sun), just one part-per-million (1 ppm) of all energy is in the form of planets; in scientific notation: 10-6. Let’s take “1 ppm” as the basic unit for our first chart, and represent it by a small light-green square. (Fractions of 1 ppm will be represented by partially filled such squares.) Here is the first box (of three), listing planets and other contributions of about the same order of magnitude:

So what else is in that box? Other forms of condensed matter, mainly cosmic dust, account for 2.5 ppm, according to rough extrapolations based on observations within our home galaxy, the Milky Way. Among other things, this is the raw material for future planets!

For the next contribution, a jump in scale. To the best of our knowledge, pretty much every galaxy contains a supermassive black hole (SMBH) in its central region. Masses for these SMBHs vary between a hundred thousand times the mass of our Sun and several billion solar masses. Matter falling into such a black hole (and getting caught up, intermittently, in super-hot accretion disks swirling around the SMBHs) is responsible for some of the brightest phenomena in the universe: active galaxies, including ultra high-powered quasars. The contribution of matter caught up in SMBHs to our energy inventory is rather modest, though: about 4 ppm; possibly a bit more.

Who else is playing in the same league? The sum total of all electromagnetic radiation produced by stars and by active galaxies (to name the two most important sources) over the course of the last billions of years, to name one: 2 ppm. Also, neutrinos produced during supernova explosions (at the end of the life of massive stars), or in the formation of white dwarfs (remnants of lower-mass stars like our Sun), or simply as part of the ordinary fusion processes that power ordinary stars: 3.2 ppm all in all.

Then, there’s binding energy: If two components are bound together, you will need to invest energy in order to separate them. That’s why binding energy is negative – it’s an energy deficit you will need to overcome to pry the system’s components apart. Nuclear binding energy, from stars fusing together light elements to form heavier ones, accounts for -6.3 ppm in the present universe – and the total gravitational binding energy accumulated as stars, galaxies, galaxy clusters, other gravitationally bound objects and the large-scale structure of the universe have formed over the past 14 or so billion years, for an even larger -13.4 ppm. All in all, the negative contributions from binding energy more than cancel out all the positive contributions by planets, radiation, neutrinos etc. we’ve listed so far.

Which brings us to the next level. In order to visualize larger contributions, we need a change scale. In box 2, one square will represent a fraction of 1/20,000 or 0.00005. Put differently: Fifty of the little squares in the first box correspond to a single square in the second box:

So here, without further ado, is box 2 (including, in the upper right corner, a scale model of the first box):

Now we are in the realm of stars and related objects. By measuring the luminosity of galaxies, and using standard relations between the masses and luminosity of stars (“mass-to-light-ratio”), you can get a first estimate for the total mass (equivalently: energy) contained in stars. You’ll also need to use the empirical relation (“initial mass function”) for how this mass is distributed, though: How many massive stars should there be? How many lower-mass stars? Since different stars have different lifetimes (live massively, die young), this gives estimates for how many stars out there are still in the prime of life (“main sequence stars”) and how many have already died, leaving white dwarfs (from low-mass stars), neutron stars (from more massive stars) or stellar black holes (from even more massive stars) behind. The mass distribution also provides you with an estimate of how much mass there is in substellar objects such as brown dwarfs – objects which never had sufficient mass to make it to stardom in the first place.

Let’s start small with the neutron stars at 0.00005 (1 square, at our current scale) and the stellar black holes (0.00007). Interestingly, those are outweighed by brown dwarfs which, individually, have much less mass, but of which there are, apparently, really a lot (0.00014; this is typical of stellar mass distribution – lots of low-mass stars, much fewer massive ones.) Next come white dwarfs as the remnants of lower-mass stars like our Sun (0.00036). And then, much more than all the remnants or substellar objects combined, ordinary, main sequence stars like our Sun and its higher-mass and (mostly) lower-mass brethren (0.00205).

Interestingly enough, in this box, stars and related objects contribute about as much mass (or energy) as more undifferentiated types of matter: molecular gas (mostly hydrogen molecules, at 0.00016), hydrogen and helium atoms (HI and HeI, 0.00062) and, most notably, the plasma that fills the void between galaxies in large clusters (0.0018) add up to a whopping 0.00258. Stars, brown dwarfs and remnants add up to 0.00267.

Further contributions with about the same order of magnitude are survivors from our universe’s most distant past: The cosmic background radiation (CMB), remnant of the extremely hot radiation interacting with equally hot plasma in the big bang phase, contributes 0.00005; the lesser-known cosmic neutrino background, another remnant of that early equilibrium, contributes a remarkable 0.0013. The binding energy from the first primordial fusion events (formation of light elements within those famous “first three minutes”) gives another contribution in this range: -0.00008.

While, in the previous box, the matter we love, know and need was not dominant, it at least made a dent. This changes when we move on to box 3. In this box, one square corresponds to 0.005. In other words: 100 squares from box 2 add up to a single square in box 3:

Box 3 is the last box of our chart. Again, a scale model of box 2 is added for comparison: All that’s in box 2 corresponds to one-square-and-a-bit in box 3.

The first new contribution: warm intergalactic plasma. Its presence is deduced from the overall amount of ordinary matter (which follows from measurements of the cosmic background radiation, combined with data from surveys and measurements of the abundances of light elements) as compared with the ordinary matter that has actually been detected (as plasma, stars, e.g.). From models of large-scale structure formation, it follows that this missing matter should come in the shape (non-shape?) of a diffuse plasma, which isn’t dense (or hot) enough to allow for direct detection. This cosmic filler substance amounts to 0.04, or 85% of ordinary matter, showing just how much of a fringe phenomena those astronomical objects we usually hear and read about really are.

The final two (dominant) contributions come as no surprise for anyone keeping up with basic cosmology: dark matter at 23% is, according to simulations, the backbone of cosmic large-scale structure, with ordinary matter no more than icing on the cake. Last but not least, there’s dark energy with its contribution of 72%, responsible both for the cosmos’ accelerated expansion and for the 2011 physics Nobel Prize.

Minority inhabitants of a part-per-million type of object made of non-standard cosmic matter – that’s us. But at the same time, we are a species, that, its cosmic fringe position notwithstanding, has made remarkable strides in unravelling the big picture – including the cosmic inventory represented in this chart.

__________________________________________

Here is the full chart for you to download: the PNG version (1200×900 px, 233 kB) or the lovingly hand-crafted SVG version (29 kB).

The chart “The Cosmic Energy Inventory” is licensed under Creative Commons BY-NC-SA 3.0. In short: You’re free to use it non-commercially; you must add the proper credit line “Markus Pössel [www.haus-der-astronomie.de]”; if you adapt the work, the result must be available under this or a similar license.

Technical notes: As is common in astrophysics, Fukugita and Peebles give densities as fractions of the so-called critical density; in the usual cosmological models, that density, evaluated at any given time (in this case: the present), is critical for determining the geometry of the universe. Using very precise measurements of the cosmic background radiation, we know that the average density of the universe is indistinguishable from the critical density. For simplicity’s sake, I’m skipping this detour in the main text and quoting all of F & P’s numbers as “fractions of the universe’s total energy (density)”.

For the supermassive black hole contributions, I’ve neglected the fraction ?n in F & P’s article; that’s why I’m quoting a lower limit only. The real number could theoretically be twice the quoted value; it’s apparently more likely to be close to the value given here, though. For my gravitational binding energy, I’ve added F & P’s primeval gravitational binding energy (no. 4 in their list) and their binding energy from dissipative gravitational settling (no. 5).

The fact that the content of box 3 adds up not quite to 1, but to 0.997, is an artefact of rounding not quite consistently when going from box 2 to box 3. I wanted to keep the sum of all that’s in box 2 at the precision level of that box.