What if the Earth had Two Moons?

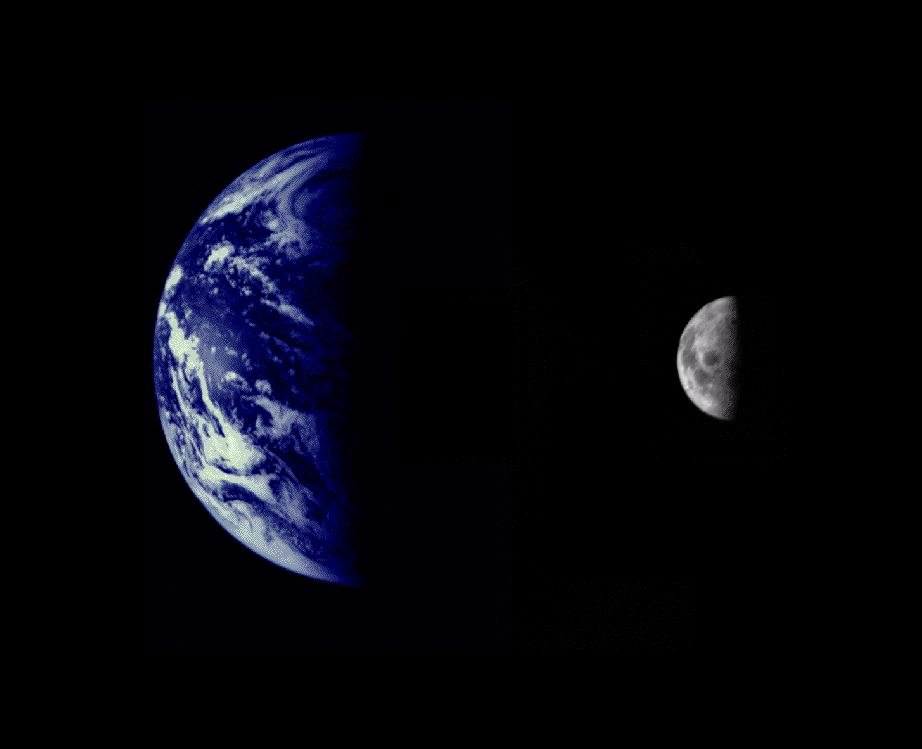
The Earth and Moon as seen from Mariner 10 en route to Venus. This could be a similar view of two moons as seen from Earth. Image credit: NASA/courtesy of nasaimages.org

The idea of an Earth with two moons has been a science fiction staple for decades. More recently, real possibilities of an Earth with two moons have popped up. The properties of the Moon’s far side has many scientists thinking that another moon used to orbit the Earth before smashing into the Moon and becoming part of its mass. Since 2006, astronomers have been tracking smaller secondary moons that our own Earth-Moon system captures; these metre-wide moons stay for a few months then leave.

But what if the Earth actually had a second permanent moon today? How different would life be? Astronomer and physicist Neil F. Comins delves into this thought experiment, and suggests some very interesting consequences. 
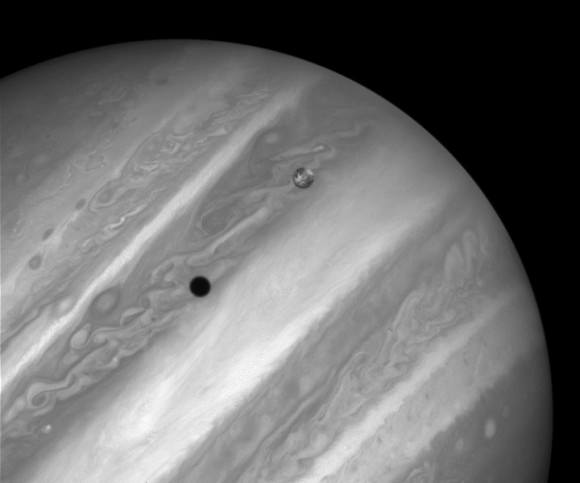
This shot of Io orbiting Jupiter shows the scale between other moons and their planet. Image credit:NASA/courtesy of nasaimages.org

Our Earth-Moon system is unique in the solar system. The Moon is 1/81 the mass of Earth while most moons are only about 3/10,000 the mass of their planet. The size of the Moon is a major contributing factor to complex life on Earth. It is responsible for the high tides that stirred up the primordial soup of the early Earth, it’s the reason our day is 24 hours long, it gives light for the variety of life forms that live and hunt during the night, and it keeps our planet’s axis tilted at the same angle to give us a constant cycle of seasons.

A second moon would change that.

For his two-mooned Earth thought experiment, Comins proposes that our Earth-Moon system formed as it did — he needs the same early conditions that allowed life to form — before capturing a third body. This moon, which I will call Luna, sits halfway between the Earth and the Moon.

Luna’s arrival would wreak havoc on Earth. Its gravity would tug on the planet causing absolutely massive tsunamis, earthquakes, and increased volcanic activity. The ash and chemicals raining down would cause a mass extinction on Earth.

But after a few weeks, things would start to settle.

Luna would adjust to its new position between the Earth and the Moon. The pull from both bodies would cause land tides and volcanic activity on the new moon; it would develop activity akin to Jupiter’s volcanic moon Io. The constant volcanic activity would make Luna smooth and uniform, as well as a beautiful fixture in the night sky.
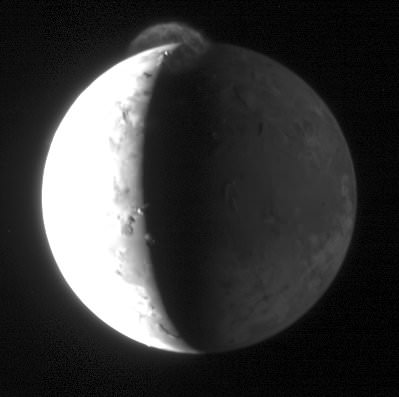
New Horizons captured this image of volcanic activity on Io. The same sight could be seen of Luna from Earth. Image credit: NASA/courtesy of nasaimages.org

The Earth would also adjust to its two moons, giving life a chance to arise. But life on a two-mooned Earth would be different.

The combined light from the Moon and Luna would make for much brighter nights, and their different orbital periods will mean the Earth would have fewer fully dark nights. This will lead to different kinds of nocturnal beings; nighttime hunters would have an easier time seeing their prey, but the prey would develop better camouflage mechanisms. The need to survive could lead to more cunning and intelligent breeds of nocturnal animals.

Humans would have to adapt to the challenges of this two-mooned Earth. The higher tides created by Luna would make shoreline living almost impossible — the difference between high and low tides would be measured in thousands of feet. Proximity to the water is a necessity for sewage draining and transport of goods, but with higher tides and stronger erosion, humans would have to develop different ways of using the oceans for transfer and travel. The habitable area of Earth, then, would be much smaller.

The measurement of time would also be different. Our months would be irrelevant. Instead, a system of full and partials months would be necessary to account for the movement of two moons.
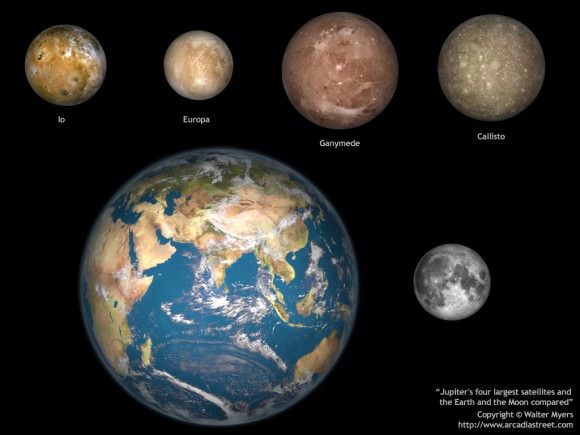
A scale comparison of the Earth, the Moon, and Jupiter’s largest moons (the Jovian moons). Image credit:Image Credit: NASA/courtesy of nasaimages.org

Eventually, the Moon and Luna would collide; like the Moon is now, both moons would be receding from Earth. Their eventual collision would send debris raining through Earth’s atmosphere and lead to another mass extinction. The end result would be one moon orbiting the Earth, and life another era of life would be primed to start.

Source: Neil Comins’ What if the Earth had Two Moons? And Nine Other Thought Provoking Speculations on the Solar System.

Why Do We Live in Three Dimensions?

The puzzling universe. Image credit: NASA/courtesy of nasaimages.org

[/caption]

Day to day life has made us all comfortable with 3 dimensions; we constantly interact with objects that have height, width, and depth. But why our universe has three spatial dimensions has been a problem for physicists, especially since the 3-dimensional universe isn’t easily explained within superstring theory or Big Bang cosmology. Recently, three researchers have come up with an explanation.  

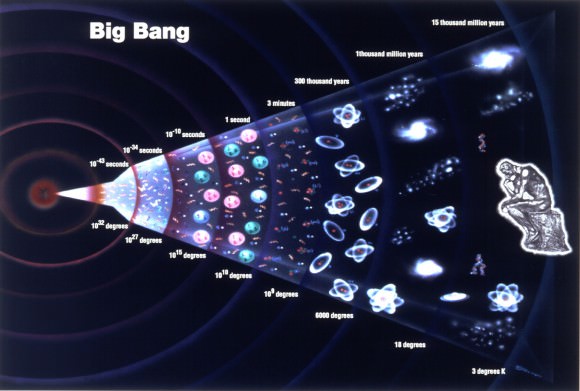
The history of the universe starting the with the Big Bang. Image credit: grandunificationtheory.com

Most astronomers subscribe to Big Bang cosmology, the model that proposes that the universe was born from the explosion of an infinitely tiny point. The theory is supported by observations of the cosmic microwave background and the abundance of certain naturally occurring elements. But Big Bang cosmology is at odds with Einstein’s theory of general relativity – general relativity doesn’t allow for any situation in which the whole universe is one tiny point, which means this theory alone can’t explain the origin of the universe.

The incompatibility between general relativity and Big Bang cosmology has stumped cosmologists. But almost 40 years ago, superstring theory arose as a possible unifying theory of everything.

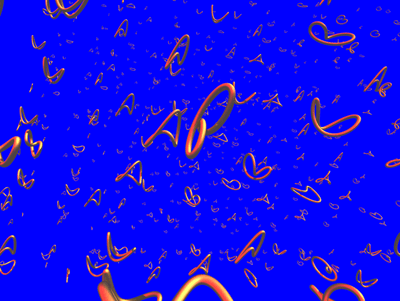
A visualization of strings. Image credit: R. Dijkgraaf.

Superstring theory suggests that the four fundamental interactions among elementary particles – electromagnetic force, weak interaction, strong interaction, and gravity – are represented as various oscillation modes of very tiny strings. Because gravity is one of the fundamental forces, superstring theory includes an explanation of general relativity. The problem is, superstring theory predicts that there are 10 dimensions – 9 spatial and one temporal. How does this work with our 3 dimensional universe?

Superstring theory has remained little more than a theory for years. Investigations have been restricted to discussing models and scenarios since performing the actual calculations have been incredibly difficult. As such, superstring theory’s validity and usefulness have remained unclear.

But a group of three researchers, associate professor at KEK Jun Nishimura, associate professor at Shizuoka University Asato Tsuchiya, and project researcher at Osaka University Sang-Woo Kim, has succeeded in generating a model of the universe’s birth based on superstring theory.

Using a supercomputer, they found that at the moment of the Big Bang, the universe had 10 dimensions – 9 spatial and 1 temporal – but only 3 of these spatial dimensions expanded.

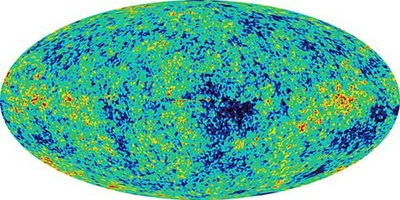
This "baby picture" of the universe shows tiny variations in the microwave background radiation temperature. Hot spots show as red, cold spots as dark blue.Credit: NASA/WMAP Science Team

The team developed a method for calculating matrices that represent the interactions of strings. They used these matrices to calculate how 9 dimensional space changes over time. As they moved further back in time, they found that space is extended in 9 directions, but at one point only 3 directions start to expand rapidly.

In short, the 3 dimensional space that we live in can result from the 9 original spatial dimensions string theory predicts.

This result is only part of the solution to the space-time dimensionality puzzle, but it strongly supports the validity of superstring theory. It’s possible, though, that this new method of analyzing superstring theory with supercomputers will lead to its application towards solving other cosmological questions.

 Source: The mechanism that explains why our universe was born with 3 dimensions.

A Star-Making Blob from the Cosmic Dawn

This image shows one of the most distant galaxies known, called GN-108036, dating back to 750 million years after the Big Bang that created our universe. Credit: NASA, ESA, JPL-Caltech, STScI, and the University of Tokyo

[/caption]

Looking back in time with some of our best telescopes, astronomers have found one of the most distant and oldest galaxies. The big surprise about this blob-shaped galaxy, named GN-108036, is how exceptionally bright it is, even though its light has taken 12.9 billion years to reach us. This means that back in its heyday – which astronomers estimate at about 750 million years after the Big Bang — it was generating an exceptionally large amount of stars in the “cosmic dawn,” the early days of the Universe.

“The high rate of star formation found for GN-108036 implies that it was rapidly building up its mass some 750 million years after the Big Bang, when the Universe was only about five percent of its present age,” said Bahram Mobasher, from the University of California, Riverside. “This was therefore a likely ancestor of massive and evolved galaxies seen today.”


An international team of astronomers, led by Masami Ouchi of the University of Tokyo, Japan, first identified the remote galaxy after scanning a large patch of sky with the Subaru Telescope atop Mauna Kea in Hawaii. Its great distance was then confirmed with the W.M. Keck Observatory, also on Mauna Kea. Then, infrared observations from the Spitzer and Hubble space telescopes were crucial for measuring the galaxy’s star-formation activity.

“We checked our results on three different occasions over two years, and each time confirmed the previous measurement,” said Yoshiaki Ono, also from the of the University of Tokyo.

Astronomers were surprised to see such a large burst of star formation because the galaxy is so small and from such an early cosmic era. Back when galaxies were first forming, in the first few hundreds of millions of years after the Big Bang, they were much smaller than they are today, having yet to bulk up in mass.

The team says the galaxy’s star production rate is equivalent to about 100 suns per year. For reference, our Milky Way galaxy is about five times larger and 100 times more massive than GN-108036, but makes roughly 30 times fewer stars per year.

Astronomers refer to the object’s distance by a number called its “redshift,” which relates to how much its light has stretched to longer, redder wavelengths due to the expansion of the universe. Objects with larger redshifts are farther away and are seen further back in time. GN-108036 has a redshift of 7.2. Only a handful of galaxies have confirmed redshifts greater than 7, and only two of these have been reported to be more distant than GN-108036.

About 380,000 years after the Big Bang, a decrease in the temperature of the Universe caused hydrogen atoms to permeate the cosmos and form a thick fog that was opaque to ultraviolet light, creating what astronomers call the cosmic dark ages.

“It ended when gas clouds of neutral hydrogen collapsed to generate stars, forming the first galaxies, which probably radiated high-energy photons and reionized the Universe,” Mobasher said. “Vigorous galaxies like GN-108036 may well have contributed to the reionization process, which is responsible for the transparency of the Universe today.”

“The discovery is surprising because previous surveys had not found galaxies this bright so early in the history of the universe,” said Mark Dickinson of the National Optical Astronomy Observatory in Tucson, Ariz. “Perhaps those surveys were just too small to find galaxies like GN-108036. It may be a special, rare object that we just happened to catch during an extreme burst of star formation.”

Sources: Science Paper by: Y. Ono et al., Subaru , Spitzer Hubble

A New Look at the Milky Way’s Central Bar

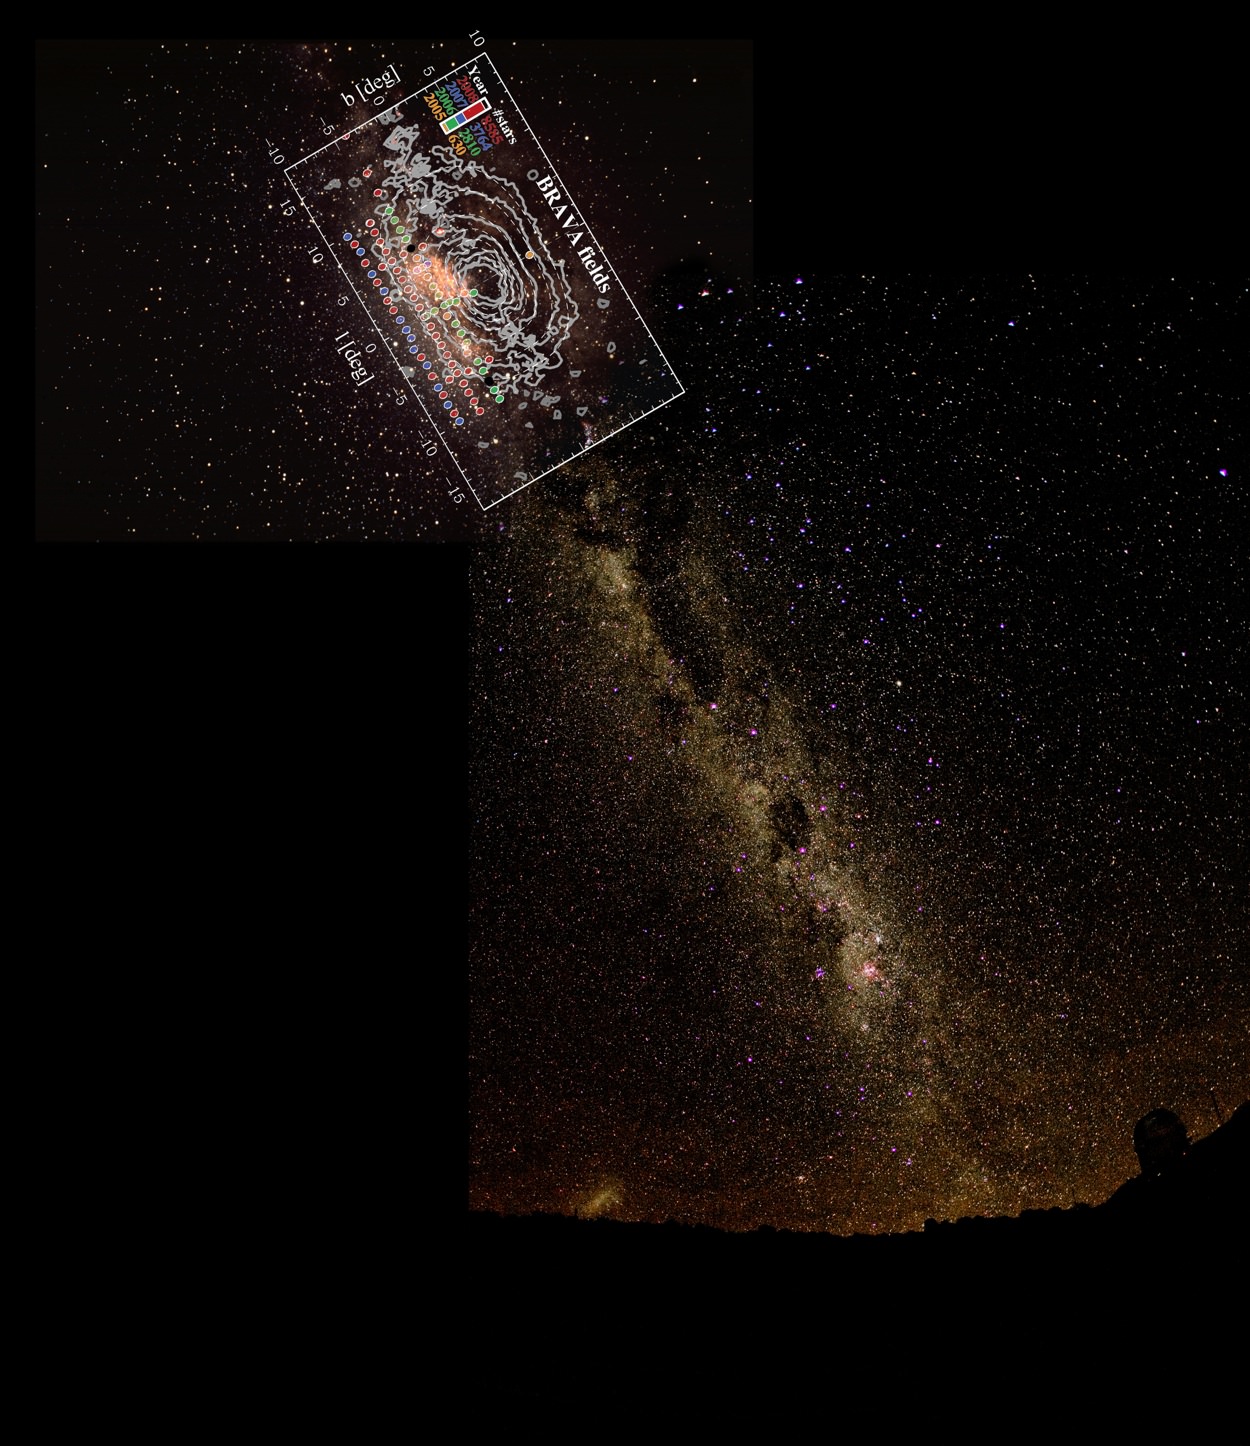
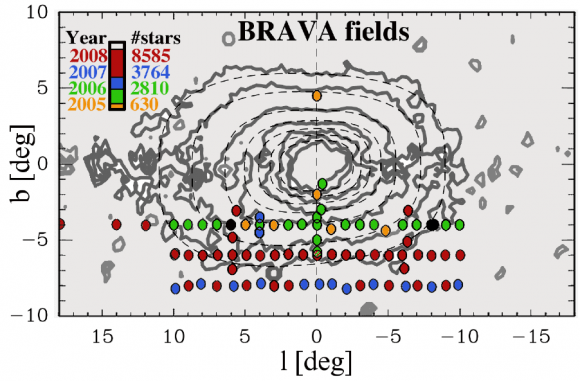
The BRAVA fields are shown in this image montage. For reference, the center of the Milky Way is at coordinates L= 0, B=0. The regions observed are marked with colored circles. This montage includes the southern Milky Way all the way to the horizon, as seen from CTIO. The telescope in silhouette is the CTIO Blanco 4-m. (Just peaking over the horizon on the left is the Large Magellanic Cloud, the nearest external galaxy to our own.) Image Credit: D. Talent, K. Don, P. Marenfeld & NOAO/AURA/NSF and the BRAVA Project

[/caption]You may have heard about the restaurant at the end of the Universe, but have you heard of the bar in the middle of the Milky Way?

Nearly 80 years ago, astronomers determined that our home, the Milky Way Galaxy, is a large spiral galaxy. Despite being stuck inside and not being able to see what the entire the structure looks like — as we can with the Pinwheel Galaxy, or our nearest neighbor, the Andromeda Galaxy — researchers have suspected our galaxy is actually a “barred” spiral galaxy. Barred spiral galaxies feature an elongated stellar structure , or bar, in the middle which in our case is hidden by dust and gas. There are many galaxies in the Universe that are barred spirals, and yet, there are numerous galaxies which do not feature a central bar.

How do these central bars form, and why are they only present in some, but not all spiral galaxies?

A research team led by Dr. R. Michael Rich (UCLA), dubbed BRAVA (Bulge Radial Velocity Assay), measured the velocity of many old, red stars near the center of our galaxy. By studying the spectra (combined light) of the M class giant stars, the team was able to calculate the velocity of each star along our line of sight. During a four-year time span, the spectra for nearly 10,000 stars was acquired with the CTIO Blanco 4-meter telescope located in Chile’s Atacama desert.

Analyzing the velocities of stars in their study, the team was able to confirm that the Milky Way’s central bulge does contain a massive bar, with one end nearly pointed right at our solar system. One other discovery made by the team is that while our galaxy rotates like a wheel, the BRAVA study found that the rotation of the central bar is more like that of a roll of paper towels in a dispenser. The team’s discoveries provide vital clues to help explain the formation of the Milky Way’s central region.

BRAVA data. Image Credit: D. Talent, K. Don, P. Marenfeld & NOAO/AURA/NSF and the BRAVA Project

The spectra data set was compared to a computer simulation created by Dr. Juntai Shen (Shanghai Observatory) showing how the bar formed from a pre-existing disk of stars. The team’s data fits the model quite well, suggesting that before the central bar existed, there was a massive disk of stars. The conclusion reached by the team is in stark contrast to the commonly accepted model of formation of our galaxy’s central region – a model that predicts the Milky Way’s central region formed from an early chaotic merger of gas clouds. The “take-away” point from the team’s conclusions is that gas did play some role in the formation of our galaxy’s central region, which organized into a massive rotating disk, and then turned into a bar due to the gravitational interactions of the stars.

One other benefit to the team’s research is that stellar spectra data will allow the team to analyze the chemical composition of the stars. All stars are composed of mostly hydrogen and helium, but the tiny amounts of other elements (astronomers refer to anything past helium as “metals”) provides insight into the conditions present during a star’s formation.

The BRAVA team found that stars closest to the plane of the Milky Way Galaxy have fewer “metals” than stars further from its galactic plane. The team’s conclusion does confirm standard views of stellar formation, yet the BRAVA data covers a significant area of the galactic bulge that can be chemically analyzed. If researchers map the metal content of stars throughout the Milky Way, a clear picture of stellar formation and evolution emerges, similar to how mapping CO2 concentrations in the Antarctic ice shelf can reveal the past weather patterns here on Earth.

If you’d like to read the full paper, a pre-print version is available at: http://arxiv.org/abs/1112.1955

Source: National Optical Astronomy Observatory press release

Underwater Neutrino Detector Will Be Second-Largest Structure Ever Built

Artist's rendering of the KM3NeT array. (Marco Kraan/Property KM3NeT Consortium)

[/caption]

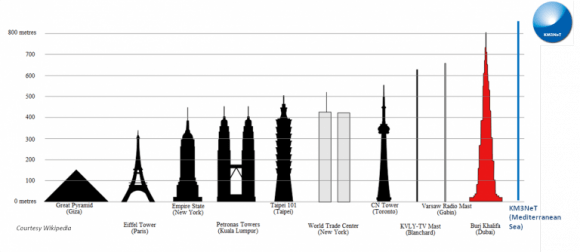
The hunt for elusive neutrinos will soon get its largest and most powerful tool yet: the enormous KM3NeT telescope, currently under development by a consortium of 40 institutions from ten European countries. Once completed KM3NeT will be the second-largest structure ever made by humans, after the Great Wall of China, and taller than the Burj Khalifa in Dubai… but submerged beneath 3,200 feet of ocean!

KM3NeT – so named because it will encompass an area of several cubic kilometers – will be composed of lengths of cable holding optical modules on the ends of long arms. These modules will stare at the sea floor beneath the Mediterranean in an attempt to detect the impacts of neutrinos traveling down from deep space.

Successfully spotting neutrinos – subatomic particles that don’t interact with “normal” matter very much at all, nor have magnetic charges – will help researchers to determine which direction they originated from. That in turn will help them pinpoint distant sources of powerful radiation, like quasars and gamma-ray bursts. Only neutrinos could make it this far and this long after such events since they can pass basically unimpeded across vast cosmic distances.

“The only high energy particles that can come from very distant sources are neutrinos,” said Giorgio Riccobene, a physicist and staff researcher at the National Institute for Nuclear Physics. “So by looking at them, we can probe the far and violent universe.”

Each Digital Optical Module (DOM) is a standalone sensor module with 31 3-inch PMTs in a 17-inch glass sphere.

In effect, by looking down beneath the sea KM3NeT will allow scientists to peer outward into the Universe, deep into space as well as far back in time.

The optical modules dispersed along the KM3NeT array will be able to identify the light given off by muons when neutrinos pass into the sea floor. The entire structure would have thousands of the modules (which resemble large versions of the hovering training spheres used by Luke Skywalker in Star Wars.)

In addition to searching for neutrinos passing through Earth, KM3NeT will also look toward the galactic center and search for the presence of neutrinos there, which would help confirm the purported existence of dark matter.

Read more about the KM3NeT project here, and check out a detailed article on the telescope and neutrinos on Popsci.com.

Height of the KM3NeT telescope structure compared to well-known buildings

Images property of KM3NeT Consortium 

Looking at Early Black Holes with a ‘Time Machine’

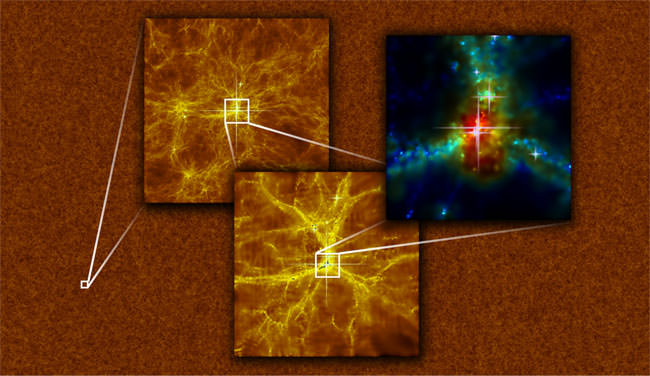
The large scale cosmological mass distribution in the simulation volume of the MassiveBlack. The projected gas density over the whole volume ('unwrapped' into 2D) is shown in the large scale (background) image. The two images on top show two zoom-in of increasing factor of 10, of the regions where the most massive black hole - the first quasars - is formed. The black hole is at the center of the image and is being fed by cold gas streams. Image Courtesy of Yu Feng.

[/caption]

What fed early black holes enabling their very rapid growth? A new discovery made by researchers at Carnegie Mellon University using a combination of supercomputer simulations and GigaPan Time Machine technology shows that a diet of cosmic “fast food” (thin streams of cold gas) flowed uncontrollably into the center of the first black holes, causing them to be “supersized” and grow faster than anything else in the Universe.

When our Universe was young, less than a billion years after the Big Bang, galaxies were just beginning to form and grow. According to prior theories, black holes at that time should have been equally small. Data from the Sloan Digital Sky Survey has shown evidence to the contrary – supermassive black holes were in existence as early as 700 million years after the Big Bang.

“The Sloan Digital Sky Survey found supermassive black holes at less than 1 billion years. They were the same size as today’s most massive black holes, which are 13.6 billion years old,” said Tiziana Di Matteo, associate professor of physics (Carnegie Mellon University). “It was a puzzle. Why do some black holes form so early when it takes the whole age of the Universe for others to reach the same mass?”

Supermassive black holes are the largest black holes in existence – weighing in with masses billions of times that of the Sun. Most “normal” black holes are only about 30 times more massive than the Sun. The currently accepted mechanism for the formation of supermassive black holes is through galactic mergers. One problem with this theory and how it applies to early supermassive black holes is that in early Universe, there weren’t many galaxies, and they were too distant from each other to merge.

Rupert Croft, associate professor of physics (Carnegie Mellon University) remarked, “If you write the equations for how galaxies and black holes form, it doesn’t seem possible that these huge masses could form that early, But we look to the sky and there they are.”

In an effort to understand the processes that formed the early supermassive black holes, Di Matteo, Croft and Khandai created MassiveBlack – the largest cosmological simulation to date. The purpose of MassiveBlack is to accurately simulate the first billion years of our universe. Describing MassiveBlack, Di Matteo remarked, “This simulation is truly gigantic. It’s the largest in terms of the level of physics and the actual volume. We did that because we were interested in looking at rare things in the universe, like the first black holes. Because they are so rare, you need to search over a large volume of space”.

Croft and the team started the simulations using known models of cosmology based on theories and laws of modern day physics. “We didn’t put anything crazy in. There’s no magic physics, no extra stuff. It’s the same physics that forms galaxies in simulations of the later universe,” said Croft. “But magically, these early quasars, just as had been observed, appear. We didn’t know they were going to show up. It was amazing to measure their masses and go ‘Wow! These are the exact right size and show up exactly at the right point in time.’ It’s a success story for the modern theory of cosmology.”

The data from MassiveBlack was added to the GigaPan Time Machine project. By combining the MassiveBlack data with the GigaPan Time Machine project, researchers were able to view the simulation as if it was a movie – easily panning across the simulated universe as it formed. When the team noticed events which appeared interesting, they were also able to zoom in to view the events in greater detail than what they could see in our own universe with ground or space-based telescopes.

When the team zoomed in on the creation of the first supermassive black holes, they saw something unexpected. Normal observations show that when cold gas flows toward a black hole it is heated from collisions with other nearby gas molecules, then cools down before entering the black hole. Known as ‘shock heating’, the process should have stopped early black holes from reaching the masses observed. Instead, the team observed thin streams of cold dense gas flowing along ‘filaments’ seen in large-scale surveys that reveal the structure of our universe. The filaments allowed the gas to flow directly into the center of the black holes at incredible speed, providing them with cold, fast food. The steady, but uncontrolled consumption provided a mechanism for the black holes to grow at a much faster rate than their host galaxies.

The findings will be published in the Astrophysical Journal Letters.

If you’d like to read more, check out the papers below ( via Physics arXiv ):
Terapixel Imaging of Cosmological Simulations
The Formation of Galaxies Hosting z~6 Quasars
Early Black Holes in Cosmological Simulations
Cold Flows and the First Quasars

Learn more about Gigapan and MassiveBlack at: http://gigapan.org/gigapans/76215/ and http://www.psc.edu/science/2011/supermassive/

Source: Carnegie Mellon University Press Release

Sagittarius Dwarf Galaxy – A Beast With Four Tails?

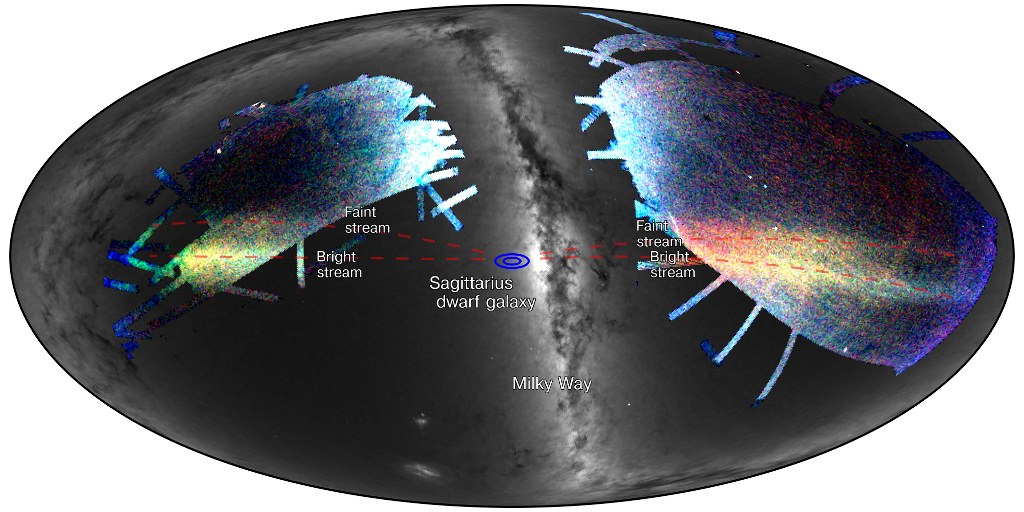
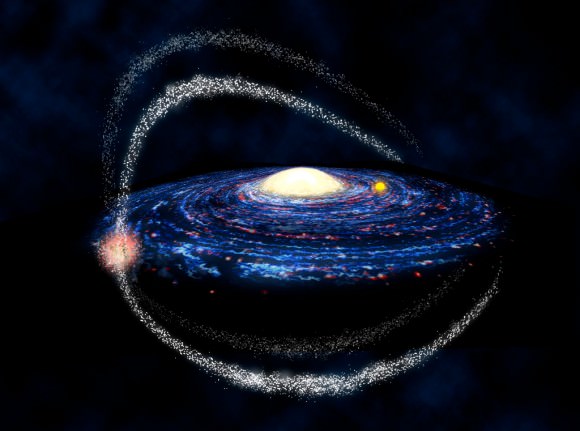
A map of the sky showing the numbers of stars counted in the Sagittarius streams. The dotted red lines trace out the Sagittarius streams, and the blue ellipses in the center show the current location of the Sagittarius Dwarf Galaxy. Image credit: S. Koposov and the SDSS-III collaboration

[/caption]

Galactic interactions can have big effects on the shapes of the disks of galaxies. So what happens when a small galaxy intermingles with the outer part of our own larger Milky Way Galaxy? It’s not pretty, as rivers of stars are being sheared off from a neighboring dwarf galaxy, Sagittarius, according to research by a team of astronomers led by Sergey Koposov and Vasily Belokurov (University of Cambridge).

Analyzing data from the latest Sloan Digital Sky Survey (SDSS-III), the team found two streams of stars in the Southern Galactic hemisphere that were torn off Sagittarius dwarf galaxy. This new discovery also connects newly found streams with two previously discovered streams in the Northern Galactic hemisphere.

Describing the phenomenon, Koposov said, “We have long known that when small dwarf galaxies fall into bigger galaxies, elongated streams, or tails, of stars are pulled out of the dwarf by the enormous tidal field.”

Wyn Evans, one of the other team members commented, “Sagittarius is like a beast with four tails.”

At one time, the Sagittarius dwarf galaxy was one of the brightest of our Galaxy’s satellites. Now its remains are on the other side of our Galaxy, and in the process of being broken apart by immense tidal forces. Estimates show that the Sagittarius dwarf galaxy lost half its stars and gas over the past billion years.

Before the SDSS-III data analysis, it was known that Sagittarius had two tails – one in front of and one behind the remnant. This discovery was made by using previous SDSS imaging, specifically a 2006 study which found the Sagittarius tidal tail in the Northern Galactic sky appears to be split in two.

Commenting on the previous discovery, Belokurov added, “That was an amazing discovery, but the remaining piece of the puzzle, the structure in the South, was missing until now.”

Analyzing density maps of over 13 million stars in the SDSS-III data, Koposov and his team found that the Sagittarius stream in the South is also split into two. One stream is thicker and brighter, while the other is thinner and fainter. According to the paper, the fainter stream is simpler and more metal-poor, while the brighter stream is more complex and metal-rich.

The deduction makes sense since each successive generation of stars will create and distribute (via supernovae) more metals into the next generation of star formation.

An artist's impression of the four tails of the Sagittarius Dwarf Galaxy (the orange clump on the left of the image) orbiting the Milky Way. The bright yellow circle to the right of the galaxy's center is our Sun (not to scale). Image credit: Amanda Smith (University of Cambridge)

While the exact cause of the tidal tail split is unknown, astronomers believe that the Sagittarius dwarf may have been part of a binary galactic system, much like the Large and Small Magellanic Clouds, visible in our Southern hemisphere. Despite the nature of the tidal tail split being presently unknown, astronomers have known that over time, many smaller galaxies have been torn apart or absorbed by our Milky Way Galaxy, as well as other galaxies in the Universe.

The movie (below) shows multiple streams produced by the disruption of the Sagittarius dwarf galaxy in the Milky Way halo. Our Sun is depicted by the orange sphere. The Sagittarius dwarf galaxy is in the middle of the stream. The area shown in the movie is roughly 200,000 parsecs (about 600,000 light-years.) Movie credit: S. Koposov and the SDSS-III collaboration.

If you’d like to learn more, you can read the full scientific paper at: arxiv.org

Source: SDSS press release, arXiv paper #1111.7042

Astronomers Discover Ancient ‘Ultra-Red’ Galaxies

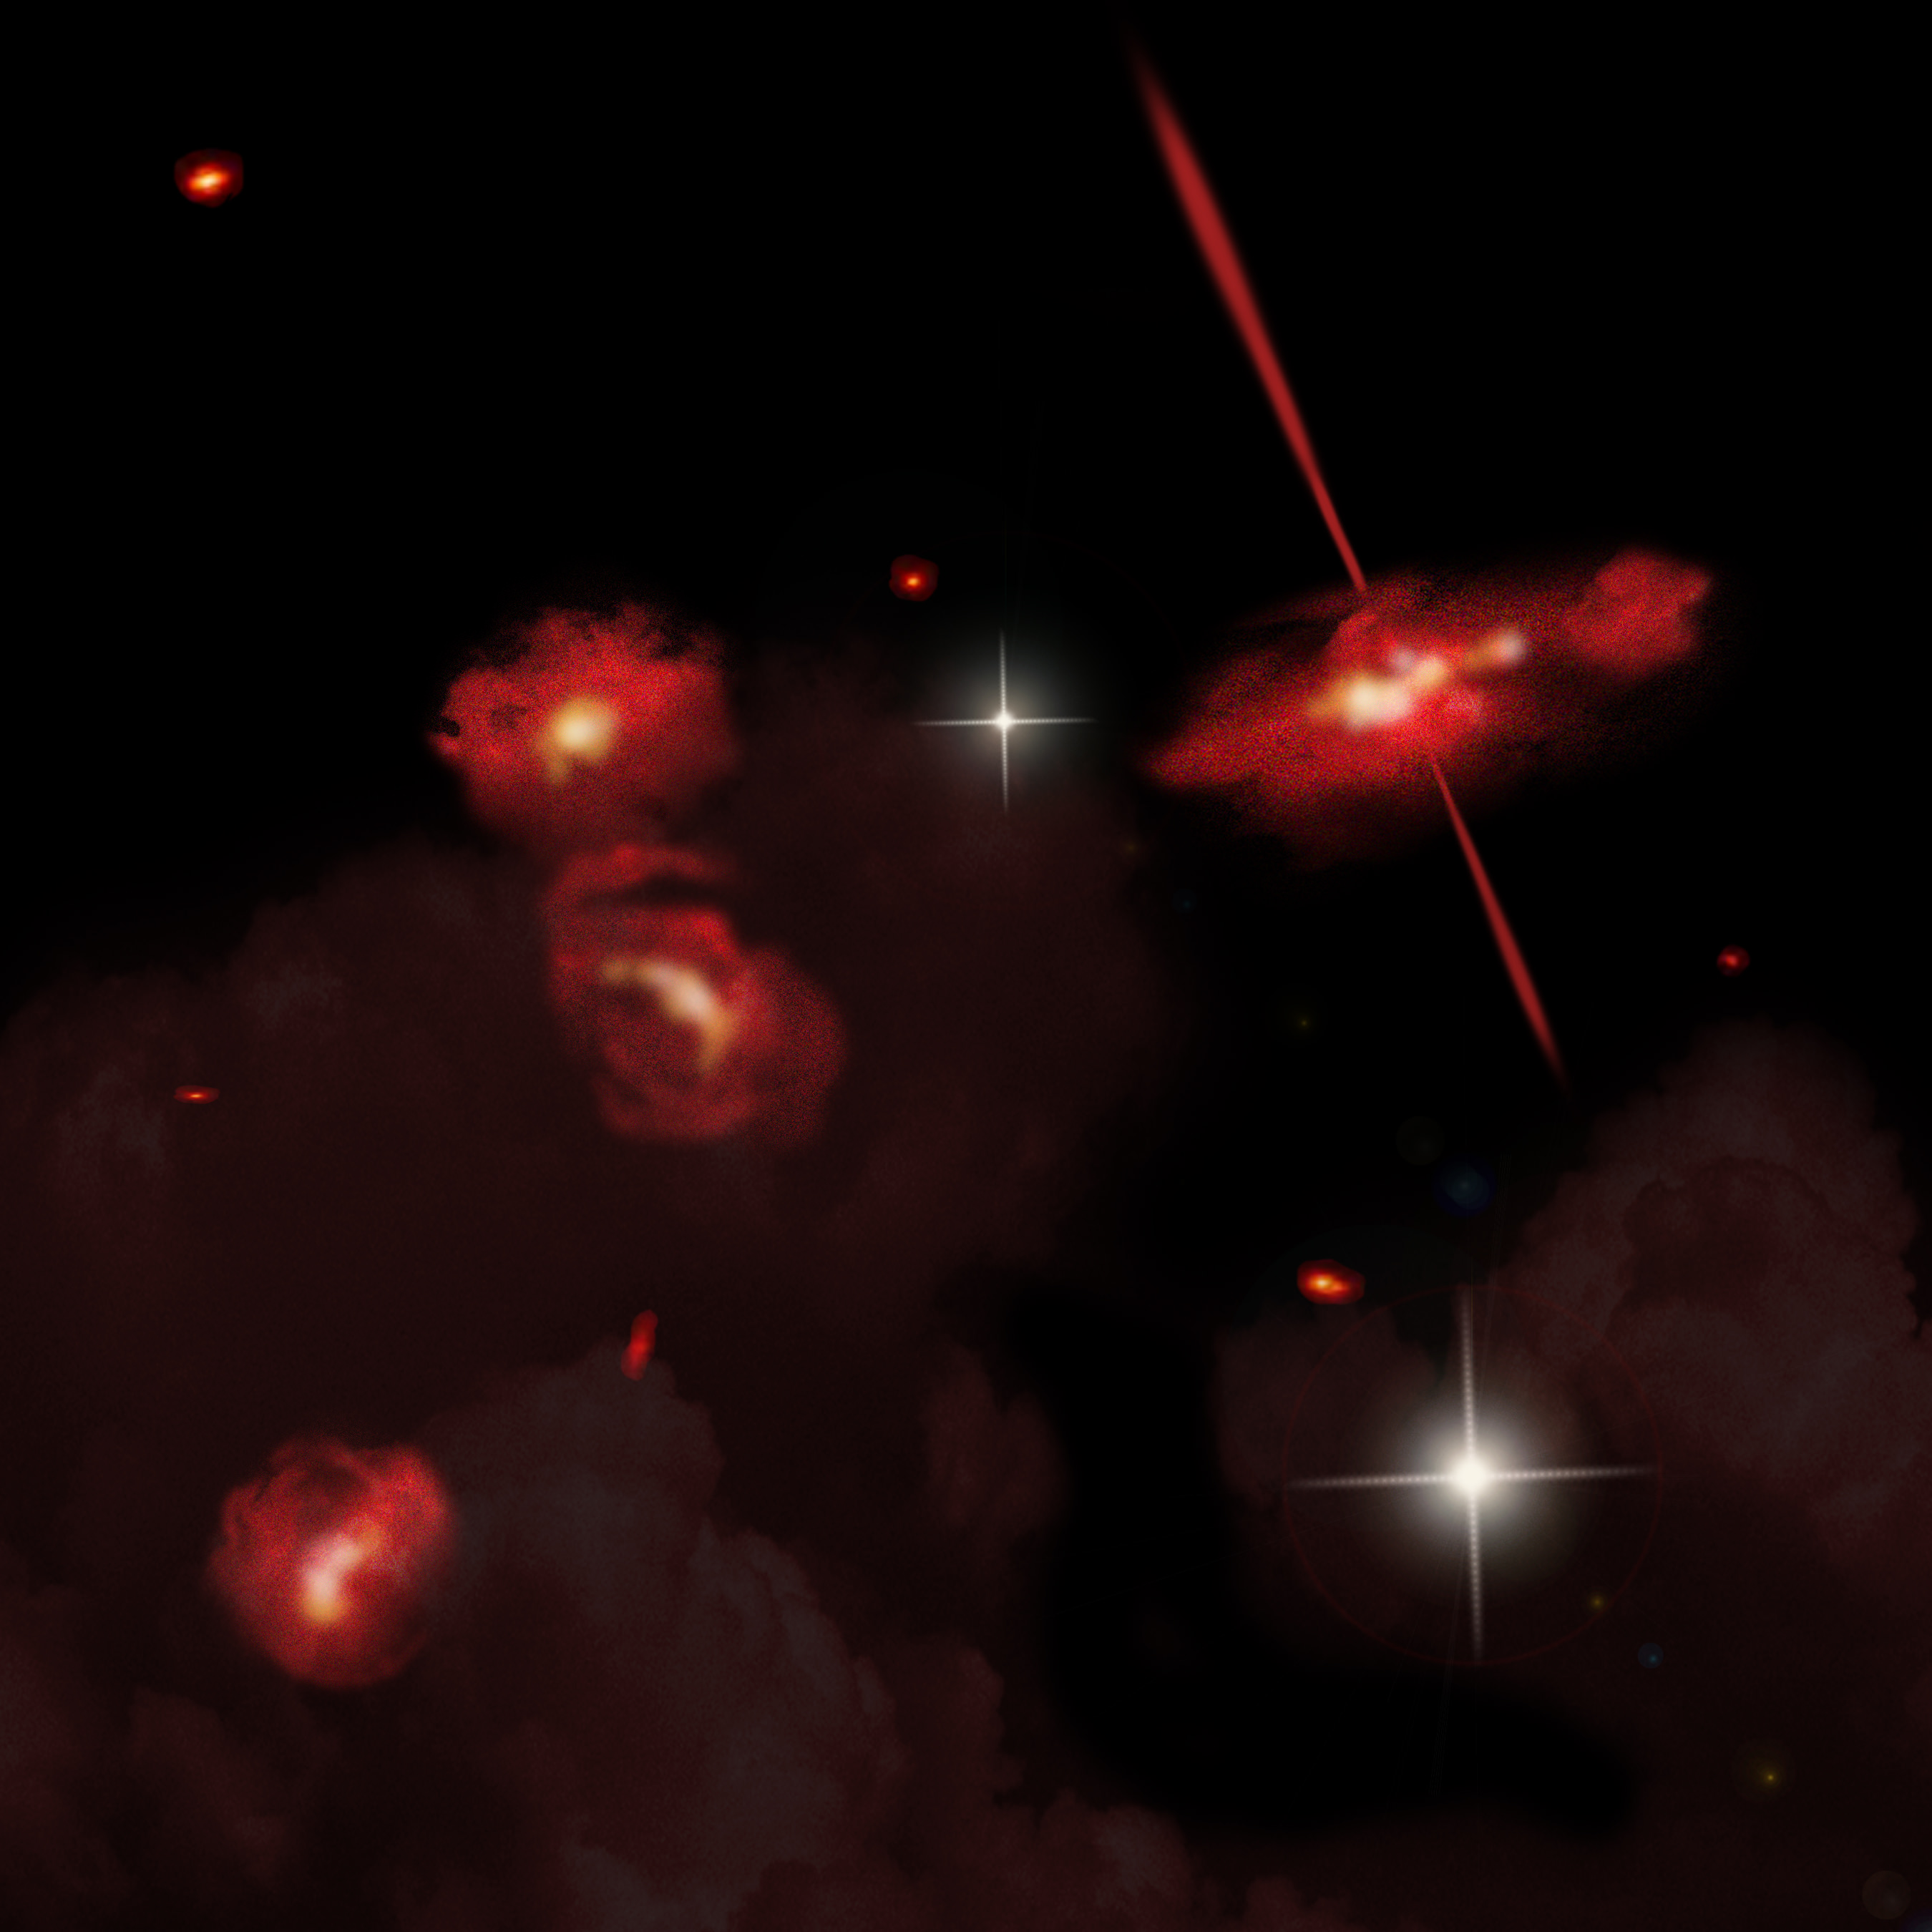
This artist's conception portrays four extremely red galaxies that lie almost 13 billion light-years from Earth. Discovered using the Spitzer Space Telescope, these galaxies appear to be physically associated and may be interacting. One galaxy shows signs of an active galactic nucleus, shown here as twin jets streaming out from a central black hole. Image Credit: David A. Aguilar (CfA)

[/caption]A team of astronomers, led by Jiasheng Huang (Harvard-Smithsonian Center for Astrophysics) using the Spitzer Space Telescope, have discovered four ‘Ultra-Red’ galaxies that formed when our Universe was about a billion years old. Huang and his team used several computer models in an attempt to understand why these galaxies appear so red, stating, “We’ve had to go to extremes to get the models to match our observations.”

The results of Huang’s research were recently published in The Astrophysical Journal

Using the Spitzer Space Telescope helped make the discovery possible, as it is more sensitive to infrared light than other space telescopes such as the Hubble. The newly discovered galaxies are sixty times brighter in the infrared than they are at the longest/reddest wavelengths HST can detect.

What processes are at work to create these extremely red objects, and why are they of interest to astronomers?

There are several reasons a galaxy could be reddened. For starters, extremely distant galaxies can have their light “redshifted” due to the expansion of the universe. If a galaxy contains large amounts of dust, it will also appear redder than a galaxy with less dust. Lastly, older galaxies will tend to be redder, due to a higher concentration of old, red stars and less younger bluer stars.

According to the paper, Huang and his team created three models to determine why these galaxies appear so red. Of their models, the one which suggests an old stellar population is currently the best fit to the observations. Supporting this conclusion, co-author Giovanni Fazio stated, “Hubble has shown us some of the first protogalaxies that formed, but nothing that looks like this. In a sense, these galaxies might be a ‘missing link’ in galactic evolution”.

Studying these extremely distant galaxies helps provide astronomers with a better understanding of the early universe, specifically how early galaxies formed and what conditions were present when some of the first stars were created. The next step in understanding these “ERO” galaxies is to obtain an accurate redshift for the galaxies, by using more powerful telescopes such as the Large Millimeter Telescope or Atacama Large Millimeter Array.

Huang and his team have plans to search for more galaxies similar to the four recently discovered by his team. Huang’s co-author Giovanni Fazio adds, “There’s evidence for others in other regions of the sky. We’ll analyze more Spitzer and Hubble observations to track them down.”

If you’d like to learn more, you can access the full paper (via arXiv.org) at: http://arxiv.org/pdf/1110.4129v1

Source: Harvard-Smithsonian Center for Astrophysics press release , arxiv.org

Cygnus X – A Cosmic-ray Cocoon

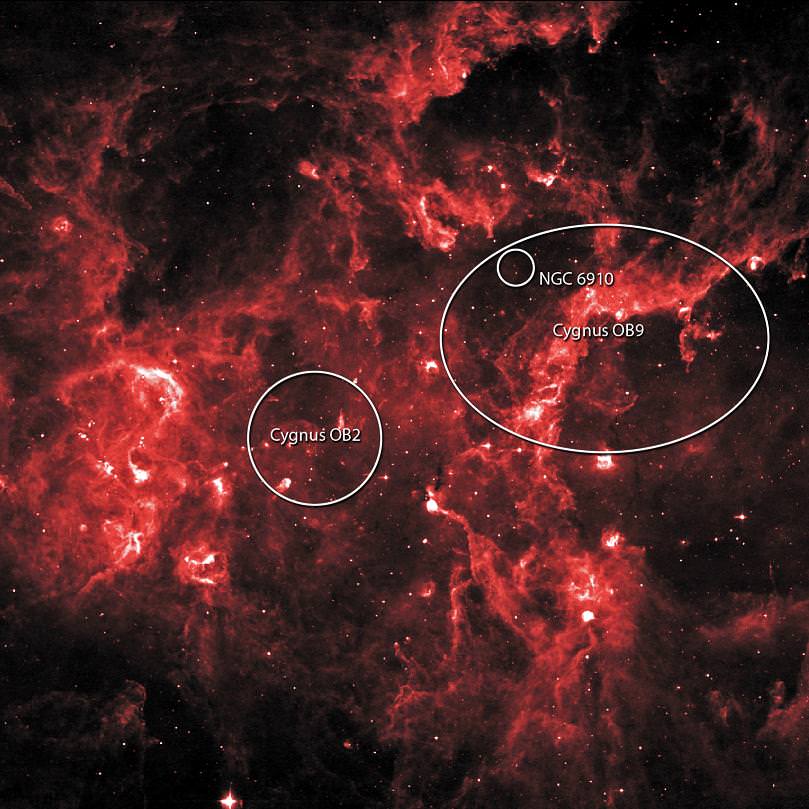
Cygnus X hosts many young stellar groupings, including the OB2 and OB9 associations and the cluster NGC 6910. The combined outflows and ultraviolet radiation from the region's numerous massive stars have heated and pushed gas away from the clusters, producing cavities of hot, lower-density gas. In this 8-micron infrared image, ridges of denser gas mark the boundaries of the cavities. Bright spots within these ridges show where stars are forming today. Credit: NASA/IPAC/MSX

[/caption]

Situated about 4,500 light-years away in the constellation of Cygnus is a veritable star factory called Cygnus X… one estimated to have enough “raw materials” to create as many as two million suns. Caught in the womb are stellar clusters and OB associations. Of particular interest is one labeled Cygnus OB2 which is home to 65 of the hottest, largest and meanest O-type stars known – and close to 500 B members. The O boys blast out holes in the dust clouds in intense outflows, disrupting cosmic rays. Now, a study using data from NASA’s Fermi Gamma-ray Space Telescope is showing us this disturbance can be traced back to its source.

Discovered some 60 years ago in radio frequencies, the Cygnus X region has long been of interest, but dust-veiled at optical wavelengths. By employing NASA’s Fermi Gamma-ray Space Telescope, scientists are now able to peer behind the obscuration and take a look at the heart through gamma ray observations. In regions of star formation like Cygnus X, subatomic particles are produced and these cosmic rays shoot across our galaxy at light speed. When they collide with interstellar gas, they scatter – making it impossible to trace them to their point of origin. However, this same collision produces a gamma ray source… one that can be detected and pinpointed.

“The galaxy’s best candidate sites for cosmic-ray acceleration are the rapidly expanding shells of ionized gas and magnetic field associated with supernova explosions.” says the FERMI team. “For stars, mass is destiny, and the most massive ones — known as types O and B — live fast and die young.”

Because these star types aren’t very common, regions like Cygnus X become important star laboratories. Its intense outflows and huge amount of mass fills the prescription for study. Within its hollowed-out walls, stars reside in layers of thin, hot gas enveloped in ribbons of cool, dense gas. It is this specific area in which Fermi’s LAT instrumentation excels – detecting an incredible amount of gamma rays.

“We are seeing young cosmic rays, with energies comparable to those produced by the most powerful particle accelerators on Earth. They have just started their galactic voyage, zig-zagging away from their accelerator and producing gamma rays when striking gas or starlight in the cavities,” said co-author Luigi Tibaldo, a physicist at Padova University and the Italian National Institute of Nuclear Physics.

Clocked at up to 100 billion electron volts by the LAT, these highly accelerated particles are revealing the extreme origin of gamma-ray emission. For example, visible light is only two to three electron volts! But why is Cygnus X so special? It entangles its sources in complex magnetic fields and keeps the majority of them from escaping. All thanks to those high mass stars…

“These shockwaves stir the gas and twist and tangle the magnetic field in a cosmic-scale jacuzzi so the young cosmic rays, freshly ejected from their accelerators, remain trapped in this turmoil until they can leak into quieter interstellar regions, where they can stream more freely,” said co-author Isabelle Grenier, an astrophysicist at Paris Diderot University and the Atomic Energy Commission in Saclay, France.

However, there’s more to the story. The Gamma Cygni supernova remnant is also nearby and may impact the findings as well. At this point, the Fermi team considers it may have created the initial “cocoon” which holds the cosmic rays in place, but they also concede the accelerated particles may have originated through multiple interactions with stellar winds.

“Whether the particles further gain or lose energy inside this cocoon needs to be investigated, but its existence shows that cosmic-ray history is much more eventful than a random walk away from their sources,” Tibaldo added.

Original Story Source: NASA Fermi News.

Positron Signaling For Dark Matter Inconclusive

The Fermi Gamma-ray Space Telescope (formerly called GLAST). Credit: NASA

[/caption]

A couple of years ago, the Payload for Antimatter Matter Exploration and Light-nuclei Astrophysics, PAMELA, sent us back some curious information… an overload of anti-matter in the Milky Way. Why does this member of the cosmic ray spectrum have interesting implications to the scientific community? It could mean the proof needed to confirm the existence of dark matter.

By employing the Fermi Large Area Telescope, researchers with the Kavli Institute for Particle Astrophysics and Cosmology (KIPAC) at Stanford University were able to verify the results of PAMELA’s findings. What’s more, by being in the high energy end of the spectrum, these abundances seem to verify current thinking on dark matter behavior and how it might produce positrons.

“There are various theories, but the basic idea is that if a dark matter particle were to meet its anti-particle, both would be annihilated. And that process of annihilation would generate new particles, including positrons.” says Stephan Funk, an assistant professor at Stanford and member of KIPAC. “When the PAMELA experiment looked at the spectrum of positrons, which means sampling positrons across a range of energy levels, it found more than would be expected from already understood astrophysics processes. The reason PAMELA generated such excitement is that it’s at least possible the excess positrons are coming from annihilation of dark matter particles.”

But there has been a glitch in what might have been a smooth solution. Current thinking has the positron signal dropping off when it reaches a specific level – a finding which wasn’t verified and led the researchers to feel the results were inconclusive. But the research just didn’t end there. The team consisting of Funk, Justin Vandenbroucke, a postdoc and Kavli Fellow and avli-supported graduate student Warit Mitthumsiri, came up with some creative solutions. While the Fermi Gamma-ray Space Telescope can’t distinguish between negatively charged electrons and positively charged positrons without a magnet – the group came up with their needs just a few hundred miles away.

Earth’s own magnetic field…

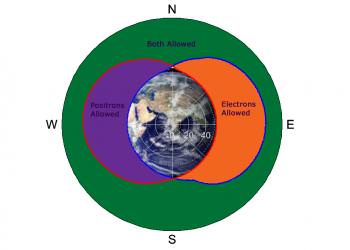
This illustration shows how the electron-positron sky appears to the Large Area Telescope. The purple region contains positrons while electrons are blocked by the Earth's bulk, the orange region contains electrons but is inaccessible to positrons, and the green region is completely out of the Earth's shadow for both positrons and electrons. Image courtesy Justin Vandenbroucke, Fermi-LAT collaboration.
That’s right. Our very own planet is capable of bending the paths of these highly charged particles. Now it was time for the research team to start a study on geophysics maps and figure out precisely how the Earth was sifting out the previously detected particles. It was a new way of filtering findings, but could it work?

“The thing that was most fun about this analysis for me is its interdisciplinary nature. We absolutely could not have made the measurement without this detailed map of the Earth’s magnetic field, which was provided by an international team of geophysicists. So to make this measurement, we had to understand the Earth’s magnetic field, which meant poring over work published for entirely different reasons by scientists in another discipline altogether.” said Vandenbroucke. “The big takeaway here is how valuable it is to measure and understand the world around us in as many ways as possible. Once you have this basic scientific knowledge, it’s often surprising how that knowledge can be useful.”

Oddly enough, they still came up with more than the expected amount of antimatter positrons as previously reported in Nature. But again, the findings didn’t show the theoretical drop-off that was to be expected if dark matter were involved. Despite these inconclusive results, it’s still a unique way of looking at difficult studies and making the most of what’s at hand.

“I find it to be fascinating to try to get the most out of an astrophysical instrument and I think we did that with this measurement. It was very satisfying that our approach, novel as it was, seemed to work so well. Also, you really have to go where the science takes you.” says Funk. “Our motivation was to confirm the PAMELA results because they are so exciting and unexpected. And as far as understanding what the Universe is actually trying to tell us here, I think it was important that PAMELA results were confirmed by a completely different instrument and technique.”

Original Story Source: Kavli Foundation News Release. For Further Reading: Measurement of separate cosmic-ray electron and positron spectra with the Fermi Large Area Telescope.