Rise of the PhoneSats

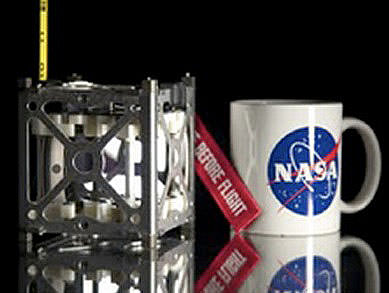
A Phonesat to scale. (Credit: NASA).

Satellites can now fit in the palm of your hand.

Known as Cubesats, several of these tiny but cost-effective payloads use off-the-shelf technology that you may currently carry in your pocket. In fact, engineers have put out a call for app designers to write programs for these tiny micro-satellites. Four of this new breed of satellites are part of the Antares A-One mission and another four are slated to launch tomorrow atop a Soyuz rocket from Plesetsk along with the Bion M-1 payload.

Yesterday’s launch of Orbital Sciences’ Antares rocket was scrubbed with minutes to go due to the premature retraction of an umbilical. Current plans call for a 48 hour turnaround with a new launch window opening Friday night on April 19th at 5:00 PM EDT/ 21:00 UT.

Cubesats are nothing new. As technology becomes miniaturized, so have the satellites that they’re contained in. Cubesats have even been deployed from the International Space Station.

The primary goal of the Antares A-One mission is to deploy a test mass into low Earth Orbit that simulates the Cygnus spacecraft. If all goes well, Cygnus is set to make its first flight to the ISS this summer.

But also onboard are the three unique payloads; the PhoneSat-1a, 1b & 1c cubesats and the Dove 1 cubesat.

As the name implies, the PhoneSat series of satellites are each constructed around a Nexus Smartphone and operate using Google’s very own Android operating system. The mission serves as NASA’s test bed for the concept. The phone system will monitor the orientation of the satellites. The PhoneSats will also use their off-the-shelf built-in cameras to take pictures of the Earth from orbit.

A separate watchdog circuit will reboot the phones if necessary. The PhoneSats are expected to last about a week in orbit until their batteries die. One of the PhoneSats is equipped with solar panels to test rechargeable technology for the platform.

Two of the nano satellites are built around a Samsung Nexus S and the other around a HTC Nexus Smartphone. The satellites will also use the SD card for info storage plus the 3-axis magnetometer and accelerometer incorporated into the phones for measurements and orientation.
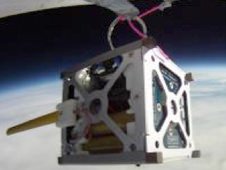
A PhoneSat 1.0 during a balloon test flight. (Credit: NASA).

Dove-1 will test a similar technology. It is built around a low-cost bus using off-the-shelf components. Each of the three PhoneSats cost less than $3,500 dollars U.S. to build.

Amateur radio operators will also be able to monitor the satellites as well. The PhoneSats will transmit at 437.425 MHz. Information will also available to track them in real time on the web once they’re deployed.

The two PhoneSat 1.0 satellites are dubbed Graham and Bell and will transmit every 28 and 30 seconds, and the one PhoneSat 2.0 satellite is named Alexandre and will transmit every 25 seconds.

The PhoneSat 2.0 series will also employ magnets that interact with the Earth’s magnetic field. A future application of this could include use of a PhoneSat for a possible heliophysics mission.

Although the Antares A-One mission is aiming to place the Cygnus test mass and the Cubesats in an inclination of 51.6° degrees similar to the ISS, it will not be following the ISS in its orbit and won’t present a hazard to the station.

The goal of NASA’s PhoneSat team based out of the Ames Research Center at Moffett Field California is to “release early and often.” Missions like Antares A-One present a unique opportunity for the teams to get “piggyback payloads” into orbit. To this end, NASA’s Cubesat Launch Initiative (CSLI) issues periodic calls for teams across the nation to make proposals and build tiny satellites.

Basic dimensions of a cubesat are 10x10x14 centimetres (for comparison, a CD jewel case is about 14×12 cm) and must weigh less than 1.33 kilograms for 1U, 2U & 3U variants. Up to 14kg is allowed for 6U models. Cubesats are deployed from a Poly-Picosatellite Deployer, or P-Pod.

Another set of cubesats is also slated to launch tomorrow from Plesetsk. The primary payload of the mission is deployment of the Bion M-1 biological research satellite. Bion M-1 will carry an assortment of organisms including lizards, mice and snails for a one month mission to study the effects of a long duration spaceflight on micro-organisms.

The Bion M-1 mission will also deploy the AIST microsatellite built by students of Samara Aerospace University, & BeeSats 2 & 3 provided by the Technical University of Berlin. A twin of the Dove-1 satellite launching on Antares named Dove-2 is also onboard.

One of the micro-satellites named OSSI-1 is of particular interest to backyard satellite trackers. Part of the Open Source Satellite Initiative, OSSI-1 was developed by radio amateur and artist Hojun Song. In addition to a Morse Code beacon, OSSI-1 will also contain a 44 watt optical LED beacon that will periodically be visible to observers on Earth.

Another similar project, FITSAT-1, has been tracked and imaged by observers in recent months. Follow the AmSat-UK website for predictions and visibility prospects of OSSI-1 after launch and deployment. FITSAT-1 has been visible with binoculars only, but OSSI-1 may just be visible to the unaided eye during shadow passes while it’s operational.

It will be interesting to watch these “home-brewed” projects take to orbit. The price tag and the technology is definitely within reach of a sufficiently motivated basement tinker or student team with an idea. Hey, how about the world’s first free-flying “Amateur Space Telescope?” Just throwing that out there!

 

Breathtaking Flyover of Greenland from NASA’s Operation IceBridge

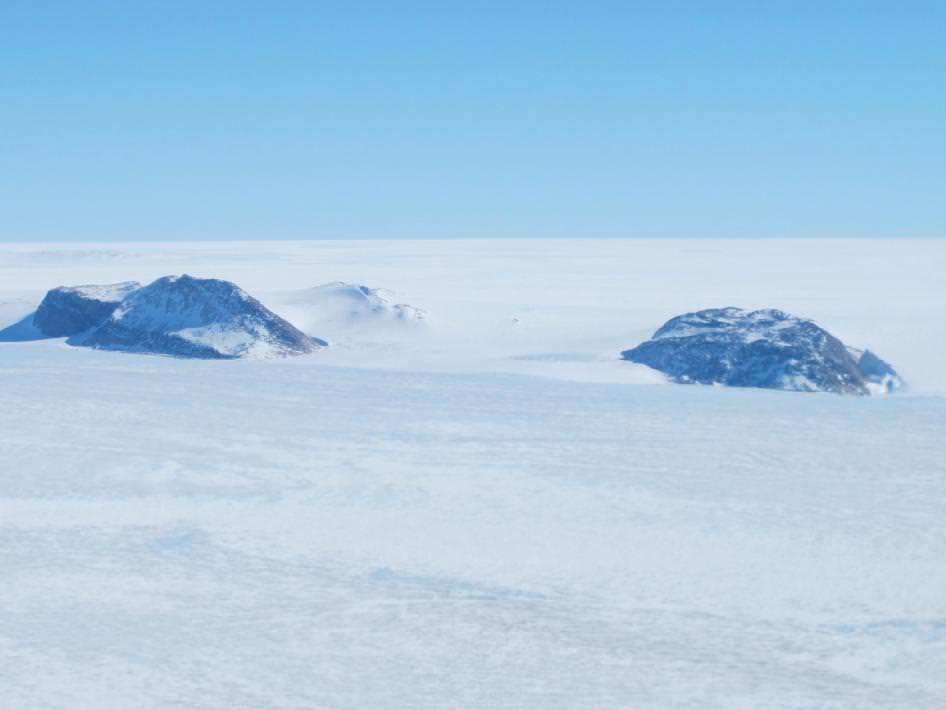
Nunataks in the western portion of the Greenland ice sheet seen from the NASA P-3B during an IceBridge survey of southwestern Greenland on Apr. 8, 2013. Nunataks are areas of exposed rock in an ice sheet such as ridges or mountain peaks. These jagged rock formations are sometimes used as landmarks on an ice sheet. Credit: NASA / Jim Yungel.

Here’s a view you don’t often see: Greenland’s glaciers from 500 meters above the ice. But this new video from NASA’s Operation IceBridge — recorded on April 9, 2013 — shows areas of southeast Greenland using a cockpit camera, revealing what the pilots see as they fly NASA’s P-3B airborne laboratory low over the Arctic. Following a glacier’s sometimes winding flow line gives IceBridge researchers a perspective on the ice not possible from satellites which pass in straight lines overhead. By gathering such data, IceBridge is helping to build a continuous record of change in the polar regions.

The plane allows researchers to images Earth’s polar ice in unprecedented detail to better understand processes that connect the polar regions with the global climate system. IceBridge utilizes a highly specialized fleet of research aircraft and the most sophisticated suite of innovative science instruments ever assembled to characterize annual changes in thickness of sea ice, glaciers, and ice sheets. In addition, IceBridge collects critical data used to predict the response of earth’s polar ice to climate change and resulting sea-level rise. IceBridge also helps bridge the gap in polar observations between NASA’s ICESat satellite missions.

Find out more about Operation IceBrige at their website.

Celebrate Earth Month with 2 New Videos from NASA

Nighttime photo of the Nile delta region taken from the ISS (NASA)

Enjoy some great views of our home planet from images taken from the orbiting Earth-observing satellites and taken by astronauts on the International Space Station. The satellites and scientists are cranking out data 24/7 to help us all better understand and sustain our home planet.

Above is a video created for Earth Month, and specifically Earth Day (April 22) from ISS imagery, and below is another video from satellite imagery. These are unique looks at the beauty and wonder of our home planet.


Some of the Best Images of Earth from Space

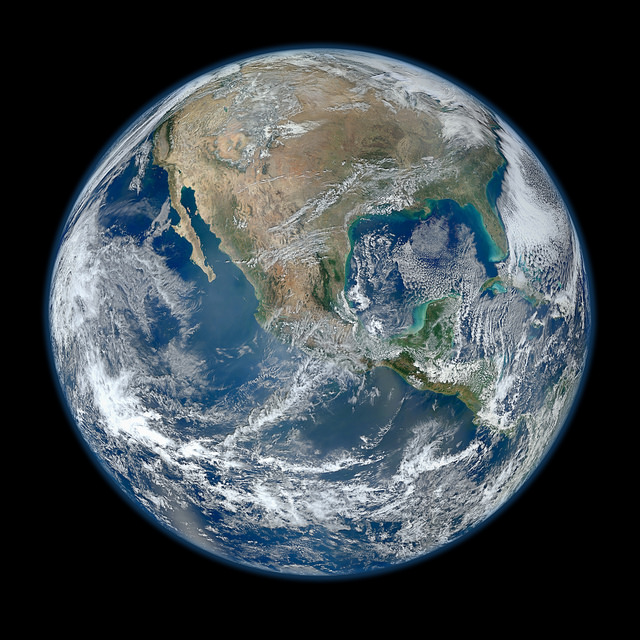
A 'Blue Marble' image of the Earth taken from the VIIRS instrument aboard NASA's most recently launched Earth-observing satellite - Suomi NPP. This composite image uses a number of swaths of the Earth's surface taken on January 4, 2012. Credit: NASA/NOAA/GSFC/Suomi NPP/VIIRS/Norman Kuring.

This video compilation from the Goddard Space Flight Center takes a look back at the best views of our planet from space in the last year, including true color satellite images, Earth science data visualizations, time lapses from the International Space Station, and computer models.

Earth Month: NASA Launches New Interactive Image Gallery

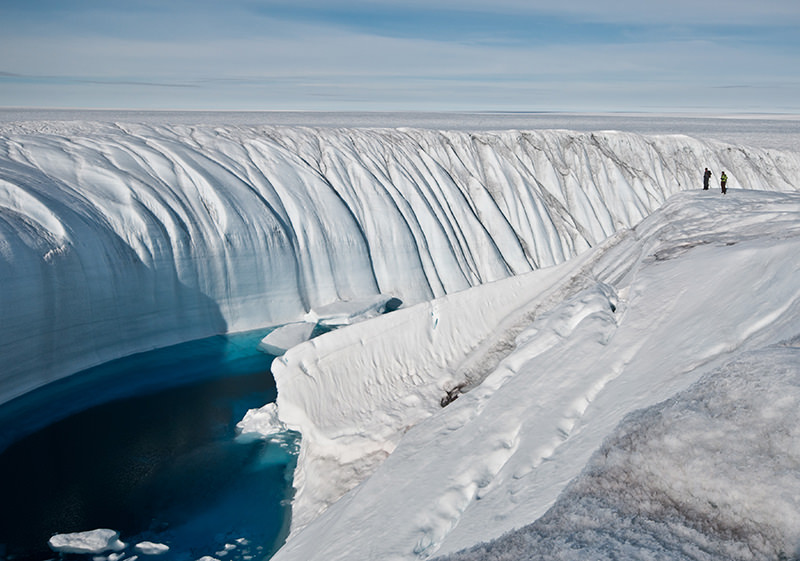
Ice sheet loss increasing at both poles. Image credit: Ian Joughin, University of Washington.

In honor of Earth month, NASA has launched a beautiful new interactive image gallery that explores and highlights our latest understanding of Earth science and our changing planet. Included are spectacular images and visualizations to help understand the latest findings.

Included is information on the decline of sea ice in the Arctic, a visualization of global aerosols, images of the latest storms, and much more.

Check out the “Earth Month 2013” website.

Astronaut Photos Create a Map of the World

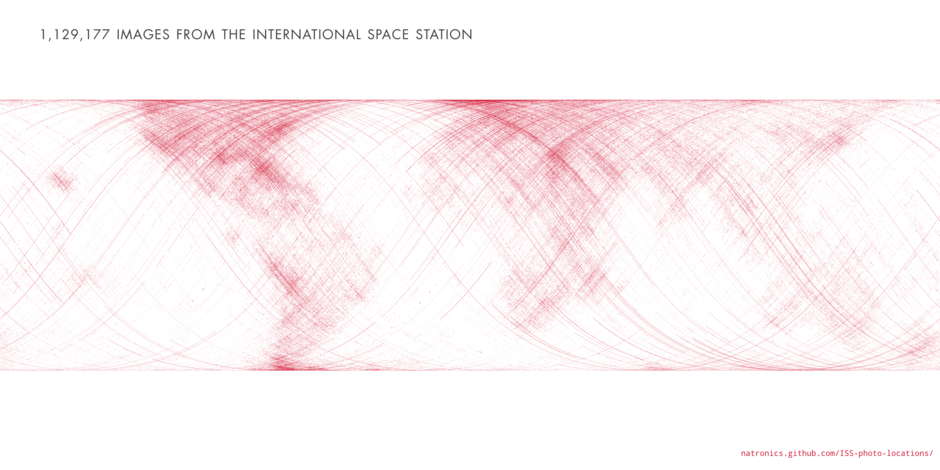
A map of the world made up of the locations of ISS astronaut photos (Nathan Bergey/open.nasa.gov)

If you could spend a few months — or even a few days — living aboard the ISS, what would you take pictures of? Earth, most likely, with your favorite landforms and your family’s and friends’ hometowns ranking high on the list. After a while, I’m sure plenty of other Earthly features would become photo targets — weather, aurorae, world cities at night, etc. — but ultimately, over the course of your stay in orbit, you would be able to see a trend in the pictures you take, and where you took them.

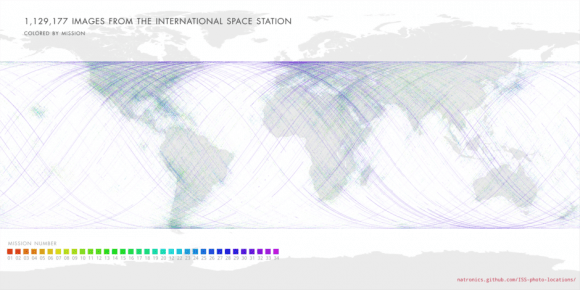
And over the span of 35 missions across more than 12 years, the graph above shows the trend of all the astronauts’ pictures. Look familiar?

Nighttime photo of the Nile delta region taken from the ISS (NASA)

Created by open-source NASA data aficionado Nate Bergey, the image above is a map made up of  over a million points (1,129,177, to be exact) each representing the global coordinates of an JSC-archived photograph taken from the ISS.

Clearly the continents are astronauts’ favored photo subjects, with the populous urban areas of North America, Europe,  Egypt and the Middle East, as well as the western and southern coasts of South America standing out.

“This makes sense, photos of clouds over an otherwise blank ocean get old after a while,” Nate Bergey wrote on his blog, open.nasa.gov. “I’m sure every astronaut has taken at least one photograph of the town they grew up in.”

Of course, the map doesn’t create an image of the entire globe. This is because the points denote actual over-ground coordinates of the Station (not necessarily what the photos themselves are of) and “the ISS stays between about 50° and -50° latitude as it orbits the Earth,” as noted by Bergey.

A map of the world with the points overlaid onto it, color-coded by mission, shows the difference:

all_iss_missions_map.preview

Bergey also notes the proliferation of purple-colored dots… these indicate the hundreds of images taken by NASA astronaut Don Pettit during Expedition 30/31, when he created incredible time-lapse videos of the Earth from the ISS.

One of many long-exposure images taken by Don Pettit aboard the ISS (NASA/JSC). See more here.

With such a unique and lofty perspective of our world, it’s no wonder that astronauts spend so much time snapping photos — I can’t say I’d be able to tear myself away from the window myself! Read more about Nate Bergey’s project and how he created his map on his open.NASA blog here.

Weird Cloud ‘Coils’ Captured by Earth-Observing Satellite

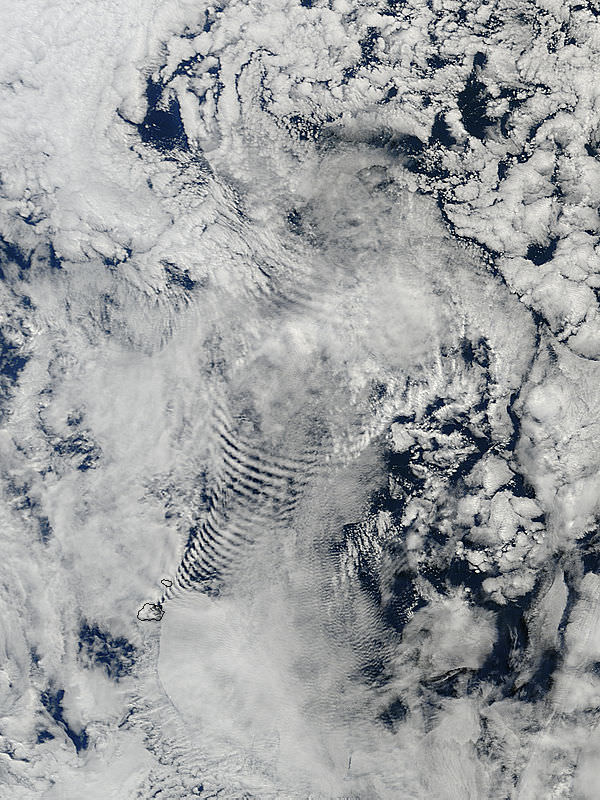
Coil-like shapes in clouds, created by their passage over the Prince Edward Islands in the south Indian Ocean. Credit: NASA/Terra/MODIS.

These are some of the strangest looking clouds I’ve seen from the fleet of Earth-observing satellites. These coil-like or bow-wave-shaped clouds were created by the clouds passing over the Prince Edward Islands, in the south Indian Ocean. It was taken by the Terra satellite with the MODIS instrument (Moderate Resolution Imaging Spectroradiometer) on March 26, 2013.

Update: Vitaliy Egorov from the Russian website allmars.net has sent us an animation of these coil clouds as seen by the Russian satellite Elektro-L:

Animation is made up of 17 frames made satellite “Electro-L” from 12:30 to 20:30 GMT March 26, 2013 at 1 frame per 30 minutes. Photo: Roscosmos / NTSOMZ / Electro-L / allmars.net.

The images are taken from a different angle than the Terra satellite. You can see more at Egorov’s website.

NASA says MODIS is playing a vital role in the development of validated, global, interactive Earth system models able to predict global change accurately enough to assist policy makers in making sound decisions concerning the protection of our environment.

NASA’s Operation IceBridge Surveys Greenland and Earth’s Polar Ice Sheets

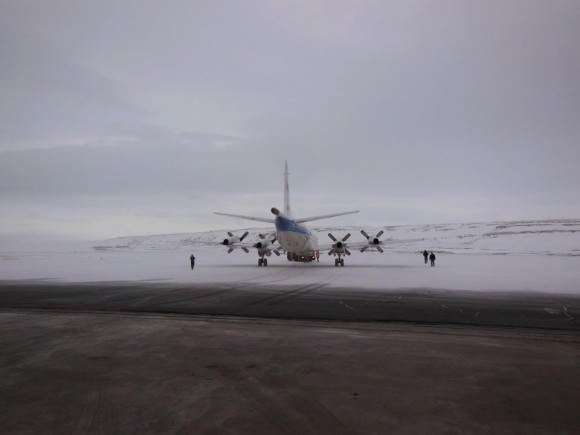
NASA P-3B waits outside the hangar at Thule Air Base with the Greenland Ice sheet in the background. The aircraft is set to begin the 2013 season of NASA’s Operation IceBridge mission to survey Earth's polar ice sheets in unprecedented three-dimensional detail. The plane just arrived from NASA Wallops Flight Facility in Virginia - see my P-3B photos below. Credit: NASA/Goddard/Michael Studinger

NASA’s Operation IceBridge has begun the 2013 research season of Ice Science flights in Greenland and the Arctic to survey the regions ice sheets and land and sea ice using a specially equipped P-3B research aircraft from NASA’s Wallops Flight Facility in Wallops Island, Va.

Operation IceBridge began in 2009 as part of NASA’s six-year long effort to conduct the largest airborne survey of Earth’s polar ice ever flown.

The goal is to obtain an unprecedented three-dimensional, multi-instrument view of the behavior of Greenland, Arctic and Antarctic ice sheets, ice shelves and sea ice which have been undergoing rapid and dramatic changes and reductions.

“We’re starting to see how the whole ice sheet is changing,” said Michael Studinger, IceBridge project scientist at NASA’s Goddard Space Flight Center in Greenbelt, Md. “Thinning at the margins is now propagating to the interior.”

The P-3 exiting the hanger pre-flight in Thule. Credit: NASA

The airborne campaign was started in order to maintain a continuous record of measurements in changes in polar ice after NASA’s Earth orbiting ICESat (Ice, Cloud and Land Elevation Satellite) probe stopped collecting data in 2009.

ICESat-2 won’t be launched until 2016, so NASA’s IceBridge project and yearly P-3 airborne campaigns will fill in the science data gap in the interval.

The P-3B Orion just arrived from NASA’s Wallops Flight Facility in Virginia where I visited it before departure – see my P-3B photos herein.

NASA IceBridge P-3B research aircraft prepares for departure from runway at NASA Wallops Flight Facility in Virginia to Thule Air Base in Greenland.  Credit: Ken Kremer (kenkremer.com)
NASA IceBridge P-3B research aircraft prepares for departure from runway at NASA Wallops Flight Facility in Virginia to Thule Air Base in Greenland. Credit: Ken Kremer (kenkremer.com)

IceBridge is operating out of airfields in Thule and Kangerlussuaq, Greenland, and Fairbanks, Alaska.

The P-3B survey flights over Greenland and the Arctic will continue until May. They are conducted over Antarctica during October and November.

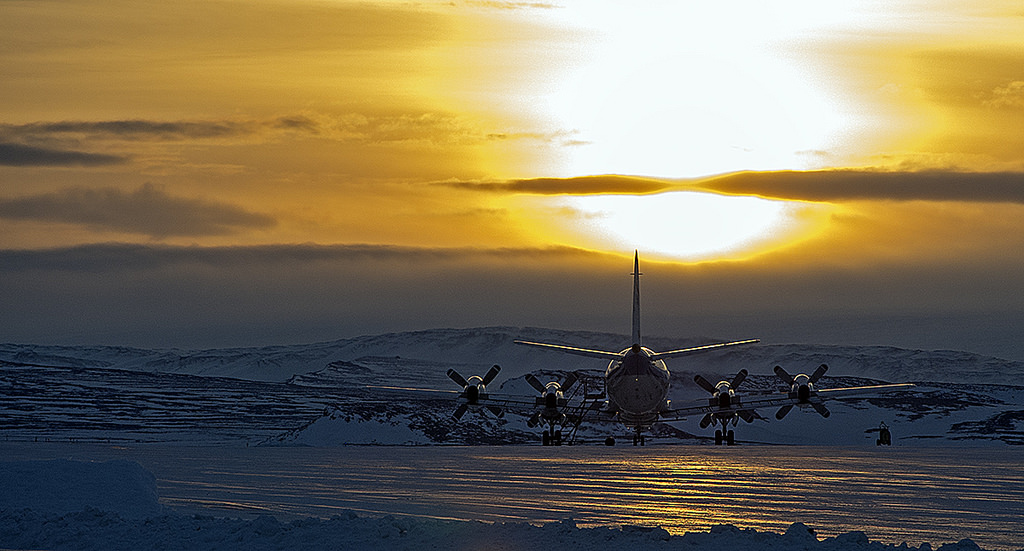
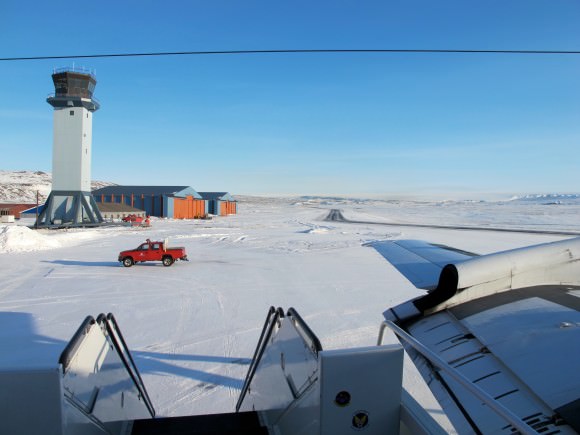
A sunny view of the ramp at Thule Air Base, Greenland, shortly after the NASA P-3B research aircraft arrived on Mar. 18, 2013. Credit: NASA / Jim Yungel

The measurements collected by IceBridge instruments will characterize the annual changes in thickness of sea ice, glaciers, and ice sheets. The data are used to help predict how climate change affects Earth’s polar ice and the resulting rise in sea-levels.

Researchers with the U.S. Army Corps of Engineers are collaborating with the IceBridge project to collect snow depth measurements near Barrow , Alaska. High school science teachers from the US, Denmark and Greenland will fly along on the P-3B survey flights to learn about polar science.

NASA Wallops has a wide ranging research and development mission and is home to the Virginia launch pad for the new Antares/Cygnus commercial ISS resupply rocket set for its maiden launch in mid April 2013; detailed in see my new story – here.

Ken Kremer

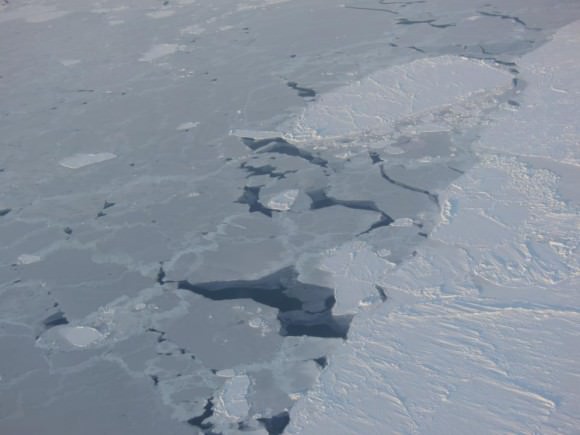
Sea ice in the southern Beaufort Sea. Credit: NASA
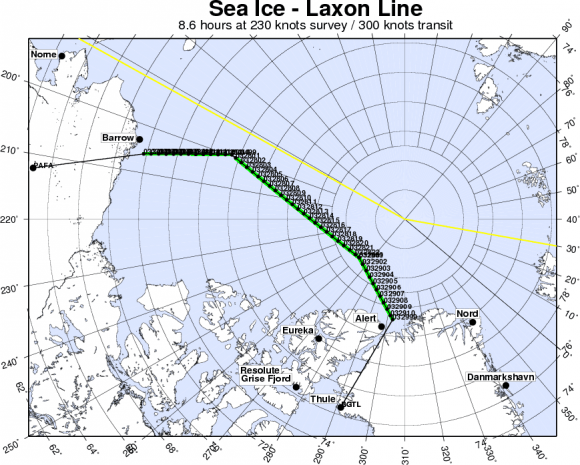
IceBridge departing to Fairbanks to start their sea ice flights that will cover the Beauford and Chukchi seas - via the Laxon sea ice route for the transit. Credit: NASA
IceBridge departing to Fairbanks to start their sea ice flights that will cover the Beauford and Chukchi seas – via the Laxon sea ice route for the transit. Credit: NASA

‘First Light’ Image for Telescope on the International Space Station

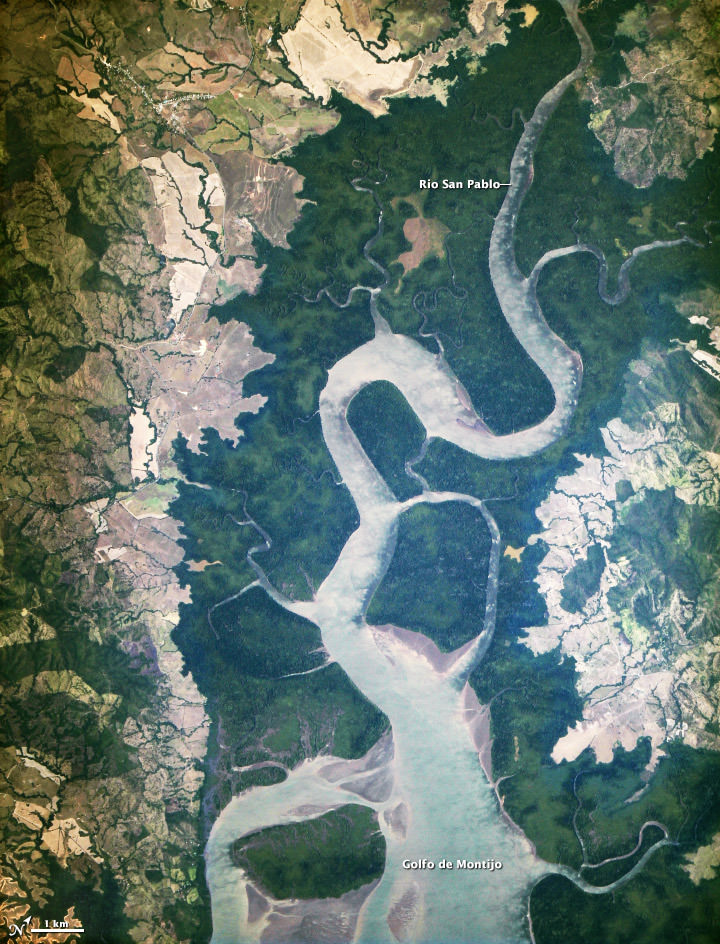
The first light from the new ISERV camera system, taken on February 16, 2013 shows the Rio San Pablo as it empties into the Golfo de Montijo in Veraguas, Panama. NASA image by Burgess Howell, SERVIR Global program.

As we reported in January, a new telescope was installed on the International Space Station – not to observe the stars, but instead look back to Earth to acquire imagery of specific areas of the world for disaster analysis and environmental studies. Called ISERV (International Space Station SERVIR Environmental Research and Visualization System), it has now taken its first image. Above is the “first light” from the new ISERV, taken at 1:44 p.m. local time on February 16, 2013.

No, this is not a giant tree trunk! It is the Rio San Pablo as it empties into the Golfo de Montijo in Veraguas, Panama.


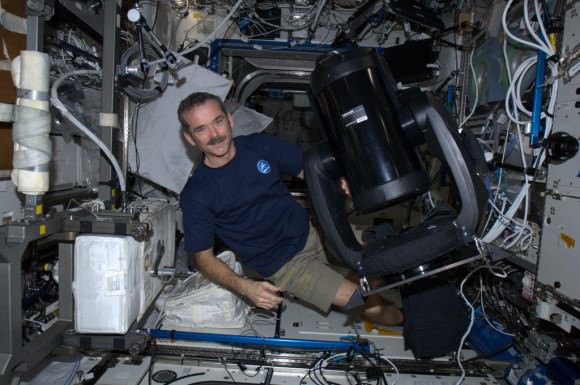
The telescope is a modified off-the-shelf Celestron telescope, the Celestron CPC 925, a 9.25? diffraction limited Schmidt-Cassegrain telescope and if you were to buy a un-modified version, it would cost $2,500 including the mount.

The ISERV version was modified at the Marshall Space Flight Center, which is where it is controlled from, as well. It is installed in the Window Observational Research Facility (WORF) in the station’s Destiny laboratory. With a resolution down to 3.2 meters (10 feet), it will be possible to spot fairly small details and objects.

Canadian astronaut Chris Hadfield with the new ISERV (International Space Station SERVIR Environmental Research and Visualization System), a modified Celestron telescope for Earth observation. Credit: NASA/CSA

This ISERV Pathfinder is intended as an engineering exercise, with the long-term goal of developing a system for providing imagery to developing nations as they monitor natural disasters and environmental concerns.

“ISERV’s full potential is yet to be seen, but we hope it will really make a difference in people’s lives,” said principal investigator Burgess Howell of NASA’s Marshall Space Flight Center. “For example, if an earthen dam gives way in Bhutan, we want to be able to show officials where the bridge is out or where a road is washed out or a power substation is inundated. This kind of information is critical to focus and speed rescue efforts.”

The system will use on positioning software to know where the space station is at each moment and to calculate the next chance to view a particular area on the ground. If there’s a good viewing opportunity, the SERVIR team will instruct the camera to take high-resolution photographs at 3 to 7 frames per second, totaling as many as 100 images per pass.

The current mission will test the limitations of this ISERV system and identify measures for improvements in a more permanent system. For instance, the engineering team is working to determine how the geometry of the ISS window affects the imagery; how much sunlight is needed to capture clear images; and how the atmosphere affects that clarity. This characterization phase will last several weeks to a few months. Eventually, ISERV should be made available to the natural hazards community and to basic research scientists.

Source: NASA Earth Observatory

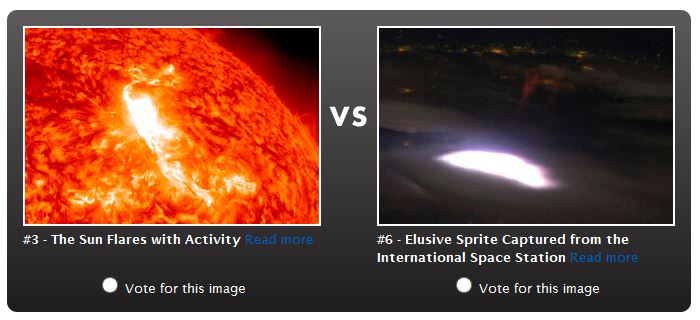
It’s Earth Madness! Vote for Your Favorite Images of Our Home Planet

Screenshot of one of the competing images in the Earth Madness competition bracket.

NASA’s Earth Observatory website has decided to join in on the bracketology fever that overtakes many US citizens during the month of March … but with science and not basketball. Instead of March Madness, it’s EARTH MADNESS! From March 4 through April 5, Earth Observatory fans can vote for their favorite images of the year. There are thirty-two images vying for the title, but only one can be the winner. This will be a head-to-head competition, whittling the total from 32 to 16 to 8 to 4 to 2 in a tournament of remote sensing science. The competition will be stiff in the four brackets — Earth at Night, Events, Data, and True-Color — so it is up to you to separate the winners from the losers. Check back each week to vote in the next round and help choose a winner.

Print a copy of the bracket, fill it out, and get that workplace pool going. Come back every Monday to vote and watch the results.