Stunning View from Orbit: Dramatic Volcanoes at Dawn

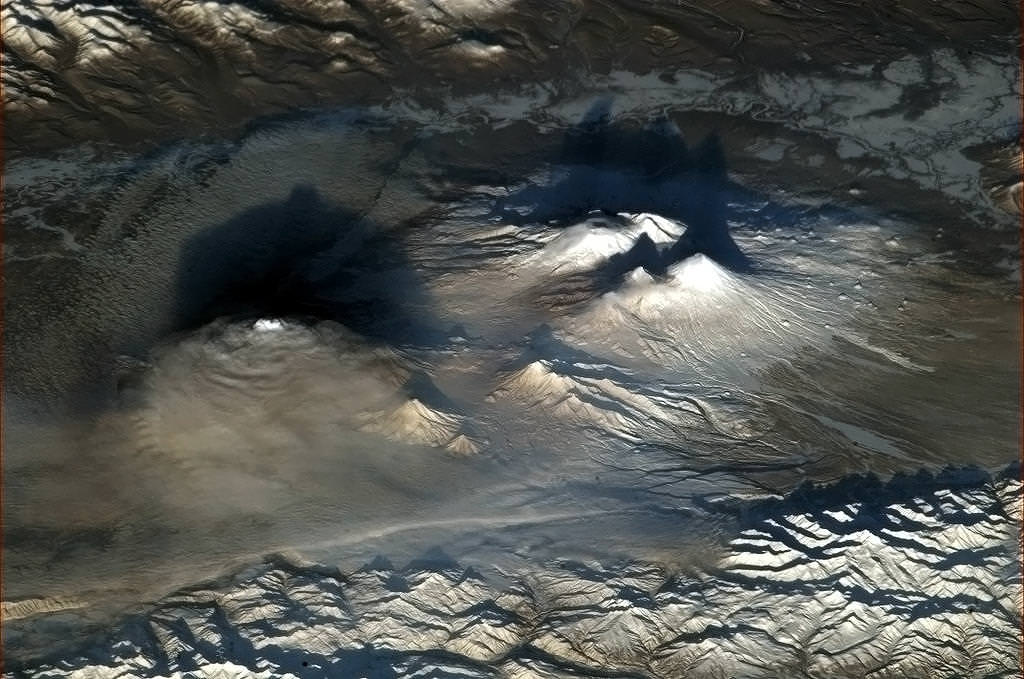
Volcanoes of Kamchatka, Russia at dawn, as seen from the International Space Station. Credit: NASA/CSA/Chris Hadfield

A stunning view from orbit! Astronaut Chris Hadfield captured this shot of the volcanoes of Kamchatka in Russia. “Volcanoes look dramatic at dawn,” Hadfield said via Twitter. “They startled me when I spotted them through the lens.”

Note the huge shadows created by the Sun, which is low on the horizon at dawn.

These are just a few of the 160 volcanoes on the Kamchatka Peninsula in the far eastern part of Russia. 29 of the 160 are active. Thanks to Peter Caltner on Twitter who identified the volcanoes seen here: Tolbachik (at left, in clouds and smoke plume, active presently); Ushkovsky (in the back, right); Kliuchevskoi (right edge, the peak in front). Little ones in the foreground: Udina (left) and Zimina (right).

These jagged peaks are obviously an eye-catching landmark from orbit, as they have been a target of observations before — by Yuri Malenchenko in November of 2012 and by Clay Anderson in December of 2011.

What Earth Looked like on 12/12/12

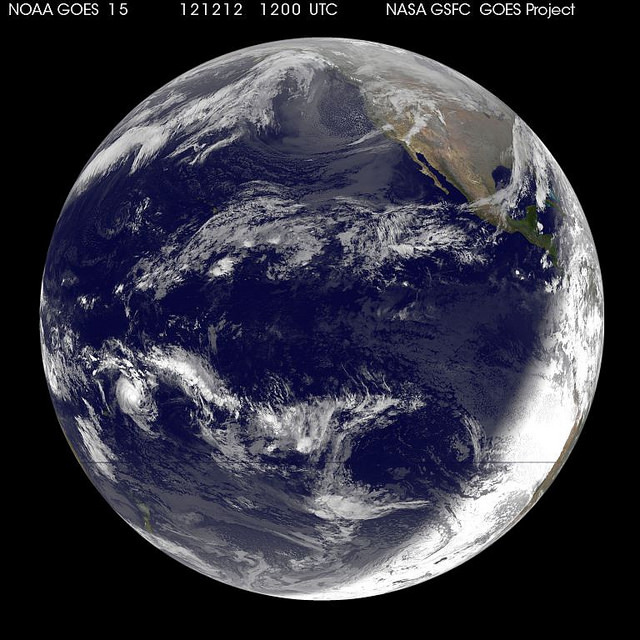
Earth, as seen by the GOES15 satellite on December 12, 2012. Credit: NASA/NOAA GOES Project/Dennis Chesters

Although we don’t subscribe to hokum like numerology or think that dates on a man-made calendar could have any sort of cosmic significance, there is something about a little symmetry. The GOES-15 satellite captured this image of Earth today, which is 12/12/12 on the Gregorian calendar, and even added a bonus of taking the image at 1200 UTC.

Too bad the GOES-12 spacecraft had some thruster problems and is currently in a standby mode.

Dennis Chesters, project scientist of NASA’s GOES Project at the NASA Goddard Space Flight Center said this image does something significant, however: the fourth tropical cyclone in the southern Pacific Ocean. Newborn Tropical Storm Evan was born today, Dec. 12, 2012 at 1500 UTC (10 a.m. EST) and appears as a rounded area of clouds in the bottom left corner of the image. Tropical Storm Evan is about 145 nautical miles west of Pago Pago, American Samoa.

See a larger version of this image here.

“Overview:” The Perspective-Altering Effect of Seeing Earth from Space

For over 40 years, the ‘Blue Marble’ images of Earth taken from space have provided a new perspective of our planet, and the sometimes life-altering experience of such views was described in Frank White’s book “The Overview Effect,” published in 1987. When it came out, I gobbled it up, and have since read it several times.

Today, on the 40th anniversary of the final launch of the Apollo missions to the Moon, a new short film “Overview” has been released, which explores this phenomenon through interviews with five astronauts who have experienced first-hand seeing Earth from space.

“This view of the Earth from space – the whole Earth perspective – is, I think, the true symbol of this age,” says White in the film. “I believe … there’s going to be a greater and greater interest in communicating this idea because, after all, it’s key to our survival. We have to start acting as one species with one destiny. We are not going to survive if we don’t do that.”

The film is an inspiring look at how exploring space has given us look back at our own world and changed our perceptions. While some may say the Overview Effect is only a concept, an ideal outcome of space exploration that has yet to become a global phenomenon, I believe it is certainly something we should strive for.

The Blue Marble image from Apollo 17. Credit: Image courtesy NASA Johnson Space Center. See more info about it here.

The film includes:
Edgar Mitchell – Apollo 14 astronaut and founder of the Institute of Noetic Sciences
Ron Garan – ISS astronaut and founder of humanitarian organization Fragile Oasis
Nicole Stott – Shuttle and ISS astronaut and member of Fragile Oasis
Jeff Hoffman – Shuttle astronaut and senior lecturer at MIT
Shane Kimbrough – Shuttle/ISS astronaut and Lieutenant Colonel in the US Army
Frank White – space theorist and author of the book ‘The Overview Effect’
David Loy- philosopher and author
David Beaver – philosopher and co-founder of The Overview Institute

It was produced by a group called Planetary Collective, specifically Guy Reid, Steve Kennedy and Christopher Ferstad.

OVERVIEW from Planetary Collective on Vimeo.

The Black Marble: Stunning New Orbital Views of Earth at Night

This image of Asia and Australia at night is a composite assembled from data acquired by the Suomi NPP satellite in April and October 2012. Credit: NASA, NOAA, and the Department of Defense.

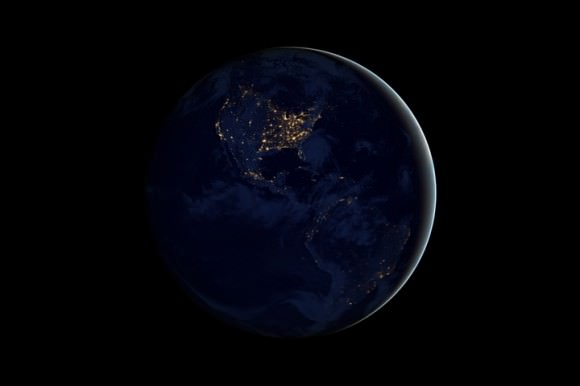
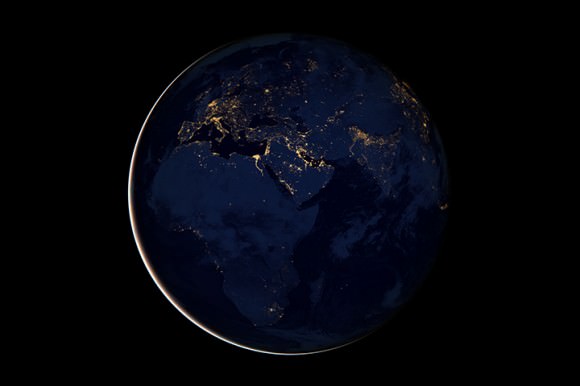
Two months of night-time imagery gathered by the Suomi NPP satellite have resulted in a stunning new look at Earth at night, appropriately nicknamed the Black Marble.

The nighttime views were made possible by the new satellite’s “day-night band” of the Visible Infrared Imaging Radiometer Suite. VIIRS detects light in a range of wavelengths from green to near-infrared and uses filtering techniques to observe dim signals such as city lights, gas flares, auroras, wildfires, and reflected moonlight. In this case, auroras, fires, and other stray light have been removed to emphasize the city lights.

“This is not your father’s low light sensor!” said Steve Miller, senior research scientist and deputy director of the Cooperative Institute for Research in the Atmosphere (CIRA), Colorado State University, speaking at the American Geophysical Union conference this week.

See more views and a video presentation of the VIIRS data below:

The new satellite is providing a much higher resolution across a greater band of light than previous night-light gathering satellites.

Originally developed for meteorologists to be able to look at nighttime clouds, the VIIRS data is providing a wide variety of information. “We are getting as much mileage from these data sets as we can,” said Chris Elvidge, who leads the Earth Observation Group at NOAA’s National Geophysical Data Center.

Elvidge and Miller said the data is being used to model population distribution, fossil fuel and CO2 emissions, and other information that can be gleaned from nighttime lights such finding power outages, determining astronomical viewing conditions, providing site selection for astronomical observatories, and looking at impacts of artificial lights on humans and animals.

The difference between electrical lights and fires, and night glow and auroras can even be determined by VIIRS.

North and South America at night is a composite assembled from data acquired by the Suomi NPP satellite in April and October 2012. Credit: NASA, NOAA, and the Department of Defense.

Europe, Africa, and the Middle East at night is a composite assembled from data acquired by the Suomi NPP satellite in April and October 2012. Credit: NASA, NOAA, and the Department of Defense.

Named for satellite meteorology pioneer Verner Suomi, NPP flies over any given point on Earth’s surface twice each day at roughly 1:30 a.m. and p.m. The polar-orbiting satellite flies 824 kilometers (512 miles) above the surface, sending its data once per orbit to a ground station in Svalbard, Norway, and continuously to local direct broadcast users distributed around the world,
.

See more imagery and get additional information about the night-time VIIRS Data at the NASA Earth Observatory website.

GOCE – How Low Can It Go?

Caption: GOCE over ice. Credits: ESA – AOES Medialab

Since March 2009, the European Space Agency (ESA) mission, Gravity field and steady-state Ocean Circulation Explorer (GOCE) has been orbiting Earth. It carries highly sensitive instrumentation able to detect tiny variations in the pull of gravity across the surface of the planet, allowing it to map our planet’s gravity with unrivaled precision, producing the most accurate gravity map of Earth. With the planned mission completed, the fuel consumption has been much lower than anticipated, enabling ESA to extend GOCE’s life and put it into an even lower orbit, improving the quality of the gravity model.

The GOCE spacecraft was designed to fly low and has spent most of its mission roughly 500km below most other Earth-observing missions, at an altitude of 255km. ESA’s Earth Scientific Advisory Committee recommended lowering the orbit by 20km at a rate of about 300m per day, starting in August. After coming down by 8.6 km, the satellite’s performance and orbit were assessed. Now, GOCE is again being lowered while continuing its gravity mapping. It is expected to reach 235 km by February.

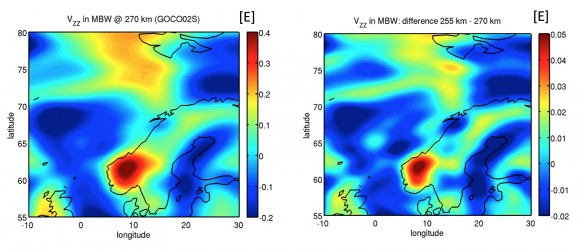
Decreasing the altitude increases the spatial resolution and the precision of the data. The expected increase in data quality is so high (possibly 35%) that scientists are calling it GOCE’s ‘second mission. Volker Liebig, ESA’s Director of Earth Observation Programmes has said “What the team of ESA engineers is now doing has not been done before and it poses a challenge. But it will also trigger new research in the field of gravity based on the high-resolution data we are expecting.”

Caption: The image on the left shows GOCE’s gravity measurements over northern Europe, acquired from its previous altitude. The image on the right depicts the expected measurements over the same area after the satellite has been lowered. Credits: ESA / GOCE+ Theme 2

The first ‘geoid’ based on GOCE’s gravity measurements was unveiled in June 2010. It is a crucial reference for conducting precise measurements of ocean circulation, sea-level change and ice dynamics. The mission has also been studying air density and wind in space, and its data was recently used to produce the first global high-resolution map of the boundary between Earth’s crust and mantle, called the Mohorovicic, or “Moho” discontinuity.

As the orbit drops, atmospheric drag increasingly pulls the satellite towards Earth, so GOCE has to use the tiny thrust of its ion engine to continuously compensate for any drag to stay aloft and maintain the stability it needs to measure Earth’s gravity. GOCE has enough xenon fuel for another 50 weeks of operations. When the fuel runs out the satellite will be pulled into the deep atmosphere where it will burn up

Find out more about the GOCE mission here

Timelapse of Hurricane Sandy, Satellite Views October 23-31, 2012

Here’s a complete animation of Hurricane Sandy from October 23-31, as seen by GOES-13, a geosynchronous satellite that is in orbit nearly 36,000 km (23,000 miles) above Earth. This huge storm was costly in terms of death and destruction. The death toll currently stands at 160 (88 in the U.S., 54 in Haiti, 11 in Cuba), with damage estimates ranging from $10 – $55 billion.

Below is a timelapse animation which shows the full hemisphere view from GOES-13, showing the development of Hurricane Sandy as it begins over Central America and begins its path up through the Caribbean and the east coast of the U.S.

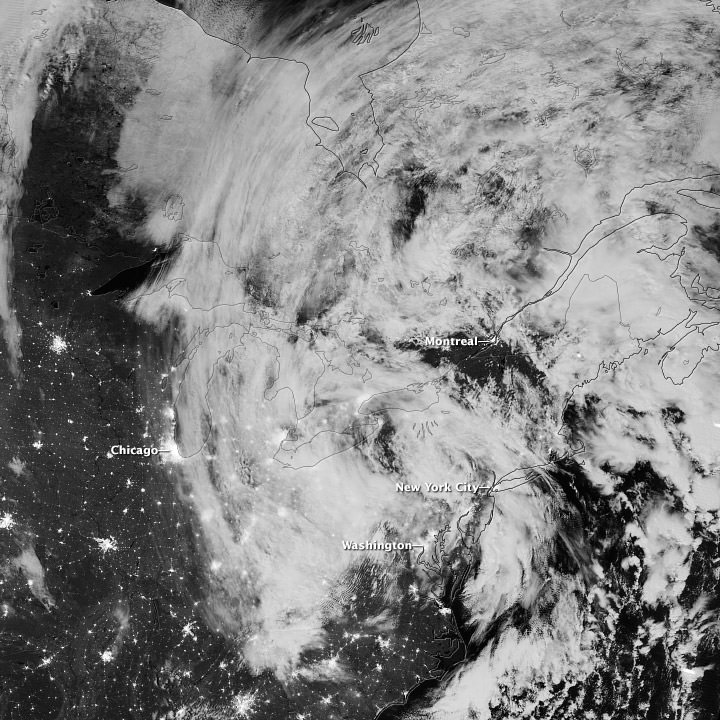
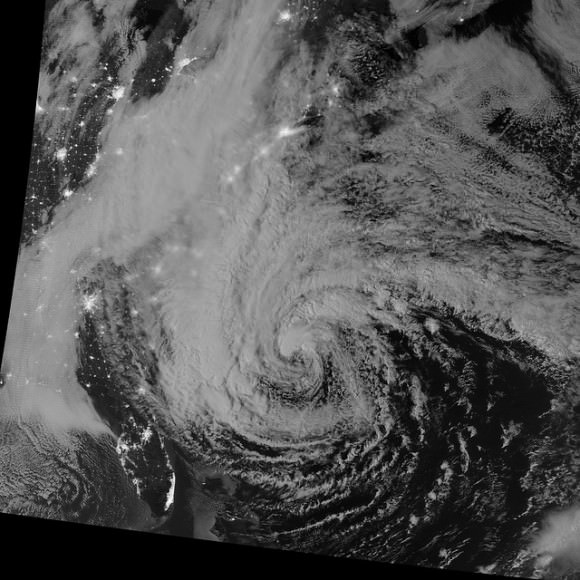
The Visible Infrared Imaging Radiometer Suite (VIIRS) on the Suomi NPP satellite acquired this image of the storm around 3:13 a.m. Eastern Daylight Time (7:13 Universal Time) on October 31. Credit: NASA/NOAA

This image from the Suomi NPP satellite shows remnants of Hurricane Sandy as it moved inland in the early morning hours of October 31, 2012. As the center of the system passed Pennsylvania, its maximum sustained winds were 40 miles (64 kilometers) per hour. This image is from the “day-night band” on VIIRS, which detects light wavelengths from green to near-infrared. The Moon lit the tops of the clouds.

Sandy’s clouds stretched from Hudson Bay to Chicago and Washington. Clusters of lights gave away the locations of some cities throughout the region; but along the East Coast, clouds mostly obscured the lights, many of which were blacked out due to the storm. On October 31, the Wall Street Journal reported that several million customers in multiple states were without electricity.

You can see more satellite images of Sandy’s traverse at the NASA Earth Observatory website.

Satellites Provide 3-D Views and More of Hurricane Sandy

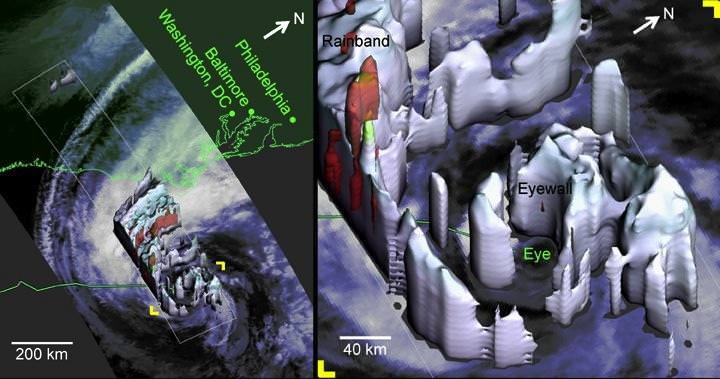
Hurricane Sandy as viewed by the TRMM Precipitation Radar at 2:20 EDT on Oct. 28, 2012. Credit: NASA

Satellite imagery and data has been invaluable in predicting the path and intensity of storms like Hurricane Sandy. Satellites like NASA’s Tropical Rainfall Measuring Mission (TRMM) can measure rainfall rates and cloud heights in tropical cyclones, and was used to create a 3-D image, above, to allow forecasters to look inside the hurricane, and predict fairly spot-on what locations would be affected the worst. There’s even a 3-D video view from the CloudSat satellite, and much more, including a stunning wind map, and this round-up from JPL of various satellite views of the storm. You can also see a slideshow of NASA satellite images and videos on the NASA Goddard Flickr site.

This exemplifies just one reason why space exploration is important, and why people are maybe now starting to realize how our failure to plan ahead and invest in weather satellites may become a problem. Without those eyes in the sky we are blind to the minute-to-minute and hour-to-hour development of storms and weather, not to mention overall study of the climate.

Below is a stunning high-speed satellite view from the GOES-14 satellite:

Focusing just on the area of the storm, the GOES-14 Super Rapid Scan Operation (SRSO) captures infrared and visible data every minute and relays that information to forecasters on the ground. This animation shows the GOES-14 SRSO for October 29, 2012 as Hurricane Sandy approached the U.S. coastline.

Video: Hurricane Sandy Seen by Space Station Astronauts

Here’s the view of Hurricane Sandy from an altitude of 254 statute miles from external cameras on the International Space Station. This video was shot as the ISS flew over the US’s eastern seaboard at 12:52 Eastern time October 29, 2012. Sandy has yet to officially make landfall, but the huge storm is already battering a region that makes up the most densely populated area of the US. The combination of three different storms has caused it to be dubbed as “Frankenstorm,” but it could turn into a “Blizzicane” as a winter storm merges with Sandy. The hurricane itself is strengthening as it barrels toward a landfall along the New Jersey coastline.

Below is video of the ISS pass at 11:16 a.m on Monday:

At the time of the flyover, Sandy was located 420 km (260 miles) south-southeast of New York City, moving north-northwest at 18 miles an hour with winds measured at 90 miles an hour as a Category 1 hurricane, according to the National Hurricane Center.

The huge slow moving combination of storms stretches about 1,600 km (1,000 miles) from north to south and significant impacts of storm surge and flooding are expected, with at least 7-10 inches of rain. This comes along with a snow advisory in some regions, creating a “Blizzicane” in the mountains of West Virgina, with 2-4 feet of snow predicted.

Forecasters are predicting this to be a multi-billion dollar storm disaster.

Here are some recent images of the storm:

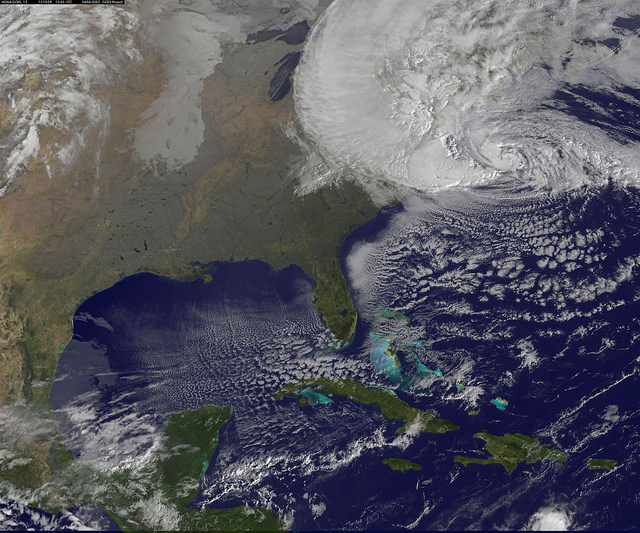
Satellite View of Hurricane Sandy on Oct. 29 at 9:10 EDT by NOAA’s GOES-13 satellite.

Hurricane Sandy Viewed in the Dark of Night. Image acquired by the Visible Infrared Imaging Radiometer Suite (VIIRS) on the Suomi NPP satellite around 2:42 a.m. Eastern Daylight Time (06:42 Universal Time) on October 28, 2012.

For more images, see the Goddard Space Flight Center’s Flickr page.

Hurricane Sandy Barreling to Eastern Seaboard Menacing Millions

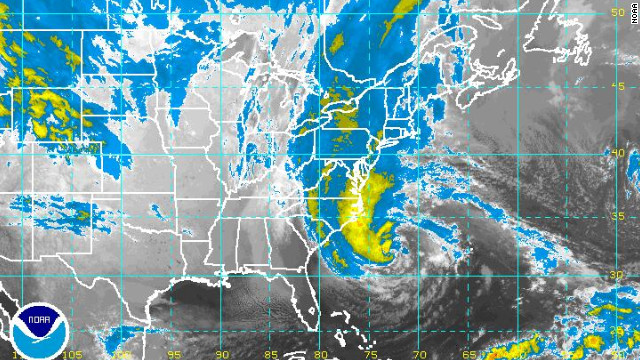
Image Caption: NOAA Satellite image of Hurricane Sandy threatening millions of people living along US Eastern Seaboard. See NASA satellite imagery below. Credit: NOAA

Hurricane Sandy, a powerfully monstrous and unprecedented late season storm, is barreling mightily towards the US Eastern Seaboard, menacing tens of millions of residents living in the path of her sustained destructive winds, rains and life threatening storm surges.

Mandatory mass evacuations involving hundreds of thousands of people are already in progress in anticipation of a devastating storm strike on Monday (Oct 29).

First effects from Sandy are expected on Sunday night (Oct 28) in the New York/ New Jersey/Connecticut/Pennsylvania metropolitan area. Wind gusts are already exceeding 40 MPH as of Sunday afternoon, here in New Jersey – and steadily worsening.

Coastal Wave heights of 6 to 11 feet are predicted – possibly breaking records.

Public transit systems in New York City/New York, New Jersey, Philadelphia, Pennsylvania, Connecticut and Washington, D.C. have been ordered to shut down later today – Sunday – by the Governors’ of the affected states. Most schools and government offices will also be closed on Monday.

Amtrak has just announced it will shutdown trains in the Northeast Corridor.
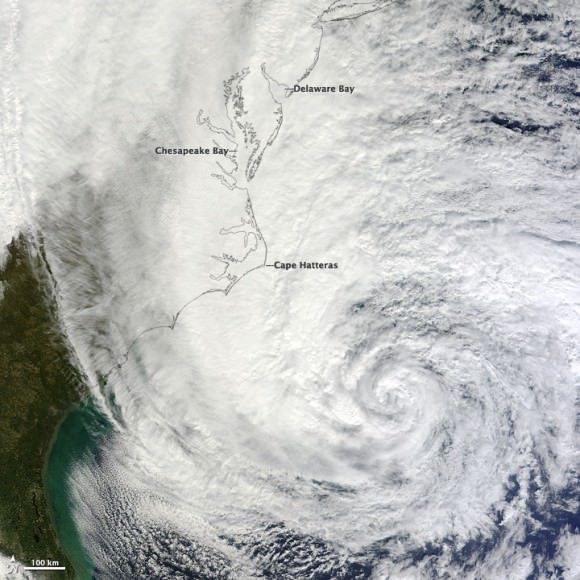
Image Caption: Hurricane Sandy off the southeastern United States was imaged at noon Eastern Daylight Time (16:00 UT) on October 28, 2012, acquired by the Moderate Resolution Imaging Spectroradiometer (MODIS) on NASA’s Terra satellite. Credit: NASA Terra satellite

As of Sunday afternoon (Oct. 28) Sandy is predicted to make a dramatic, sharp left hook on Monday morning and most likely will make a violent direct hit slamming somewhere along the Jersey shore which borders from Maryland to New York City and beyond – sending high waves surging into coastal towns and cities overwhelming protective barriers.
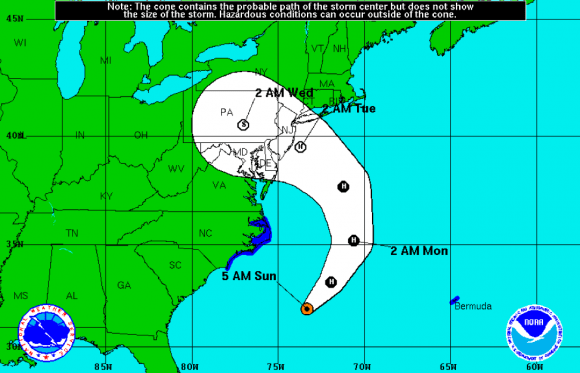
Image Caption: Predicted path of Hurricane Sandy. Credit: NOAA

Inland areas will also suffer widespread destruction and power losses as Sandy slowly moves onshore and lingers over an extraordinarily wide path spanning several hundred miles in diameter.

Heavy rains and hurricane force wind gusts will soak the ground, taking down trees and power lines. Leaves may block storm drains.

Hurricane Sandy is currently classified as a Category 1 Hurricane. Its effects could be catastrophic and should not be taken lightly.

Making matters even worse, Sandy will hit during a full moon and the astronomical highest tides.

The National Hurricane Service warns that major flooding effecting millions of homes and businesses is expected along the US East Coast stretching from North Carolina to New England.

Millions and millions of people have more than a 50% chance of losing power.

Local power companies learned hard lessons from the devastating effects of Hurricane Irene just 1 year ago, which caused widespread and serious misery, flooding and deaths throughout the Northeast. Some people went without power for more than 2 weeks in the aftermath of Hurricane Irene in 2011. This author lost power for several days and now we are in for another direct hit.

Additional Power crews have been called in from across the country and prepositioned as a precautionary measure. NEVER touch any downed power lines.

States of Emergency have been declared in 9 eastern States from North Carolina to Maine as well as the District of Columbia.

Mandatory evacuations of low lying coastal areas have been ordered by the Governors’ of New Jersey, New York and Connecticut. State Shelters are being opened now.

Ocean wave heights of 20 to 50 feet have already been reported near the Hurricane’s eye.

Even the US Presidential election is being affected by Hurricane Sandy. Campaign events by both candidates Obama and Romney have been cancelled in several key battleground states. It is possible that polling stations may lose power – and the consequences are unknown on the closely contested election that could hinge on a handful of votes !

Stay tuned to NOAA, NASA and local and national news for continuing Hurricane updates.

Ken Kremer

NASA Satellite Sees Ghostly Remains of Vanishing Arctic Sea Ice

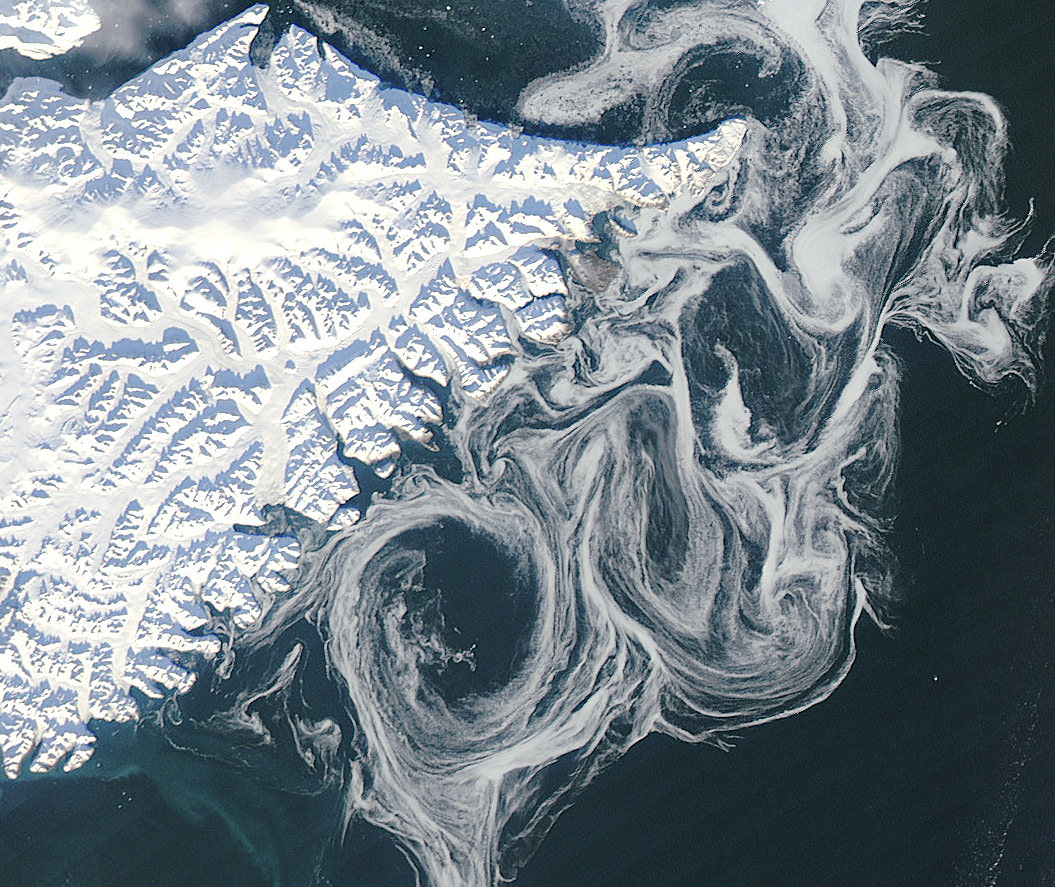
Sea ice swirls in ocean currents off the coast of Greenland (NASA/GSFC)

Spooky spectral swirls of last season’s sea ice drift in currents off the coast of eastern Greenland in this image from NASA’s Aqua satellite, acquired on October 17. Although sea ice in the Arctic will start forming again after September’s record low measurements, these ghostly wisps are likely made up of already-existing ice that has migrated south.

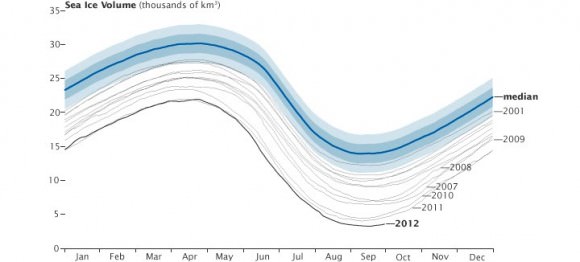
As global temperatures rise — both over land and in the ocean — thinner sea ice builds up during the Arctic winter and thus more of it melts during the summer, a pattern that will eventually lead to an ice-free Arctic if trends continue. The past several years saw sea ice in the Arctic below the 1979-2000 average, with this past September displaying the lowest volumes yet recorded.

The graph below, made from data modeled by the Polar Science Center at the University of Washington, show the chilling — or, perhaps, not-so-chilling — results of this century’s recent observations.

Along Greenland’s east coast, the Fram Strait serves as an expressway for sea ice moving out of the Arctic Ocean. The movement of ice through the strait used to be offset by the growth of ice in the Beaufort Gyre.

Until the late 1990s, ice would persist in the gyre for years, growing thicker and more resistant to melt. Since the start of the twenty-first century, however, ice has been less likely to survive its trip through the southern part of the Beaufort Gyre. As a result, less Arctic sea ice has been able to pile up and form multi-year ice.

Thin, free-drifting ice — as seen above — moves very easily with winds and currents.

Aqua is a NASA Earth Science satellite mission named for the large amount of information that the mission is collecting about the Earth’s water cycle, including evaporation from the oceans, water vapor in the atmosphere, clouds, precipitation, soil moisture, sea ice, land ice, and snow cover on the land and ice. Aqua was launched on May 4, 2002, and carries six Earth-observing instruments in a near-polar low-Earth orbit. MODIS, which acquired the image above, is a 36-band spectroradiometer that measures physical properties of the atmosphere, oceans and land.

Source: NASA Earth Observatory

NASA image courtesy Jeff Schmaltz, LANCE MODIS Rapid Response Team at NASA GSFC. Graph by Jesse Allen based on modeled ice volume data from the Polar Science Center, University of Washington. Caption portions by Michon Scott with information from Ted Scambos, National Snow and Ice Data Center.