Satellite Views: Will Hurricane Sandy Turn into ‘Frankenstorm’?

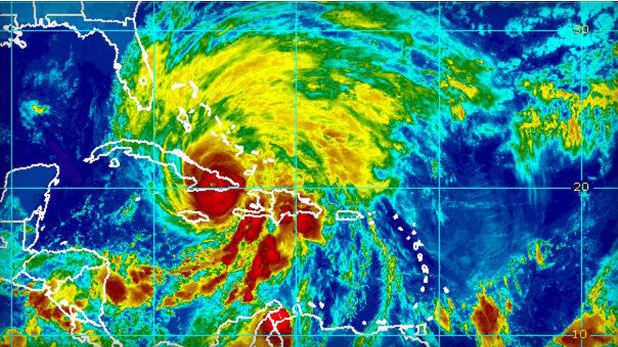
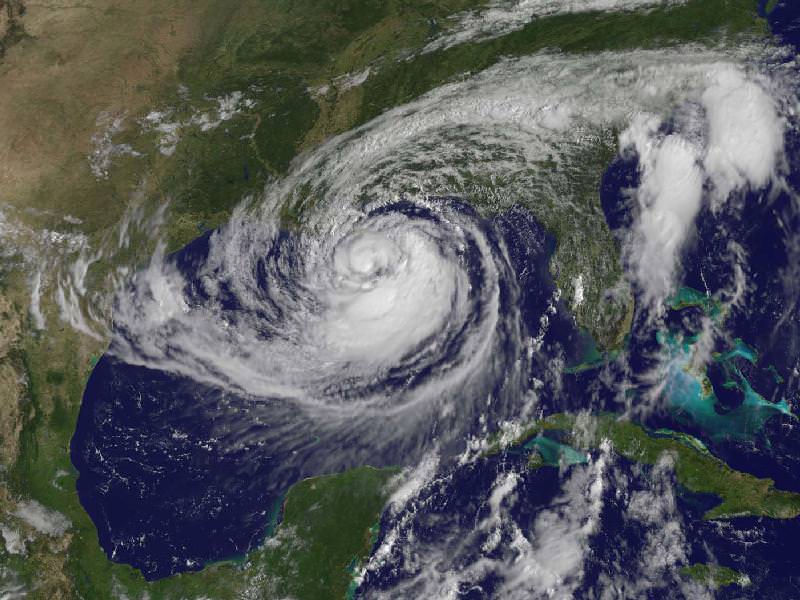
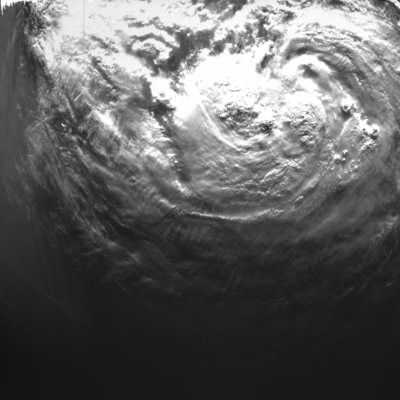
Hurricane Sandy made landfall on Cuba early Thursday Oct. 25, 2012 as strong Category 2. Credit: NOAA/National Hurricane Center

Meteorologists keeping an eye on Hurricane Sandy say the storm threatens to move up along the east coast of the United States and could mix with a wintery storm coming from the west to form a monster storm that has been informally dubbed “Frankenstorm.” The hurricane could reach the US coast by this weekend and when the two storms collide, it could continue to pound the eastern seaboard well into the week of Halloween.

Hurricane Sandy is now in the Caribbean as a Category 2 storm coastal areas from Florida to Maine will feel some effects, forecasters predict. The mix of the two storms could cause weather problems in the Washington DC area to New York city, some of the most populous areas of the US.

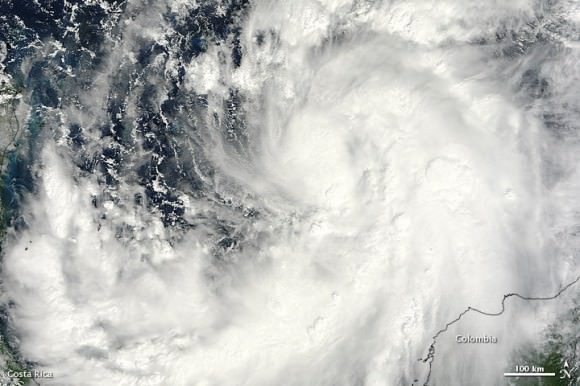
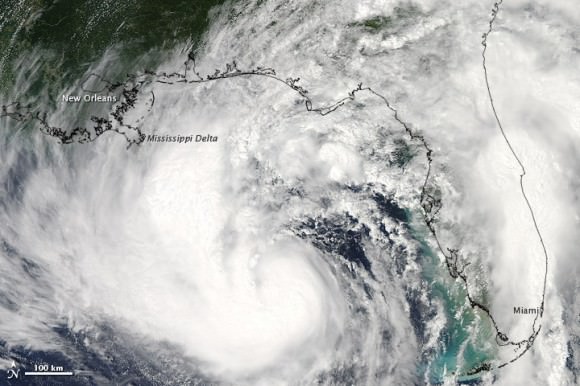
Satellite image of then Tropical Storm Sandy taken on October 23, 2012 as it was over the Caribbean Sea taken by the Moderate Resolution Imaging Spectroradiometer (MODIS) on NASA’s Terra satellite. NASA image courtesy Jeff Schmaltz, LANCE MODIS Rapid Response Team at NASA GSFC.

Forecasters are saying this could be a major mess, with a 90 percent chance that the East will get steady gale-force winds, heavy rain, flooding and maybe snow.

While no one can positively predict what Hurricane Sandy will do and how the two storms might mesh into one monster storm, the Washington Post’s Capital Weather Gang has outlined the possible scenarios from worst case to where the storms collide and remained parked over the region for days, to best case, where Sandy heads to the northeast sparing the East Coast from a direct hit.

We’ll post additional updated satellite views as they become available.

Sources: NASA Earth Observatory, CBS News, Climate Central
, NOAA

Huge Volcano Plume Seen from Space

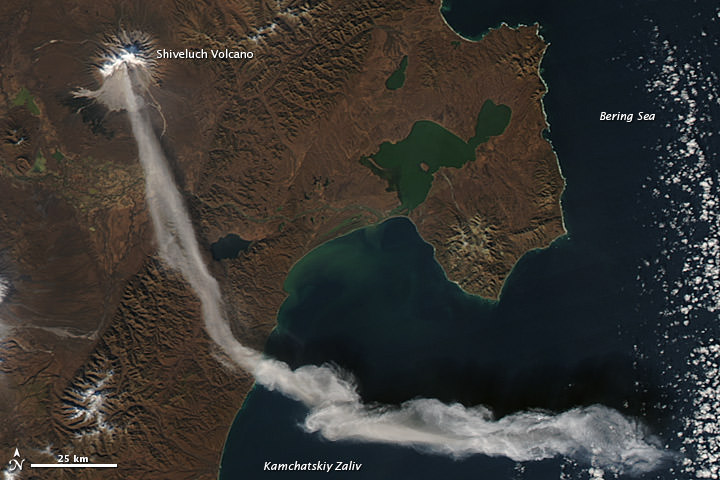
The Shiveluch volcano as seen by the Aqua satellite on October 6, 2012. Credit: NASA

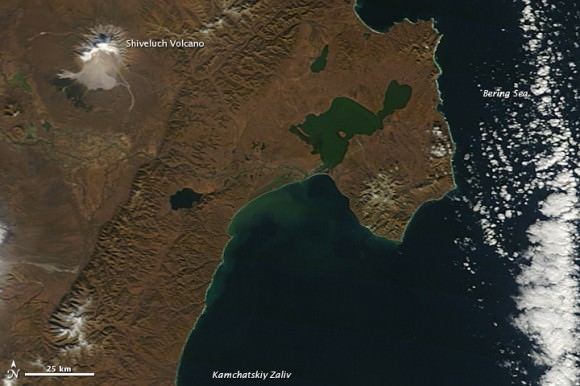
It’s almost like this volcano has an on/off switch. The Shiveluch Volcano in the northern Russian peninsula of Kamchatka had been quiet, and an earlier image taken by NASA’s Terra satellite (below) at about noon local time (00:00 UTC) on October 6, 2012, showed a quiet volcano with no activity. But just two hours later when the Aqua satellite passed over the area, the volcano had erupted and sent a plume of ash over about 90 kilometers (55 miles). Later, a local volcanic emergency response team reported that the ash plume from Shiveluch reached an altitude of 3 kilometers (9,800 feet) above sea level, and had traveled some 220 kilometers (140 miles) from the volcano summit.

The same volcano seen by the Terra satellite just two hours earlier on the same day. Credit: NASA

Shiveluch is one the biggest and most active volcanoes in this region and rises 3,283 meters (10,771 feet) above sea level. NASA’s Earth Observatory website says Shiveluch is a stratovolcano composed of alternating layers of hardened lava, compacted ash, and rocks ejected by previous eruptions. It has had numerous eruptions the past 200 years, but has been active during much of its life – estimates are the volcano is 60,000 to 70,000 years old.

The beige-colored expanse of rock on the volcano’s southern slopes (visible in both images) is due to an explosive eruption that occurred in 1964. Another eruption started in 1999 and lasted for over 10 years.

Source: NASA Earth Observatory

Manhattan-Sized Ice Island Heads Out to Sea

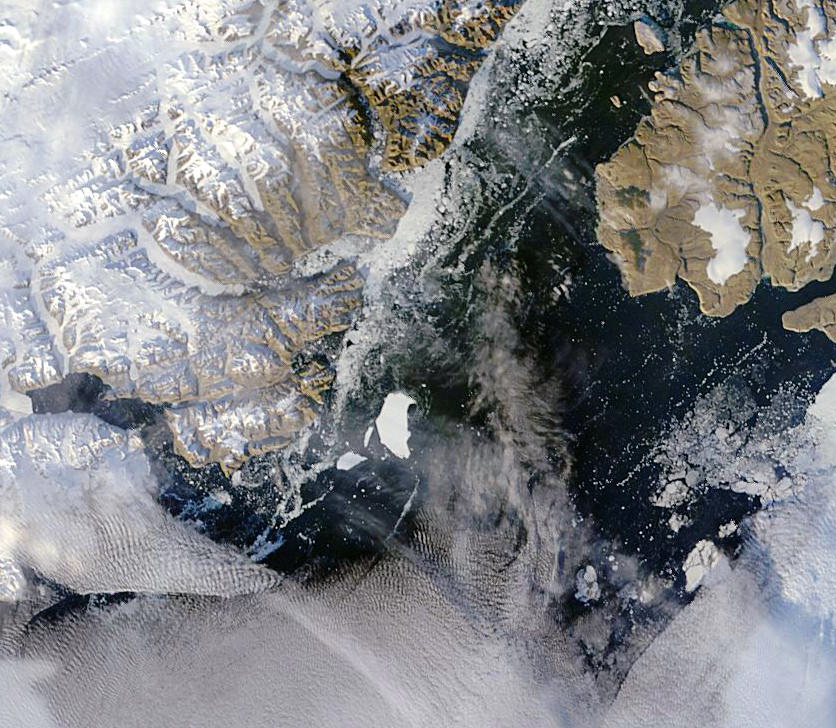
An “ice island” that calved from the Petermann Glacier in July is seen by NASA satellite (MODIS/Terra)

Remember that enormous slab of ice that broke off Greenland’s Petermann Glacier back in July? It’s now on its way out to sea, a little bit smaller than it was a couple of months ago — but not much. At around 10 miles long and 4.6 miles across (16.25 x 7.5 km) this ice island is actually a bit shorter than Manhattan, but is fully twice as wide.

The image above was acquired on September 14 by the Moderate Resolution Imaging Spectroradiometer (MODIS) aboard NASA’s Terra satellite.

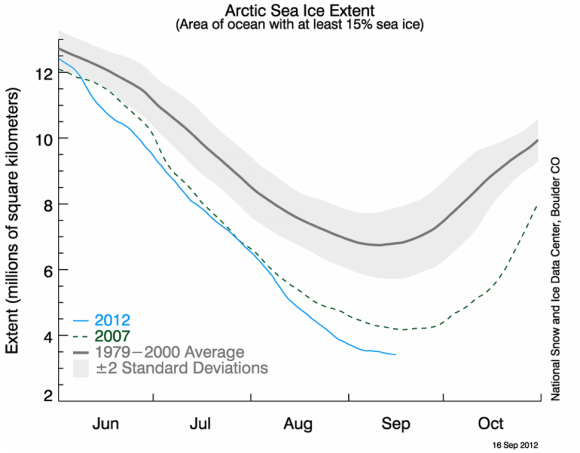
Although the calving of this particular ice island isn’t thought to be a direct result of increasing global temperatures, climate change is thought to be a major factor in this year’s drop in Arctic sea ice extent, which is now below 4.00 million square kilometers (1.54 million square miles). Compared to September conditions in the 1980s and 1990s, this represents a 45% reduction in the area of the Arctic covered by sea ice.

Arctic sea ice extent data for June-July 2012 (NSIDC)

This year sea ice in the Arctic Ocean dropped below the previous all-time record, set in 2007. 2012 also marks the first time that there has been less than 4 million square kilometers (1.54 million square miles) of sea ice since satellite observations began in 1979.

The animation below, released today by the NOAA, shows the 2012 time-series of ice extent using data from the DMSP SSMI/S satellite sensor:

Read more here.

Satellite View of Guatemalan Volcano Erupting

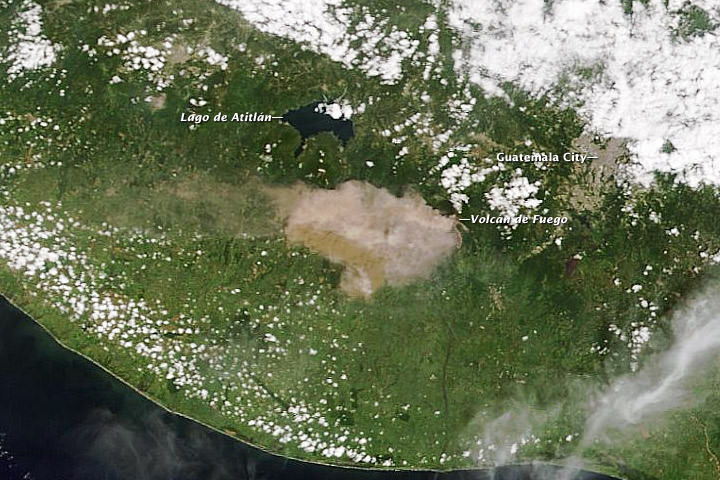
A natural-color image captured the eruption of Volcan de Fuego as it occurred. Credit: NASA/Moderate Resolution Imaging Spectroradiometer (MODIS) aboard the Terra satellite.

One of Central American’s most active volcanos erupted on September 13th, 2012 prompting officials to evacuate 35,000 residents in Guatemala. The Volcan de Fuego, or Fire Volcano, began belching out ash at 10 a.m. local time with ash now falling up to 40 kilometers (25 miles) from the volcano. Residents within 20 kilometers (12 miles) of the volcano were being removed from the area in buses and cars.

According to the Coordinadora Nacional para la Reducción de Desastres (CONRED), the eruption included ash emissions to the west and a 500-meter (2,000-foot) long lava flow. CONRED also warned of pyroclastic flows that could descend the mountain in any direction.

This natural-color image captured the eruption just as it occurred, NASA said. The image was acquired by the Moderate Resolution Imaging Spectroradiometer (MODIS) aboard the Terra satellite.

Thursday’s eruption was the sixth of the year for this volcano and some officials said it may be the biggest.

NASA said they would publish imagery of Guatemala two times per day on the MODIS Rapid Response web site.

Sources: NASA’s Earth Observatory, CNN

Satellites Keep Track of Hurricane Isaac

This visible image of Tropical Storm Isaac taken from NOAA’s GOES-13 satellite shows the huge extent of the storm, where the eastern-most clouds lie over the Carolinas and the western-most clouds are brushing east Texas. The image was captured on Tuesday, Aug. 28, 2012 at 10:25 a.m. EDT. Image Credit: NASA GOES Project

As expected Tropical Storm Isaac has now become a full-fledged hurricane, after being fed by the warm waters in the Gulf of Mexico. The slow moving storm is now closing in on the Louisiana-Mississippi coast and could make landfall in the region seven years to the day after Hurricane Katrina devastated the same area. It is not expected to be another Katrina, but with the slowness of the storm — about 16 km/h (10 mph) — forecasters are predicting 7-14 inches of rainfall across the coast as well as inland regions, and some places could even see 20 inches. Flooding from rainfall and storm surges are expected, according to NOAA. Satellites have been keeping an eye on the storm, and above is an image from one of the GOES satellites taken on Tuesday, August 28. Below are more satellite views.

The Proba-2 satellite’s X-Cam – Exploration Camera – acquired this image at 11:38:33 GMT on August 27, 2012. Credit: ESA

The Moderate Resolution Imaging Spectroradiometer (MODIS) on NASA’s Aqua satellite captured this natural-color image of Isaac over the Gulf of Mexico at 2:00 p.m. CDT on August 27, 2012. Credit: NASA

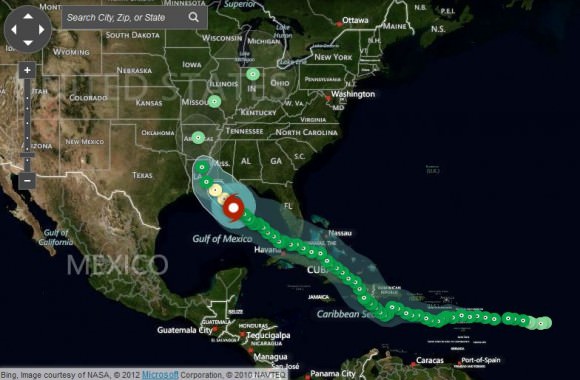
Here’s a screenshot of Weather.com’s Hurricane Tracker for Isaac. Click here to see up-to-the-minute details on Isaac.

Sources: NOAA, NASA, ESA

On the Hunt for High-Speed Sprites

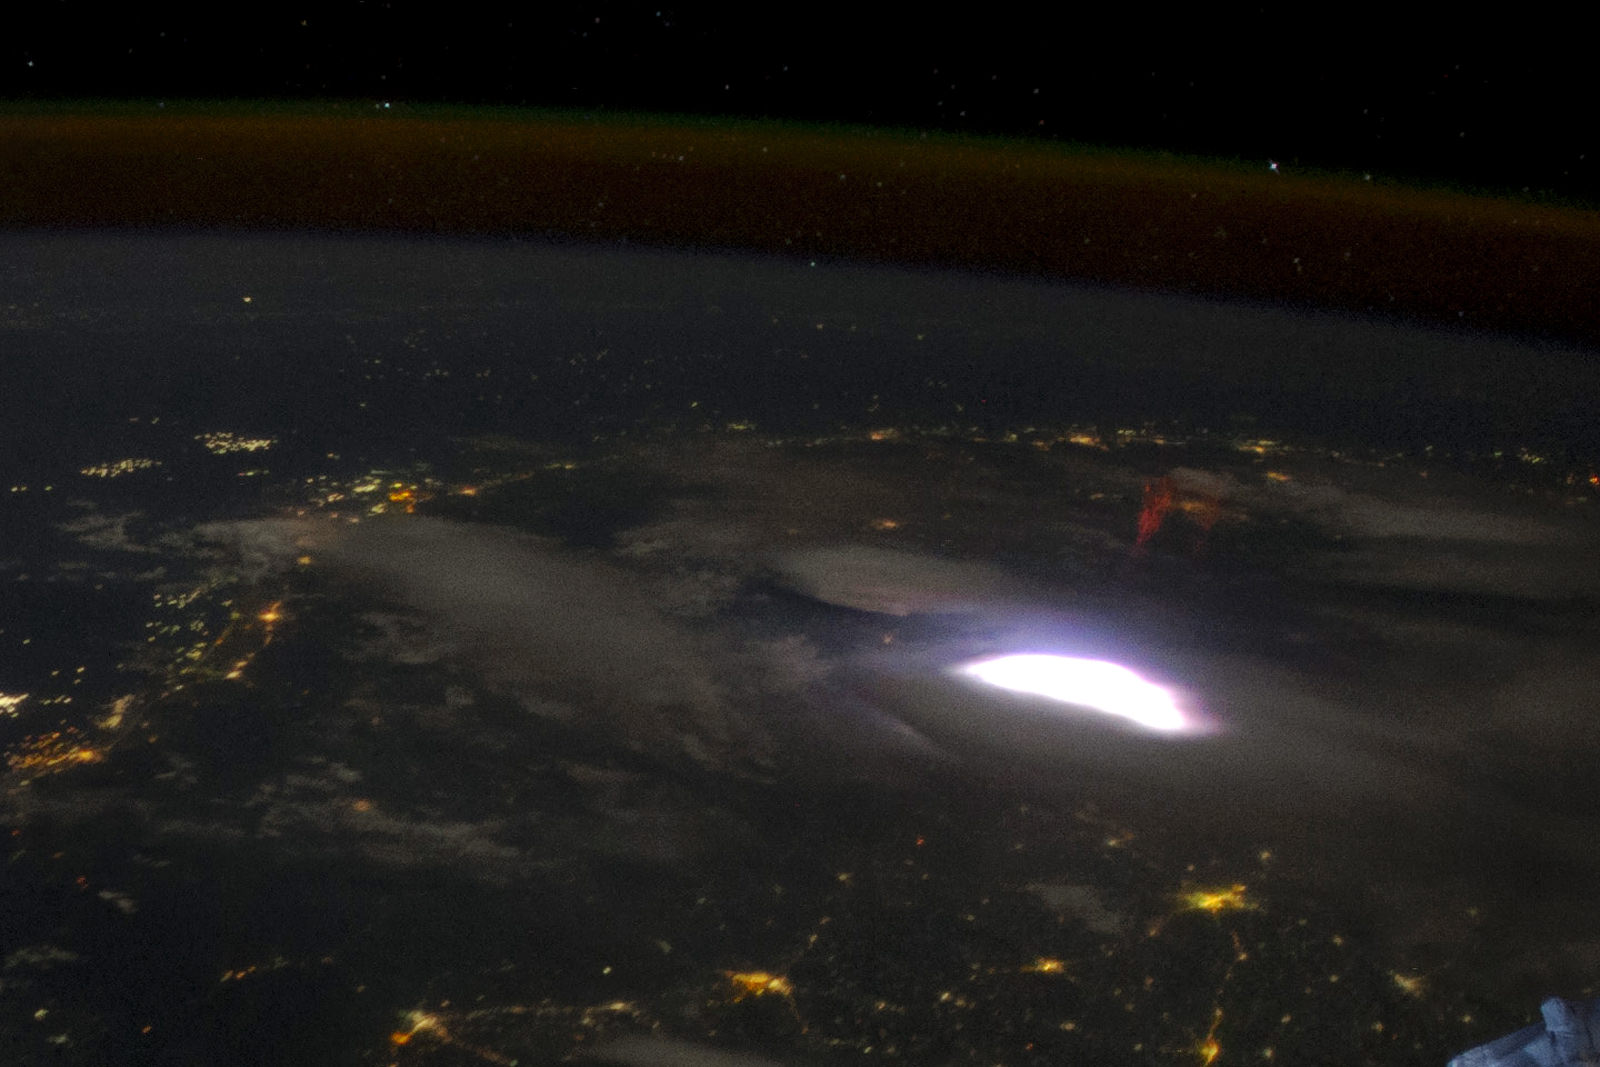
Air glow (along with a lightning sprite) is visible in this image from the International Space Station. Credit: NASA

A bright red sprite appears above a lightning flash in a photo captured from the ISS

Back on April 30, Expedition 31 astronauts aboard the ISS captured this photo of a red sprite hovering above a bright flash of lightning over Myanmar. Elusive atmospheric phenomena, sprites are extremely brief bursts of electromagnetic activity that are associated with powerful lightning discharges, but exactly how and why they form isn’t yet known — although recent research (along with some incredible high-speed video) is shedding new light on sprites.

Although the appearance of bright high-altitude flashes above thunderstorms have been reported by pilots for nearly a century, it wasn’t until 1989 that a sprite was captured on camera — and the first color image of one wasn’t taken until 1994.

So-named because of their elusive nature, sprites appear as several clusters of red tendrils above a lighting flash followed by a breakup into smaller streaks, often extending as high as 55 miles (90 km) into the atmosphere. The brightest region of a sprite is typically seen at altitudes of 40-45 miles (65-75 km).

Because they occur above storms, only last for a thousandth of a second and emit light in the red portion of the visible spectrum (to which our eyes are the least sensitive) studying sprites has been notoriously difficult for atmospheric scientists. Space Station residents may get great views but they have lots of other things to do in the course of their day besides sprite hunting! Luckily, a team of scientists were able to capture some unprecedented videos of sprites from airplanes in the summer of 2011, using high-speed cameras and help from Japan’s NHK television.

Chasing storms over Denver via plane for two weeks, researchers were able to locate “hot zones” of sprites and capture them on camera from two planes flying 12 miles apart. Combining their videos with ground-based measurements they were able to create 3-dimensional maps of the formation and evolution of individual sprites.

Based on the latest research, it’s suggested that sprites form as a result of a positive electrical charge within a lightning strike that reaches the ground, which leaves the top of the cloud negatively charged — a one-in-ten chance that then makes conditions above the cloud “just right” for a sprite to form higher in the atmosphere.

“Seeing these are spectacular,” said Hans C. Stenbaek-Nielsen, a geophysicist at the University of Alaska in Fairbanks, Alaska, where much sprite research has been conducted. “But we need the movies, because not only are they so fast that you could blink and miss them, but they emit most of their light in red, where the human eye is relatively blind.”

An example of how energy can be exchanged between lower and higher regions of Earth’s atmosphere, it’s been suggested that sprites could also be found on other planets as well, and may provide insight into the exotic chemistries of alien atmospheres.

Read more on NASA Heliophysics here.

Main image: Image Science & Analysis Laboratory, NASA Johnson Space Center. Inset image: the first color image of a sprite  (NASA/UAF.) Video: NHK.

New Stunning ISS Time-lapse: Earth Illuminated

“If you could see the Earth illuminated when you were in a place as dark as night, it would look to you more spendid than the Moon.”

— Galileo Galilei.

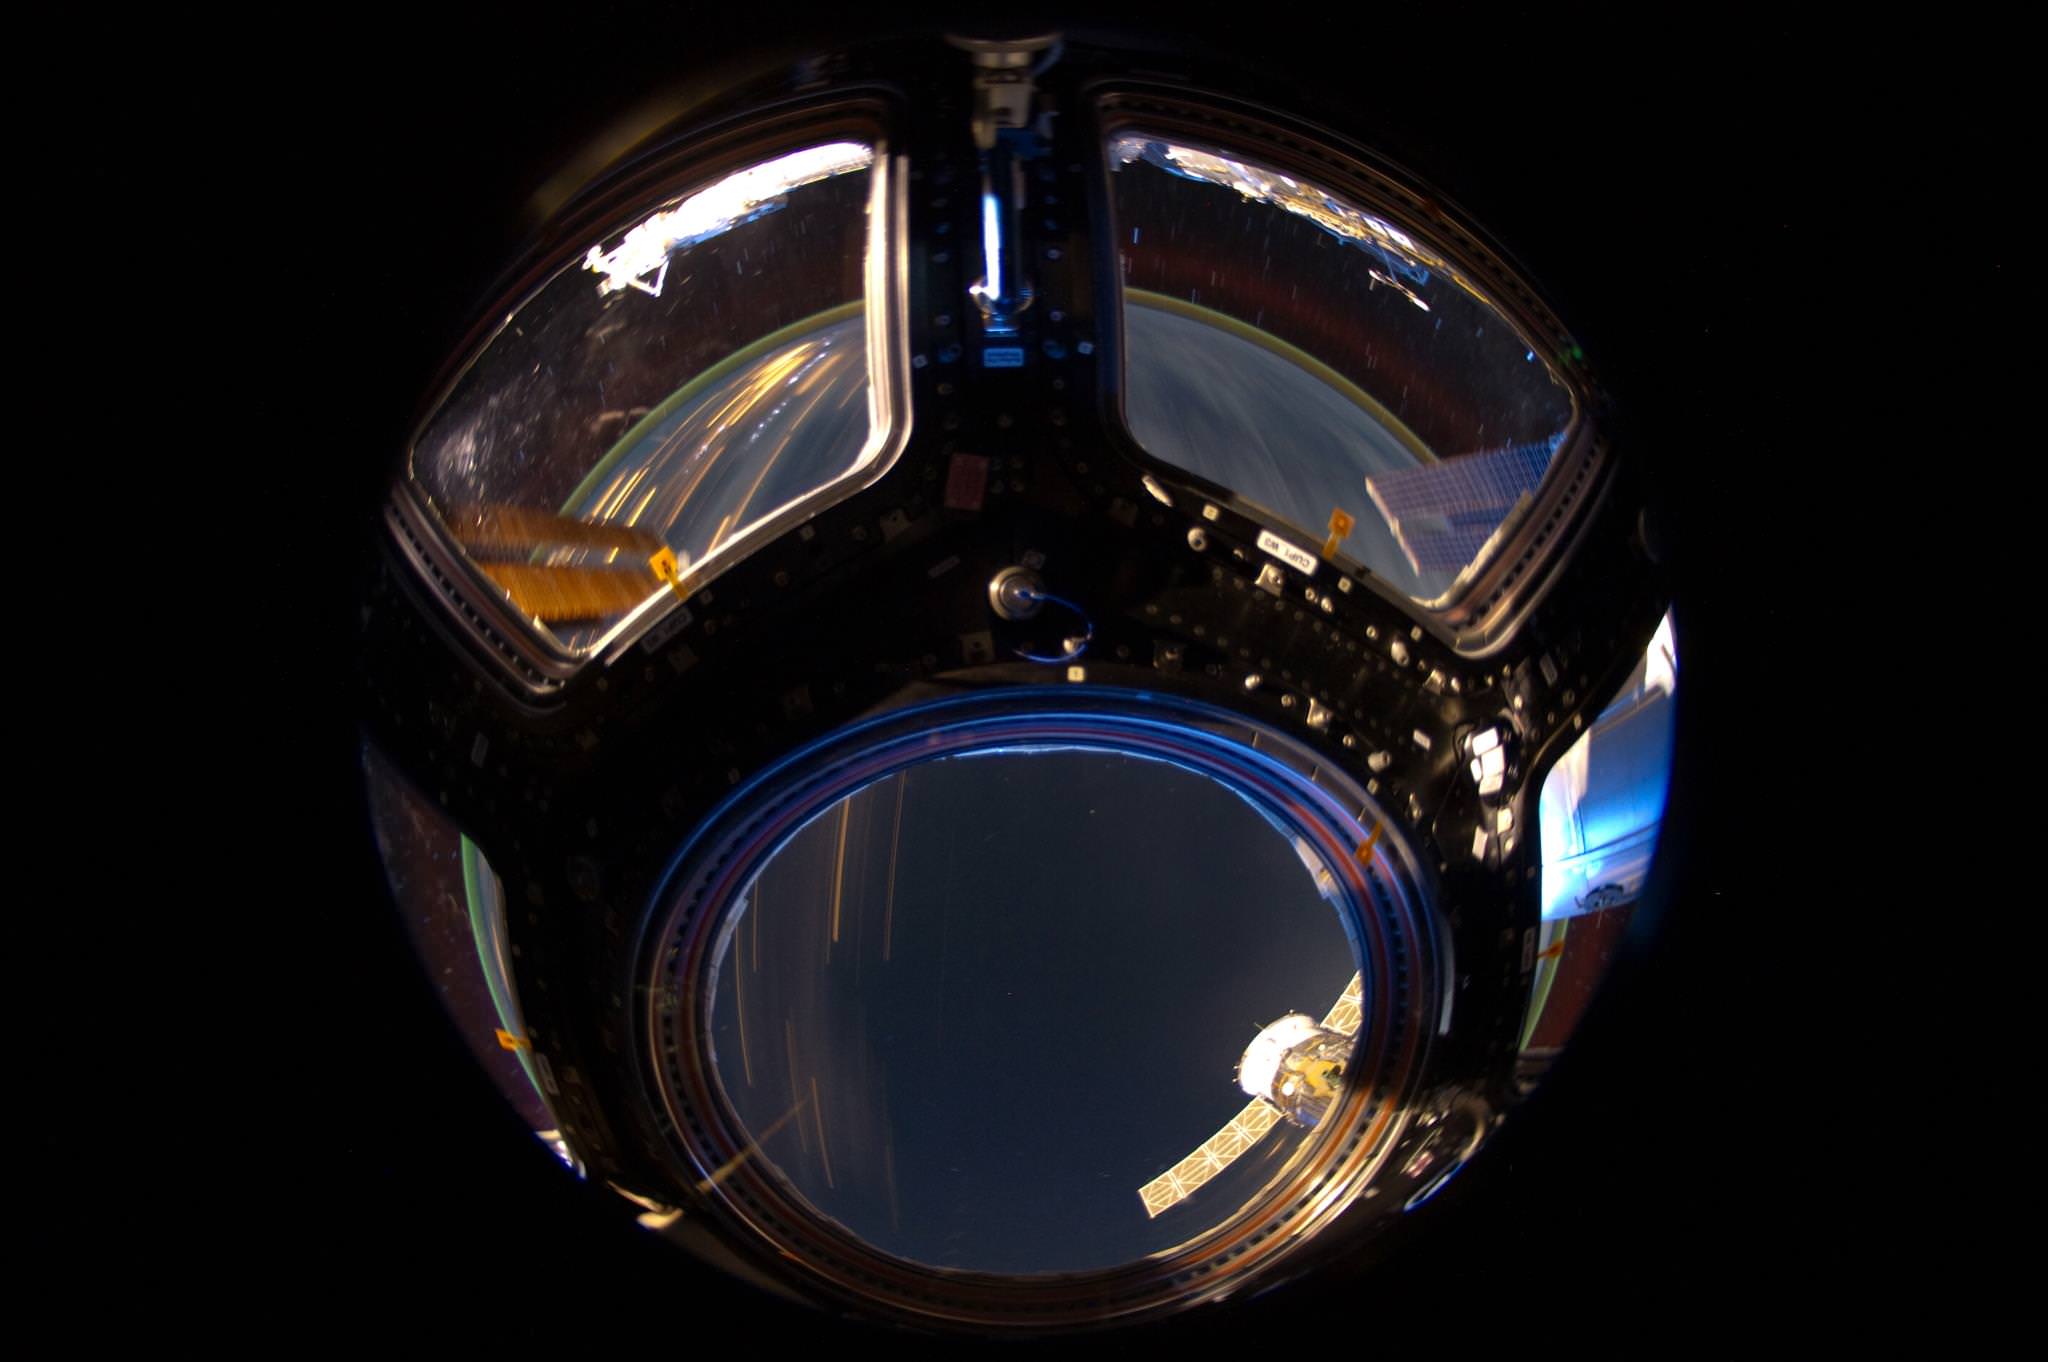
400 years ago, Galileo could only imagine what the view of Earth would be like from space. Today, we have people on board the International Space Station who see that view every day. This new beautiful time-lapse shows aurora, lightning, our Milky Way Galaxy, city lights and other sights as seen from orbit.

Below is a great still image from this video, an amazing look through the ISS’s Cupola as Earth whizzes by:

Image caption: A view out the Cupola of the ISS. Credit: NASA

For more time-lapse videos and imagery, visit NASA’s Gateway to Astronaut Photography of Earth website.

A Brand New “Blue Marble” View of Earth

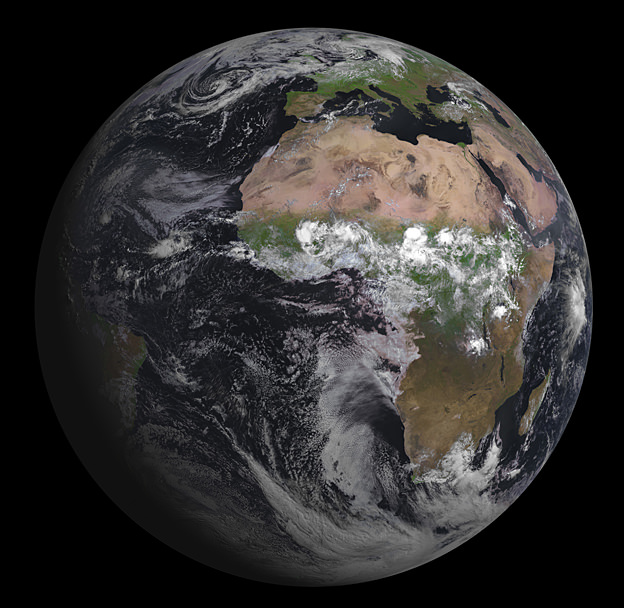
Europe’s latest geostationary weather satellite has captured its first image of Earth, and it’s a beauty! The Spinning Enhanced Visible and Infrared Imager (SEVIRI) instrument on the Meteosat Second Generation-3 (MSG-3) satellite was launched on July 5, 2012, and has since been in the commission stage. ESA says it will still be a couple of months before it is ready for operations.

SEVIRI provides enhanced weather coverage for Europe and Africa in order to improve very short range forecasts, in particular for rapidly developing thunder storms or fog. It scans Earth’s surface and atmosphere every 15 minutes in 12 different wavelengths, to track cloud development. SEVIRI can pick out features as small as a kilometer across in the visible bands, and three kilometers in the infrared.

MSG-3 is the third in a series of four satellites. In addition to its weather-watching mission and collection of climate records, MSG-3 has two secondary payloads.

The Geostationary Earth Radiation Budget sensor measures both the amount of solar energy that is reflected back into space and the infrared energy radiated by the Earth system, to better understand climate processes.

A Search & Rescue transponder will turn the satellite into a relay for distress signals from emergency beacons.

You can see a high resolution version of the image from ESA here.

CINEMA and the Cube-Shaped Future of Space Science

Caption: Jerry Kim, a former student and systems engineer, holds the CINEMA nanosatellite before it was packaged up and sent to NASA in January 2012. Credit: Robert Sanders.

We all will be biting our nails on August 5th as Curiosity makes its perilous descent to the surface of Mars. We have put all our eggs in the biggest, heaviest, most expensive basket, with one of the the most complex science packages and landing procedures. But there is another mission that launches this Friday that likes to keep things small, simple, cheap and accessible!

Scheduled to launch Friday, Aug. 3 from Space Launch Complex-3 at Vandenberg Air Force Base, at 12:27 a.m. PDT CINEMA (CubeSat for Ions, Neutrals, Electrons, & MAgnetic fields) is only one of 11 tiny cubesat satellites that are hitching a lift on an Atlas V rocket alongside the main payload, classified satellite
NROL-36.

ESA included seven Cubesats in the payload for Vega’s maiden flight back in February, but this will be the first time for NASA. Cubesats are modular, cheap, nanosatellites, measuring 10 cm per side, with a maximum mass of 1 kg. CINEMA is comprised of three such cubes, forming a shoebox-sized package weighing 3.15 kg and was developed by students at the University of California, Berkeley, Kyung Hee University in Korea, Imperial College London, Inter-American University of Puerto Rico, and University of Puerto Rico, Mayaguez.

CINEMA is designed to obtain images of the electrical ring current that encircles the Earth and which, during large magnetic storms can knock out our power grids. It carries the STEIN (Suprathermal Electrons, Ions, and Neutrons) Sensor, which will produce an image of the high-energy charged particles in Earth’s atmosphere, mostly ionized hydrogen and oxygen, by detecting energetic neutral atoms (ENAs) As ionized particles spiral around magnetic field lines surrounding Earth, they occasionally hit a neutral particle and grab an electron, transforming into ENAs that travel in a straight line. These can reveal the energy and location of the charged particles from which they came. CINEMA will be joined next year by three identical satellites, two launched by Korea and another by NASA, together they will monitor the 3-dimensional structure of the ring current. Also on board is the MAGIC (MAGnetometer from Imperial College) instrument, provided by Imperial College London, to measure changes in Earth’s magnetic field caused by magnetic storms.

CINEMA is only one of five university-built CubeSats aboard the Atlas V rocket. As they can be bought for only around $1,000 and can then fitted with sensors, transmitters, cameras etc, being able to include multiple satellites in a single launch keeps costs down. Universities can use cubesats to give students hands-on experience of designing, planning, building, running and monitoring a real scientific space mission.

CINEMA principal investigator Robert Lin, professor emeritus of physics and former director of UC Berkeley’s Space Sciences Laboratory, explained some of the pros and cons of cubesats. “There is more risk with these projects, because we use off-the-shelf products, 90 percent of the work is done by students, and the parts are not radiation-hard,” he said. “But it is cheaper and has the latest hardware. I will be very impressed if it lasts more than a year in orbit.”

Additionally, being small means that these satellites pose no threat as space junk either, burning up harmlessly in Earth’s atmosphere when they reach the end of their lifespan.

Find out more about CINEMA at the UC Berkley News Center

Greenland Glacier Calves Another Huge Ice Island

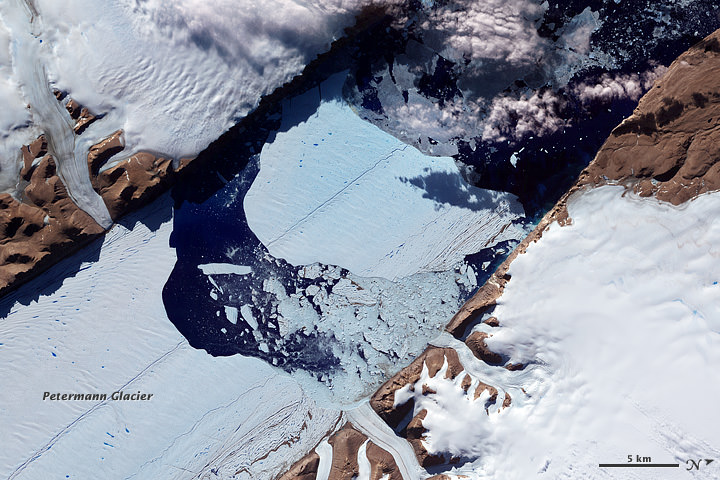
Petermann glacier, a 70 km (43 mile) long tongue of ice that flows into the Arctic Ocean in northwest Greenland, recently calved an “ice island” approximately 130 square kilometers (50 sq. miles) — about twice the area of Manhattan. The image above, acquired by NASA’s Terra satellite, shows the ice island as it drifts toward the ocean five days after breaking off the main glacier.

Petermann glacier has been known for birthing massive ice islands; previously in August 2010 an even larger island broke away from the glacier, measuring 251 square kilometers (97 sq. miles). That slab of ice eventually drifted into the northern Atlantic and was even visible from the Space Station a year later!

Read: Manhattan-Sized Ice Island Seen From Space

Although some of Greenland’s glaciers have been observed to be quickening their seaward pace as a result of global warming, this particular calving event — which occurred along a crack that appeared in 2001 satellite imagery — isn’t thought to be a direct result of climate but rather of ocean currents and isn’t expected to have any significant effect on the rate of Greenland’s ice loss as a whole. Still, satellite observation of such events provides valuable data for researchers monitoring the processes that are involved with rapidly accelerating Arctic ice loss.

And if you want an idea of what a slab of ice this large looks like up close, here’s a video taken by researchers on approach to a smaller chunk of the 2011 island:

NASA Earth Observatory image by Jesse Allen, using data from NASA/GSFC/METI/ERSDAC/JAROS, and U.S./Japan ASTER Science Team. (NASA/Terra)