[/caption]
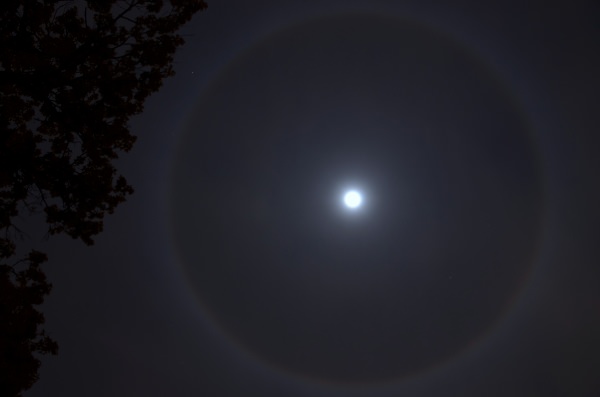
Have you ever seen a large ghostly disc around the Moon on a cool, calm, hazy night? If so, you have likely seen what is called an “Ice Halo” or “22° Halo.” Not only can the Moon display these ghostly rings of light, but the Sun does so in the day time too.
22° halos are visible all over the world and throughout the year; look for them whenever the sky is wispy or hazy with thin cirrus clouds – even in the hottest countries.
So what are they and why do they appear?
Ice halos or 22° radius Halos are in fact an optical illusion caused by 3 to 5 mile high, cold and very tenuous cirrostratus cloud, containing millions of tiny ice crystals.
The tiny ice crystals in the atmosphere create halos by refracting and reflecting light from the Moon. The halo is always the same diameter regardless of its position in the sky, though sometimes only parts of the circle are visible.
The much smaller coloured rings directly around the Moon or Sun are a corona produced by water droplets rather than ice crystals. They often form a rainbow effect or Moonbow.
Some people even believe they herald the onset of wet weather, but this has yet to be proved. Moon Halo Imaged December '03 in Ontario, Canada by Lauri Kangas
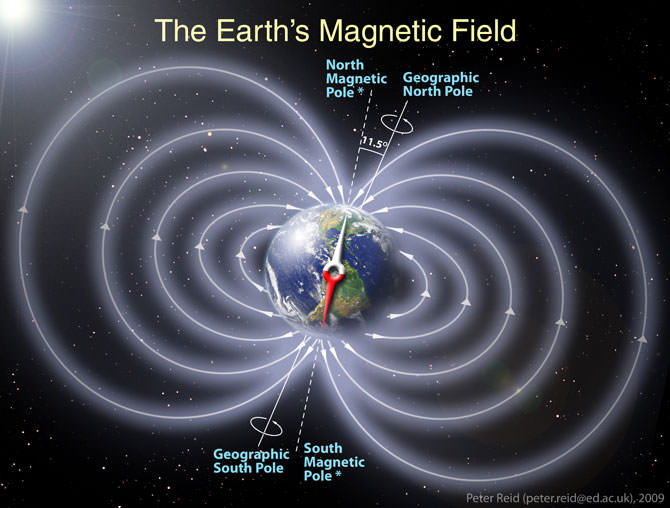
Schematic illustration of Earth's magnetic field. Credit/Copyright: Peter Reid
[/caption]
Have you heard or read stories about how Earth will some day reverse its magnetic poles? If you have, then chances are very good you’ve also heard this perfectly normal function of our planet could spell disaster. Before you buy into another “end of the world as we know it” scenario, let’s take a look at the facts.
For the record, we know that Earth’s magnetic field has changed its polarity more than once in its lifetime. For example, if you could step back in time some 800,000 years ago with a compass in your hand, you’d see the needle pointed to south – instead of north. Why? Because a compass works on magnetic fields, its needle directs you to the magnetic pole, measured as either positive or negative. The markings on the modern compass dial would be incorrect if the polarity of Earth’s magnetic fields were reversed! Like a witch hunt, many would-be prophets say natural occurrences like this might signal doom… But could their theories be correct? Unfortunately for hyperbole, the geologic and fossil records from past reversals show the answer is “No.” We’ll still be around.
Just like the Sun reversing its magnetic poles, Earthly switches are just a part of our planet’s schedule. During about the last 20 million years of our formation, Earth has settled into a pattern of switching magnetic poles about every 200,000 to 300,000 years… with a period of twice that long since our last reversal. And, it’s not a thing that happens rapidly. Magnetic pole reversal takes up to several hundred thousands of years to complete. The fields blend together and magnetic poles pop up at odd latitudes as it happens. It’s not that scary! Scientists say that Earth has reversed its magnetic field hundreds of times over the last three billion years and have sped up slightly with time.
How do we know about the impacts of magnetic pole reversal? We take a look at the deep evidence – sediment cores taken from the ocean floor. These samples are perfect fossil records which show us what direction the magnetic field was pointed in as the underwater lava emerged. These ancient flows were magnetized in the field’s direction at the time of their creation and exist on either side of the Mid-Atlantic Rift where the North American and European continental plates are moving away from each other.
“The last time that Earth’s poles flipped in a major reversal was about 780,000 years ago, in what scientists call the Brunhes-Matuyama reversal. The fossil record shows no drastic changes in plant or animal life.” says NASA’s Patrick Lynch. ” Deep ocean sediment cores from this period also indicate no changes in glacial activity, based on the amount of oxygen isotopes in the cores. This is also proof that a polarity reversal would not affect the rotation axis of Earth, as the planet’s rotation axis tilt has a significant effect on climate and glaciation and any change would be evident in the glacial record.”
A schematic diagram of Earth's interior and the movement of magnetic north from 1900 to 1996. The outer core is the source of the geomagnetic field. Graphic Credit: Dixon RohrUnlike a hard-wired magnet, Earth’s polarity isn’t constant – it moves around a bit. The reason we have a magnetic field is our solid iron core surrounding by hot, fluid metal. According to computer modeling, this flow creates electric currents which spawn the magnetic fields. While it’s not possible at this point in time to measure the outer core of our planet directly, we can guess at its movement by the changes in the magnetic field. One such change has occurred for almost 200 years now… Our northern pole has been shifting even more northward. Since it was first located, the pole has shifted its place by more than 600 miles (1,100 km)! What’s more, it’s speeding up. It would seem that it’s moving almost 40 miles per year now, instead of the 10 miles per year as recorded in the early 20th century.
Don’t be fooled by those saying a magnetic pole reversal would leave us temporarily without a magnetic field, either. This is simply isn’t going to happen and we’re not going to be exposed to harmful solar activity. While our magnetic field goes through weaker and stronger phases, there is simply no evidence to be found anywhere that it has ever disappeared completely. Even if it were weakened, our atmosphere would protect us against incoming particles and we’d have more auroral displays at lower latitudes!
So, go ahead… Sleep at night. Earthly magnetic pole reversal is a normal function of our planet and when it does happen its effects will be spread out over hundreds of thousands of years – not flipped like a pancake.
A green laser was used to guide the invisible infrared beam from La Palma to Tenerife as part of an experiment to test a new satellite concept for measuring atmospheric greenhouse gases and turbulence. Credits: ESA
[/caption]
It may have looked like a futuristic scene from Star Wars, but ESA’s latest technique for aiding space exploration might shed some “green light” on greenhouse gases. A recent experiment involving the Spanish Canary Islands was conducted by shooting laser beams from a peak on La Palma to Tenerife. The two-week endeavor not only increased the viability of using laser pulses to track satellites, but increased our understanding of Earth’s atmosphere.
ESA runs an optical ground station in Tenerife for communications links with satellites. The facility is part of a larger astronomical installation Observatorio del Teide run by Instituto de Astrofisica de Canarias. Credit: ESAKnown as infrared differential absorption spectroscopy, the laser method is an accurate avenue to measure trace gases such as carbon dioxide and methane. It is accomplished by linking two Earth-orbiting satellites – one a transmitter and the other a receiver – and examining the atmosphere as the beam passes between the two. As satellites orbit, they both rise and set behind Earth and radio occultation occurs. It’s a time-honored way of employing microwave signals to measure Earth’s atmosphere, but new wave thinking employs shortwave infrared laser pulses. When the correct wavelength is achieved, the atmospheric molecules impact the beam and the resultant data can then be used to establish amounts of trace gases and possibly wind. By different angular repetitions, a vertical picture can be painted which stretches between the lower stratosphere to the upper troposphere.
While it all sounded good on paper – the proof of a working model is when it is tested. Enter ESA’s optical ground station on Tenerife – a facility built on a peak 2390 meters above sea level and part of a larger astronomical installation called the Observatorio del Teide run by the Instituto de Astrofisica de Canarias (IAC).With equipment placed on two islands, the Tenerife location offered the perfect setting to install receiver hardware grafted to the main telescope. The transmitter was then assigned to a nearly identical peak on La Palma. With nothing but 144 kilometers of ocean between them, the scenario was ideal for experimentation.
Over the course of fourteen days, the team of researchers from the Wegener Center of the University of Graz in Austria and the Universities of York and Manchester in the UK were poised to collect this unique data.
The Observatorio del Roque de los Muchachos on the island of La Palma housed the equipment to transmit the infrared signal and green guidance laser across the Atlantic Ocean to the receiving station in Tenerife. The experiment was carried out to test a new satellite mission concept for measuring concentrations of atmospheric carbon dioxide and methane. Credit: ESAWhile the infrared beam wasn’t visible to the unaided eye, the green guidance laser lit up the night during its runs to record atmospheric turbulence. Gottfried Kirchengast from the Wegener Center said, “The campaign has been a crucial next step towards realising infrared-laser occultation observations from space. We are excited that this pioneering inter-island demonstration for measuring carbon dioxide and methane was successful.”
Armin Loscher from ESA’s Future Mission Division added, “It was a challenging experiment to coordinate, but a real pleasure to work with the motivated teams of renowned scientists and young academics.” The experiment was completed within ESA’s Earth Observation Support to Science Element.
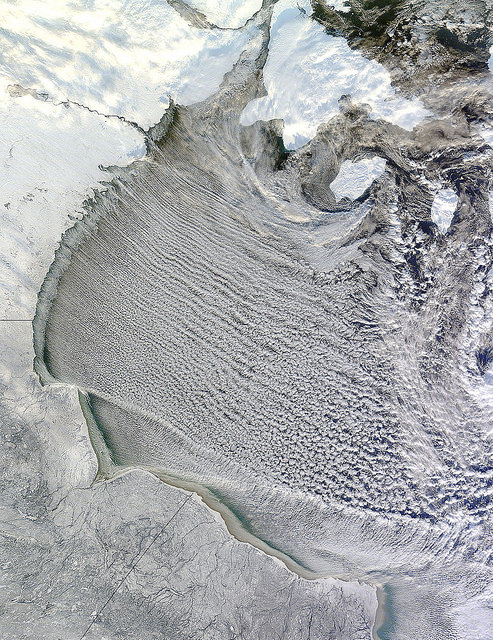
NASA' Terra satellite captured cloud streets in Hudson Bay, Canada on November 20, 2011 at 12:25 p.m. EST (17:25 UTC). Credit: NASA
[/caption]
I love looking at unusual cloud formations, and these have to be some of the most intriguing. These long, horizontal rolls of clouds are called “cloud streets” and NASA’s Terra satellite had a “drive by” of these clouds, observing them over Hudson Bay, Canada on November 20, 2011 at 12:25 p.m. EST (17:25 UTC). These rows of clouds stretch from northwest to southeast over the Hudson Bay.
Cloud streets are long lines or bands of cumulus clouds that usually form within the lower one to three kilometers of the atmosphere, and come from eddies in the atmosphere.
According to NASA’s Earth Observatory and the Goddard Space Flight Center Flickr page, cloud streets form when cold air blows over warmer waters, while a warmer air layer—or temperature inversion—rests over top of both. The comparatively warm water of Hudson Bay gives up heat and moisture to the cold air mass above, and columns of heated air—thermals—naturally rise through the atmosphere. As they hit the temperature inversion like a lid, the air rolls over like the circulation in a pot of boiling water. The water in the warm air cools and condenses into flat-bottomed, fluffy-topped cumulus clouds that line up parallel to the wind.
Hudson Bay is a large body of saltwater located in northeastern Canada. Also in the image, are several snow-covered islands in Hudson Bay. The larger island to the north is South Hampton Island, and the smaller island east is Coats Island, and further east is Mansel Island.
What more can we say? The view from the International Space Station is incredible, and this latest time-lapse sequence of photographs was put together by Michael König. These views are taken with a special low-light 4K-camera now on the Space Station, and covers August to October, 2011. The crews of expedition 28 & 29 were behind the camera, while König refurbished, smoothed, retimed, denoised, deflickered, and cut, etc. You can see all the images taken with this new camera at the Image Science & Analysis Laboratory website, The Gateway to Astronaut Photography of Earth
An airborne ‘eye in the sky’ has provided unprecedented views and details of a massive iceberg calving from its parent glacier in Antarctica. Essentially, we’re able to watch the process of an iceberg being born. NASA’s Operation IceBridge mission discovered a huge crack in the Pine Island Glacier in western Antarctica. The mammoth rift extends at least 18 miles and is 50 meters deep, and scientists say it could produce an iceberg more than 800 square kilometers in size.
“We are actually now witnessing how it happens and it’s very exciting for us,” said IceBridge project scientist Michael Studinger, Goddard Space Flight Center, Greenbelt, Md. “It’s part of a natural process but it’s pretty exciting to be here and actually observe it while it happens. To my knowledge, no one has flown a lidar instrument over an actively developing rift such as this.” Continue reading “An Iceberg Caught in the Act of Forming”
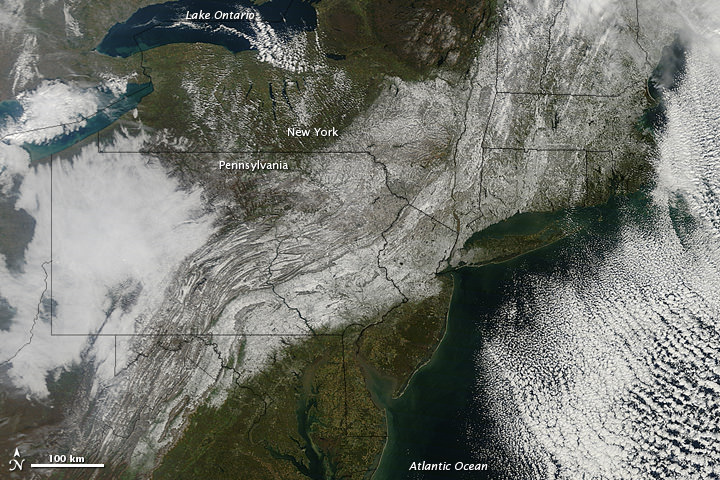
The 'Snowtober' storm in the Northeastern US, as seen by the The Moderate Resolution Imaging Spectroradiometer (MODIS) on NASA’s Terra satellite. Credit: NASA
[/caption]
An unusual October storm dumped wet heavy snow across much of the Northeast US over the weekend, as much as 32 inches (81 centimeters) in some areas. Nicknamed “Snowtober,” the storm left as many as 3 million people without power at the snowstorm’s peak, and was blamed for the deaths of at least 10 people. In this images from the Moderate Resolution Imaging Spectroradiometer (MODIS) on NASA’s Terra satellite, a swath of snow sweeps from West Virginia northeastward to Maine, as seen on Oct. 30, 2011. Clouds hover east and west of the snow, blocking the satellite sensor’s view of western Pennsylvania and parts of the Atlantic Ocean.
The storm broke snowfall-total records in many cities, with strong winds and heavy tree damage as the heavy snow easily clung to trees which still had their leaves, snapping branches and power lines.
The National Polar-orbiting Operational Environmental Satellite System Preparatory Project, or NPP, launched successfully on a Delta 2 rocket early today at at 5:48 a.m. EDT 09:48 GMT (or precisely at 2:48:01.828 a.m. PDT, according to NASA’s Twitter feed). The next generation satellite will measure both global climate changes and key weather variables, as well as test new technologies for future Earth observing satellites.
The spacecraft has also successfully separated and is now in orbit. The separation video is below.
A new satellite that will test key technologies and instruments for the next generation of climate and weather-monitoring satellites is scheduled to launch on Friday, Oct. 28, 2011. The NPOESS Preparatory Project (NPP) mission has a planned liftoff from Vandenberg Air Force Base in California at 5:48 a.m. EDT/2:48 a.m. PDT.
NASA put out this video last week and we missed covering it, but this is a very interesting little video that takes you on a narrated global tour of tens of millions of fires detected from space between July 2002 and July 2011. Yes, that’s right, tens of millions of fires on Earth, and these aren’t tiny little campfires — they are big enough to be seen from space. The video was created from new satellite data visualizations, and is combined with satellite views of vegetation and snow cover to show how fires relate to seasonal changes. The research helps scientists understand how fire affects our environment on local, regional and global scales. Continue reading “As the World Burns: Satellites Watch Fires Around the World”