[/caption]
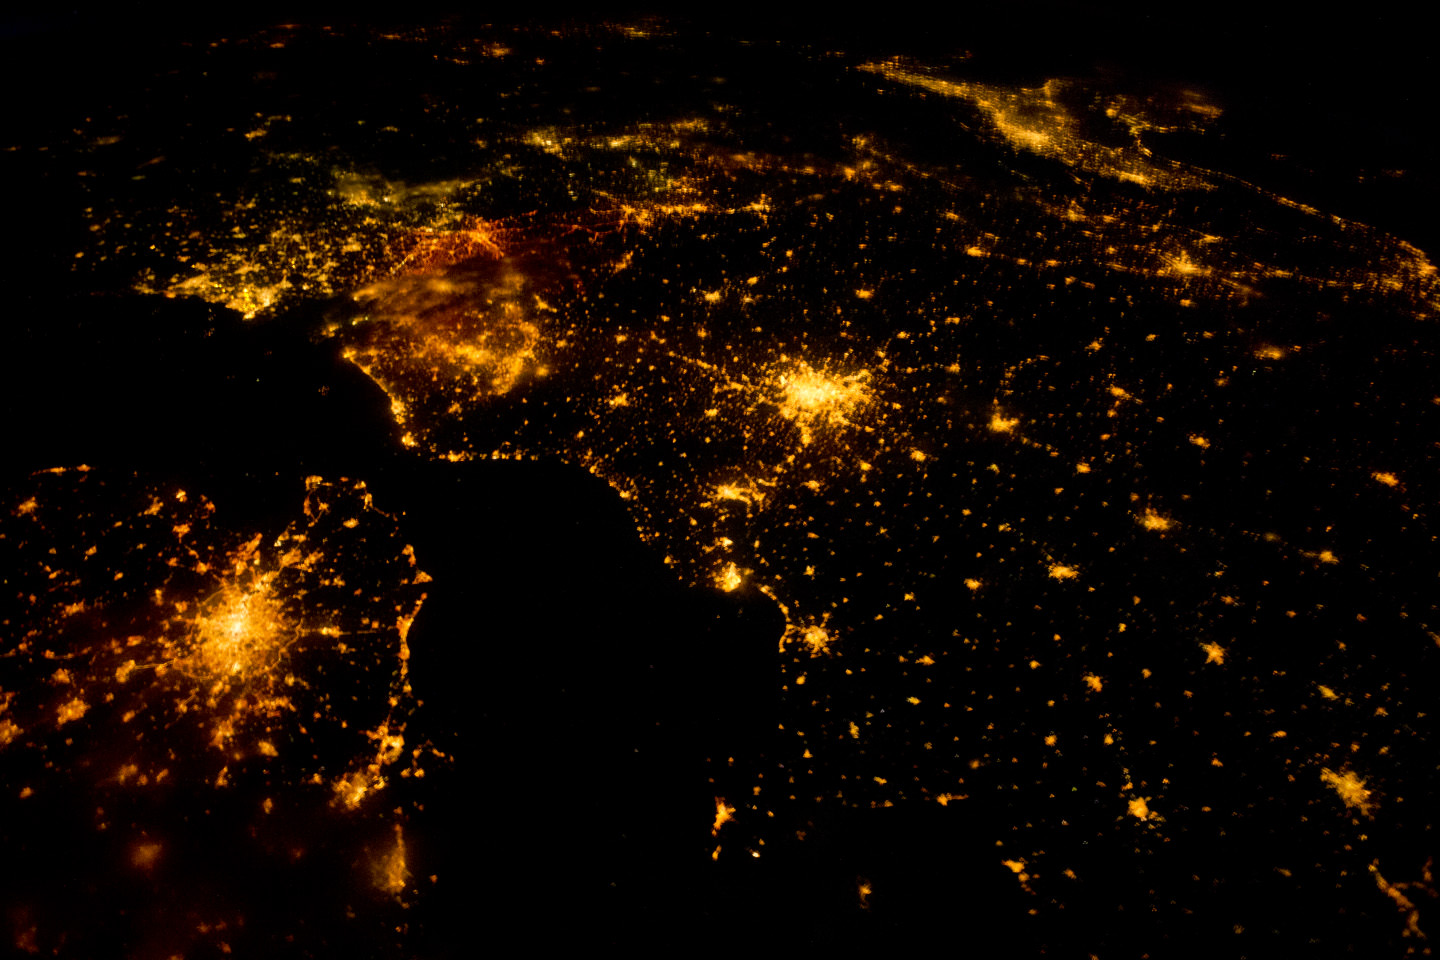
There is an oft-repeated and perhaps beautiful saying that you can’t see political borders from space. Well, it turns out that saying isn’t true; not anymore. ISS astronaut Ron Garan took this image recently which clearly shows the border between India and Pakistan. Since 2003, India has illuminated the border with Pakistan by floodlights in attempt to prevent ammunition trafficking and the infiltration of terrorists.
“Since the beginning of human spaceflight fifty years ago, astronauts have reflected on how peaceful, beautiful, and fragile the Earth looks from space,” Garan wrote on his Fragile Oasis blog. “These reflections are not clichés that astronauts say because it feels good. It is truly moving to look at the Earth from space.”
But seeing this clearly visible political border was sobering for Garan and his crewmates.
“Realizing what this picture depicted had a big impact on me,” he said. “When viewed from space, Earth almost always looks beautiful and peaceful. However, this picture is an example of man-made changes to the landscape in response to a threat, clearly visible from space. This was a big surprise to me.”
Garan added, however, that the point here is not that we can look down at the Earth and see a man-made border between India and Pakistan. “The point is that we can look down at that same area and feel empathy for the struggles that all people face,” he said. “We can look down and realize that we are all riding through the Universe together on this spaceship we call Earth, that we are all interconnected, that we are all in this together, that we are all family.”
Garan said he believes our world is a place where possibilities are limited only by our imagination and our will to act. “It is within our power to eliminate the suffering and poverty that exist on our planet,” he said.
Read more on Fragile Oasis.
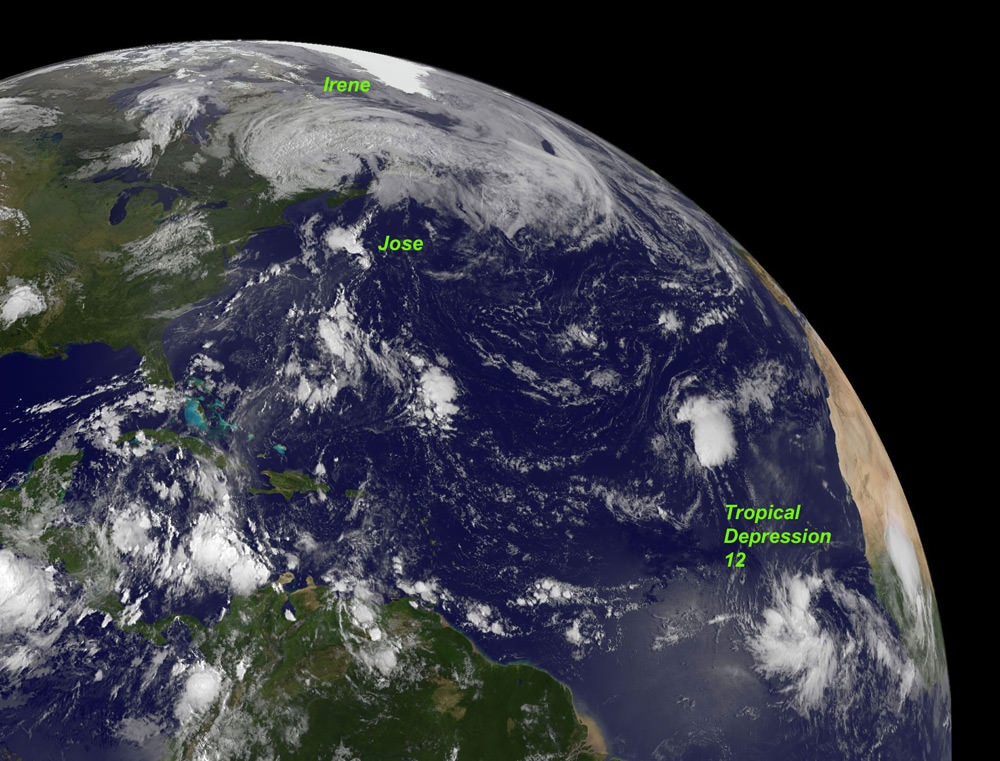
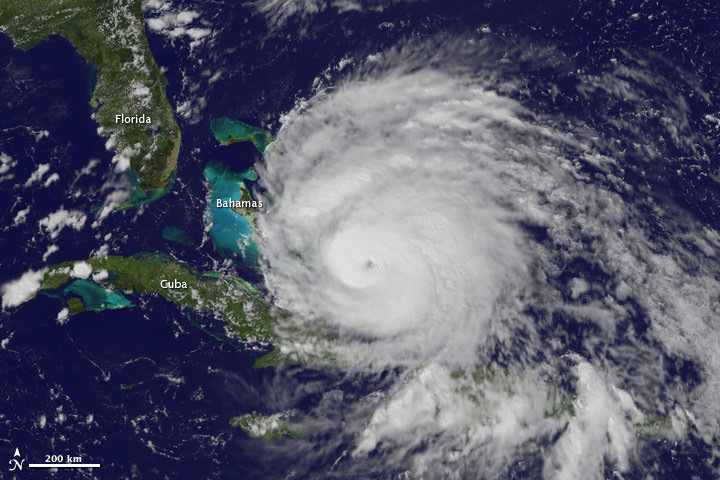

 on the Terra satellite on August 25. Credit: NASA")


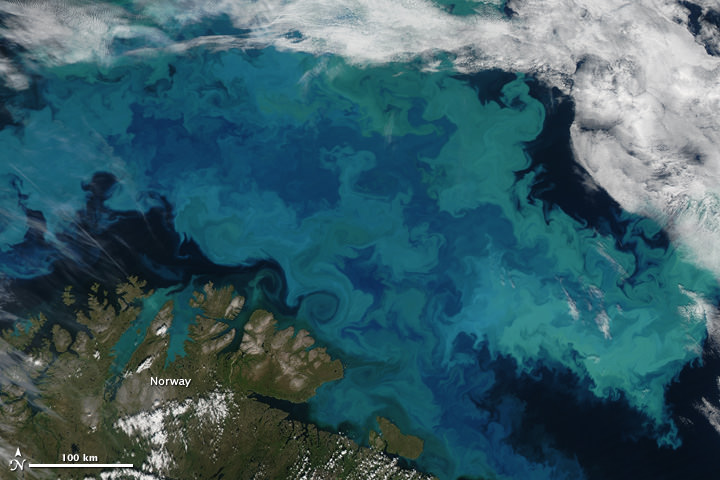

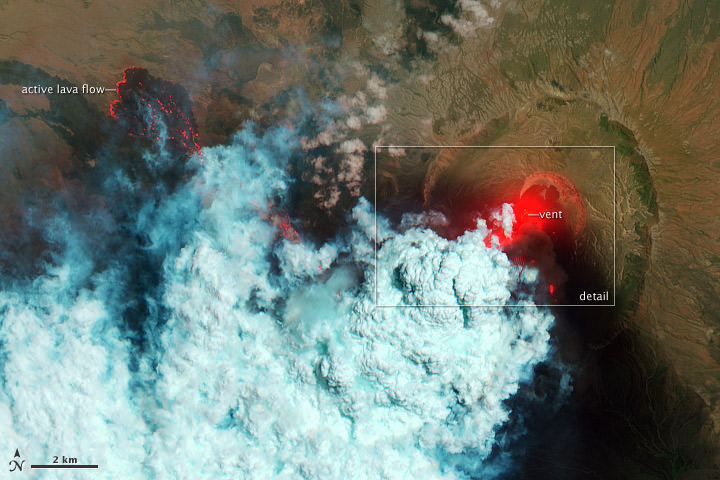
 aboard the Earth Observing-1 (EO-1) satellite.")