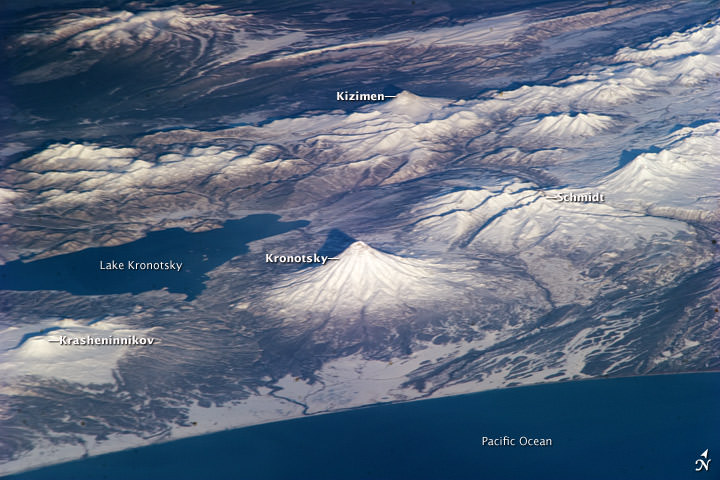
Several volcanoes in Russia, as seen by astronauts on the ISS. Credit: NASA
[/caption]
What a view! This photograph taken by one of the astronauts on the International Space Station shows several snow-covered volcanoes on Russia’s Kamchatka Peninsula. It also illustrates one of the unique attributes of the ISS —the ability to view landscapes at an angle, rather than the straight-down view typical of many satellite-based sensors. This oblique view, together with shadows cast by the volcanoes and mountains, provides a unique view — as well as a different perspective about the topography of the region.
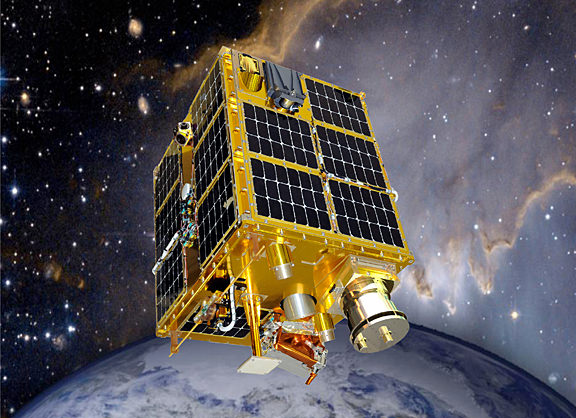
NASA successfully launched its first 'FASTSAT' on Nov. 17, 2010. Image Credit: NASA
[/caption]
While the U.S. Air Force unsuccessfully tried to get a Delta IV off the ground in Florida – things worked out far better for NASA at the Kodiak Launch Complex located in Kodiak, Alaska. Friday’s Minotaur 4 rocket launch successfully accomplished its mission of placing not one – but six satellites into orbit some 400 miles above the Earth.
The mission took off just before sunset from Launch Pad 1. After launch the $170 million flight turned southeast from its launch site going out over the Pacific Ocean. The launch took place under a clear sky with the moon lighting its way.
The payload for this flight was a rather mixed bag of NASA, military and university experiments. All six of the launch vehicle’s payloads were released right on time about 30 minutes after launch. The so-called ‘FASTSAT’ for Fast, Affordable, Science and Technology Satellite automatically switched itself on upon deployment. The project is a demonstration of ways to deploy experiments and other payloads cheaply and effectively to orbit.
Four of the satellites that were onboard the STP-S26 mission included the “ESPA-class:” STPSat-2, FalconSAT-5, FASTSAT-HSV01 and FASTRAC.
The FASTSAT program is NASA’s first microsatellite designed to provide multiple customers with access to orbit – at a lower cost. The main goal of the FASTSAT flight is to prove the viability of this capability to various government, academic and industry customers. The intent is to show that you do not have to invest millions of dollars into a single, large-scale satellite to conduct experiments on orbit.
The launch vehicle itself is also rather cheap as it is comprised of spare Peacekeeper missile tech. The STP-S26 mission was powered to orbit by a Minotaur IV launch vehicle, which was provided by the Rocket Systems Launch Program. The Minotaur IV is produced by Orbital Sciences Corporation.
One of the ‘firsts’ on this flight was the utilization of the Hydrazine Auxiliary Propulsion System (HAPS) to allow for dual-orbit capabilities. It is hoped, that in future flights this could be used to allow satellites to other orbits to give them far greater flexibility.
Another first employed on this mission was the first to use the Multi-Mission Satellite Operations Center Ground System Architecture. This center is capable of operating various satellites at the same time at a minimal cost. Indeed, the overriding theme of this launch would appear to be providing access to orbit – for less.
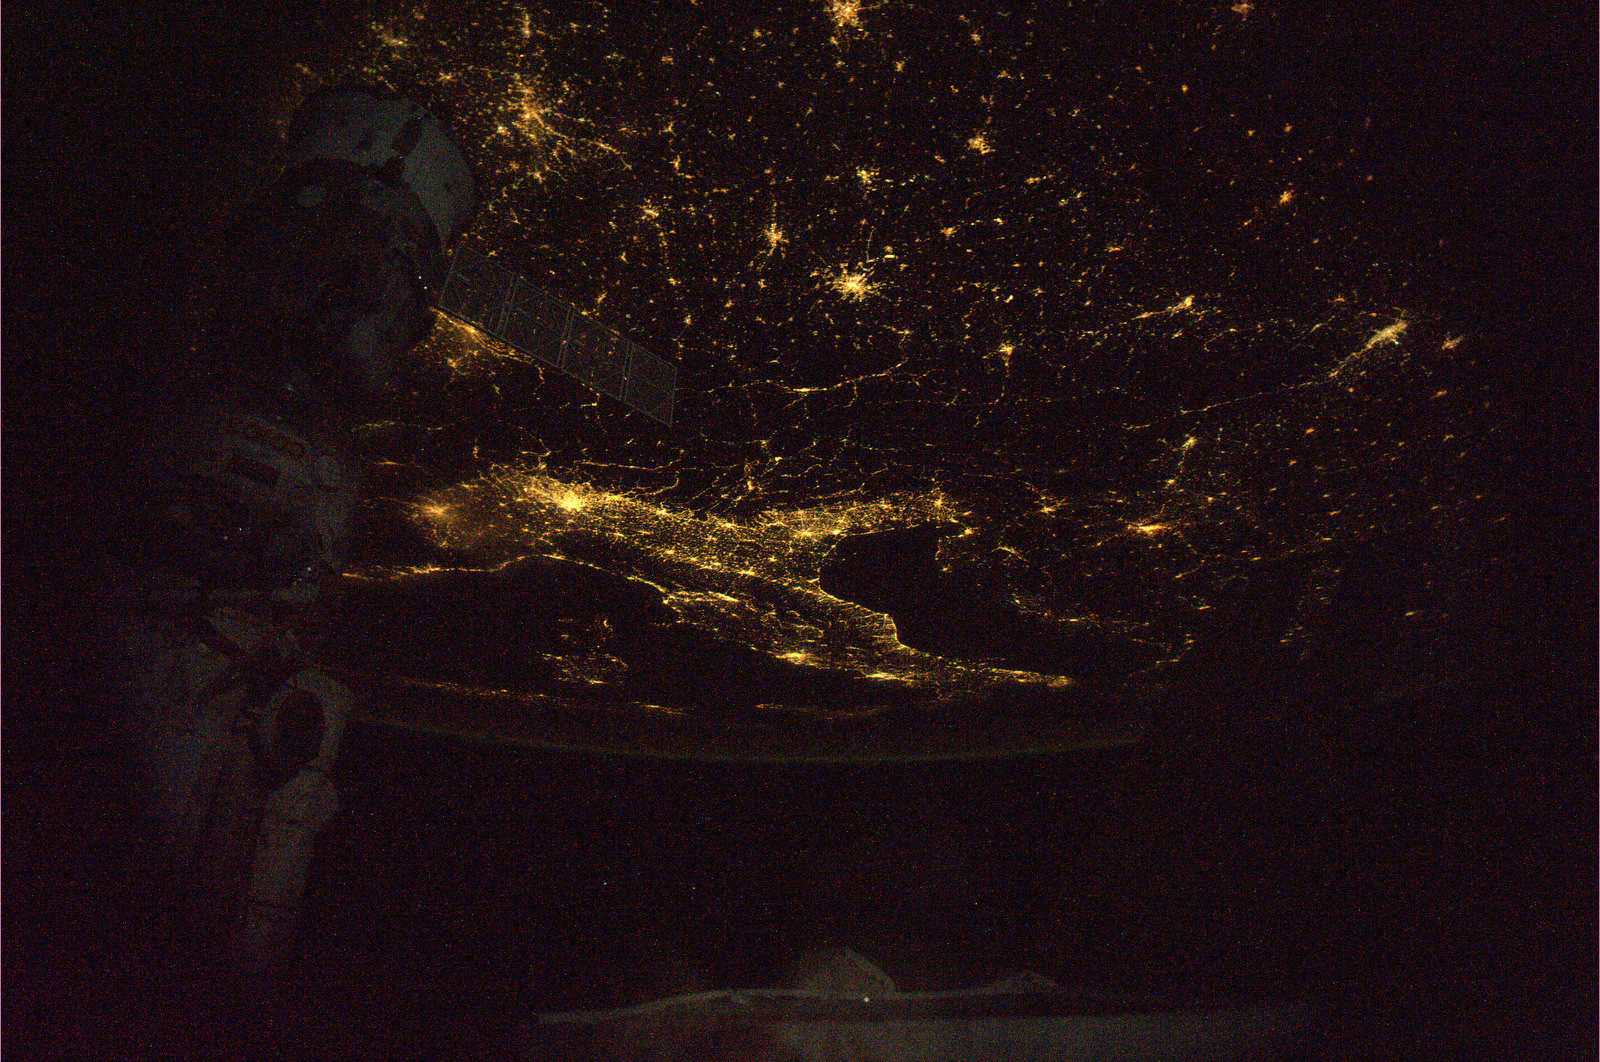
The first image from NASA's new geography trivia contest.
[/caption]
You can now test your knowledge of the world’s geography in a new trivia game on Twitter sponsored by NASA and the astronauts on board the International Space Station. It is kind of like our own “Where In the Universe Challenge” but strictly of images from Earth, and in this contest, there are even actual prizes. Astronaut Scott Kelly started the game this week, which is Geography Awareness Week. His vantage point is perfect for hosting the game, as where else can you get a better view of the various geographical features on our planet than from the International Space Station?
First of all, you have to be on Twitter, and follow Kelly: @StationCDRKelly. He’ll post a link to an image he took, and the first person to correctly identify the place depicted in his photos will win an autographed copy of the picture.
“Expanding our geography knowledge is essential to our economic well-being, our relationships with other nations and the environment,” Kelly said. “It helps us make sense of our world and allows us to make connections between people and places. Space exploration is a global endeavor, and the International Space Station is the result of these connections.”
The new trivia game is a way to engage the public in the activities of the ISS, and the pictures that Kelly, and other astronauts take from the station aren’t all just fun and games. “From the cupola, which is much like a bay window in a house, we are able to take pictures for many scientific reasons, but also to share with the public what we are learning about the planet on which we live,” Kelly said.
Kelly launched to the space station along with two Russian cosmonauts, Alexander Kaleri and Oleg Skripochka on Oct. 8. He is set to return to Earth March 16, 2011. The space station and its six crew members orbit the Earth more than a dozen times each day, traveling more than 320 km (200 miles) above Earth at 28,000 kph (17,500 mph).
Merapi Volcano on November 10, 2010, when the Moderate Resolution Imaging Spectroradiometer (MODIS) on NASA’s Terra satellite. Credit: NASA
[/caption]
For about three weeks, Indonesia’s Mount Merapi has been belching out lava, as well as ash and gas, clouding the atmosphere above. This satellite image, taken by NASA’s MODIS instrument on the Terra satellite, shows the volcano now settling down and is the most cloud-free satellite view of the volcano that we’ve been able to see. Thick ash is still rising and the volcano is still considered to be erupting at dangerous levels. Merapi is one of Indonesia’s most active volcanoes, and this eruption has been the most violent since the 1870’s.
The dark brown streak down the southern face of the volcano is ash and other volcanic material deposited by a pyroclastic flow or lahar. The volcano has been blamed for 156 deaths and about 200,000 people had to evacuate. The ash also caused flights to be delayed or canceled.
See below for a thermal image of the lava flow.
The Advanced Spaceborne Thermal Emission and Reflection Radiometer (ASTER) on NASA’s Terra satellite captured the thermal signature of hot ash and rock and a glowing lava dome on Mount Merapi on Nov. 1, 2010. Credit: NASA.
As a very active volcano, Merapi poses a constant threat to thousands of people in Indonesia. The Advanced Spaceborne Thermal Emission and Reflection Radiometer (ASTER) on NASA’s Terra satellite captured the thermal signature of hot ash and rock and a glowing lava dome. The thermal data is overlaid on a three-dimensional map of the volcano to show the approximate location of the flow. The three-dimensional data is from a global topographic model created using ASTER stereo observations.
For more information see NASA’s Earth Observatory website.
At best, the few extrasolar planets we have imaged directly are just points of light. But what can that light tell us about the planet? Maybe more than we thought. As you probably know the, Deep Impact spacecraft flew by comet Hartley 2 today, taking images from only 700 km away. But maneuvering to meet up with the comet is not the only job this spacecraft has been doing. The EPOXI mission also looked for ways to characterize extrasolar planets and the team made a discovery that should help identify distinctive information about extrasolar planets. How did they do it? By using the Deep Impact spacecraft to look at the planets in our very own solar system.
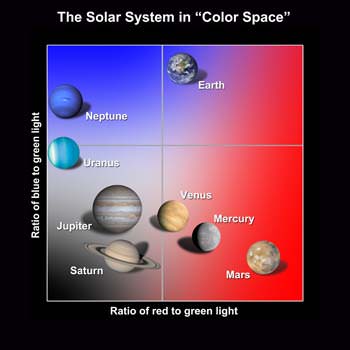
The spacecraft imaged the planetary bodies in our solar system — in particular the Earth, Mars and our Moon — (see here for movies of the Moon transiting Earth) and astronomer Lucy McFadden and UCLA graduate Carolyn Crow compared the reflected red, blue, and green light and grouped the planets according to the similarities they saw. The planets fall into very distinct regions on this plot, where the vertical direction indicates the relative amount of blue light, and the horizontal direction the relative amount of red light.
This suggests that when we do have the technology to gather light from individual exoplanets, astronomers could use color information to identify Earth-like worlds. “Eventually, as telescopes get bigger, there will be the light-gathering power to look at the colors of planets around other stars,” McFadden says. “Their colors will tell us which ones to study in more detail.”
On the plot, the planets cluster into groups based on similarities in the wavelengths of sunlight that their surfaces and atmospheres reflect. The gas giants Jupiter and Saturn huddle in one corner, Uranus and Neptune in a different one. The rocky inner planets Mars, Venus, and Mercury cluster off in their own corner of “color space.”
But Earth really stands out, and its uniqueness comes from two factors. One is the scattering of blue light by the atmosphere, called Rayleigh scattering, after the English scientist who discovered it. The second reason Earth stands out in color is because it does not absorb a lot of infrared light. That’s because our atmosphere is low in infrared-absorbing gases like methane and ammonia, compared to the gas giant planets Jupiter and Saturn.
“It is Earth’s atmosphere that dominates the colors of Earth,” Crow says. “It’s the scattering of light in the ultraviolet and the absence of absorption in the infrared.”
So, this filtering approach could provide a preliminary look at exoplanet surfaces and atmospheres, giving us an inkling of whether the planet is rocky or a gas planet, or what kind of atmosphere it has.
EPOXI is a combination of the names for the two extended mission components for the Deep Impact spacecraft: the first part of the acronym comes from EPOCh, (Extrasolar Planet Observations and Characterization) and the flyby of comet Hartley 2 is called the Deep Impact eXtended Investigation (DIXI).
Fire scars in Australia are featured in this image photographed by an Expedition 5 crewmember on the International Space Station (ISS). Bright orange fire scars show up the underlying dune sand in the Simpson Desert, Credit: NASA
The International Space Station has been orbiting the Earth every day for over 10 years, and the astronauts all say their favorite pastime is looking at the Earth. During the past 10 years, the crews have taken some great pictures of our planet, and these images provide a unique look at our world. These are just a few of the spectacular views of Earth from the space station.
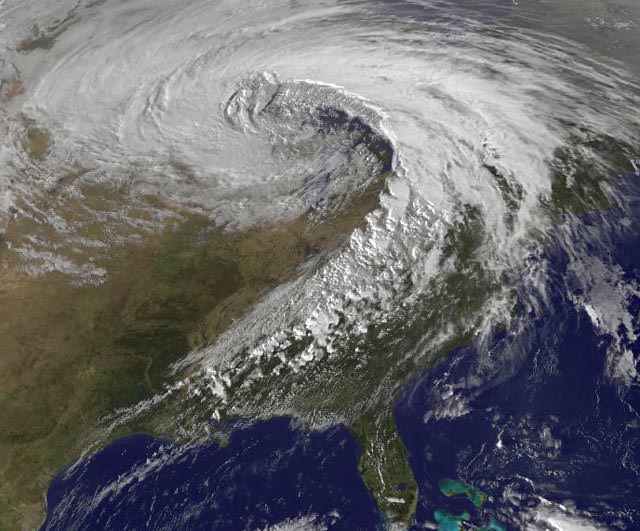
Visible satellite image of the October 26, 2010 superstorm taken at 5:32pm EDT. Image credit: NASA/GSFC.
[/caption]
Yowza! – Here’s a satellite image of a storm of record-breaking proportions. On October 26, 2010, the strongest storm ever recorded in the Midwest spawned 24 tornadoes, 282 reports of damaging winds, violent thunderstorms, and torrential rains. The mega-storm reached peak intensity late yesterday afternoon over Minnesota, resulting in the lowest barometric pressure readings ever recorded in the continental United States (except for from hurricanes and nor’easters affecting the Atlantic seaboard.) The storm continues today (Oct. 27) with more tornado watches posted for Mississippi, Alabama, and Georgia, a blizzard warning for North Dakota, high wind warnings for most of the upper Midwest, and near-hurricane force winds on Lake Superior.
Read more about this super-storm on Weather Underground, but see below for what extremely low air pressure means.
Air pressure is one of the most important factors which determines what the weather is like. A mass of low pressure is an area of air that is rising. As it rises, it expands and cools. Cooler air cannot hold as much water as warmer air, so as the air rises the water will condense and form clouds. This is why an area of low pressure will often be accompanied by clouds and rain — which is what occurred on October 26 — lots of clouds and lots of rain and even snow.
But winds were even a bigger factor in this superstorm. Our atmosphere really doesn’t like big differences in air pressure, so where areas of low pressure meet up with areas of high pressure, winds blow in an attempt to combat the differences in the air pressure. The larger the difference in pressure the stronger the winds will blow. So, the extreme low pressure readings yesterday meant the winds were really howling — and they were. In my neighborhood in Illinois, we had a fairly study flagpole get bent from the winds. But that was nothing compared to the hurricane-like winds other places experienced: for example, Grand Marais, Minnesota — near the Great Lakes and near the area of the lowest air pressure readings — had sustained winds of 43 mph gusting to 59 mph, lasting for over 7 hours. Today, that region is still getting pummeled by winds and snow.
You can see the link to Weather Underground above to see what other weather extremes were experienced during this storm.
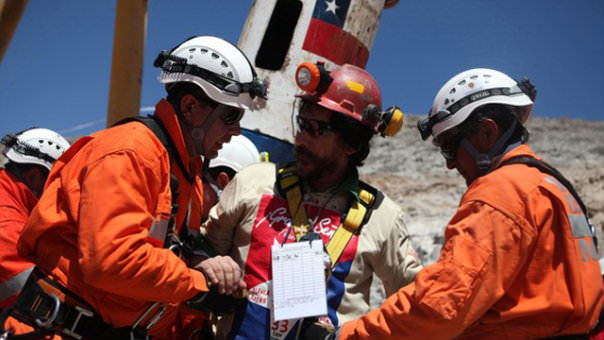
Oct. 13, 2010: Trapped miner Victor Segovia reaches the surface to become the 15th to be rescued from the San Jose mine in Copiapo. Source: Reuters
[/caption]
The world has been transfixed by the rescue of 33 miners trapped nearly a kilometer (about a half a mile) underground in the San Jose mine near Copiapo, Chile. Seeing the men emerge from their 69-day-long ordeal has been emotional for everyone involved, as well as for those of us just watching from afar. But were it not for NASA, the rescue might not be going as smoothly and trouble-free as, thankfully, it has. NASA’s expertise in long duration space missions – which are similar in many respects to what the miners endured – as well as the space agency’s knowledge in specialized engineering and training for emergencies has been invaluable during the rescue operations. NASA provided suggestions regarding the rescue cages that were specially-designed to pull the trapped miners out of the narrow shaft that was drilled to rescue them, and also is providing on-site expert advice on medical, nutritional and behavioral health issues.
“What we brought to the table for the Chileans was our experience in behavior health support, not only in terms of the confinement and entrapment for that period of time but also what the miners and the families could experience once the miner had been rescued,” said Dr. Michael Duncan, who led the team of NASA experts who traveled to Chile, in answer to a question posed by Universe Today during a web chat. “In working with our astronauts and their families we prepare them beforehand and we support them during the mission and we support them after the astronaut returns. And I think our expertise in those areas was very helpful for the Chilean doctors and psychologists.”
Among NASA’s suggestions were an increased supplement of Vitamin D to normalize sleep patterns and developing an organized daily routine that includes exercise.
NASA also helped with diet suggestions which would help their well being during their entrapment, as well as making sure the miners would be well enough and trim enough to ride in the rescue capsule.
Indeed, the miners have emerged looking healthy and several have bounded out from the capsule, running to hug family and friends or greet the cheering crowd.
When the Chilean engineers decided a capsule was the best way to rescue 33 trapped miners, the NASA Engineering and Safety Center (NESC) provided about 75 recommendations, said Clinton Cragg, principal engineer at NESC, in an interview on WAVY.com. Most of those design elements found their way into the 4-meter (13 foot) 420 kg (926-pound) capsule dubbed “Phoenix.”
With the cramped, one-at-a-time ride taking 20 minutes or more, the miners are monitored by video on the way up for any sign of distress or panic. They have oxygen masks, dark glasses to protect their eyes from unfamiliar daylight and sweaters for the huge temperature differences from the heat of underground to the chilling cold in the high altitude Atacama Desert in Chile.
Satellite image of the San Jose Mine area where the miners were trapped. NASA Earth Observatory image created by Jesse Allen and Robert Simmon, using Earth Observer-1 satellite.
“The Chileans had a very limited set of requirements that they had given their own engineers with regards to how to design this cage, and that was primarily length, diameter, and weight,” said Duncan. “Looking at the video of the cage, some of these things they’ve certainly incorporated into their design.”
In an image from video, rescuer Manuel Gonzalez Pavez reaches the 33 miners in the collapsed mine. Source: AP
Now that the miners are safe, Duncan said each will be observed for any medical conditions that they may have developed. “Of course, we’re looking for things like skin infections or infections of the sinuses or the lungs,” he said during the web chat. “Something that they may have acquired due to exposure to the warm, humid and dusty conditions in the mine.”
In regards to the psychological health of the miners, Duncan said doctors and psychologists have been working with the miners and their families in an effort to educate them on these types of issues and the sudden celebrity that the miners now find themselves in, and they hope to try to prevent any future psychological issues from occurring.
The NASA team assisting the Chilean rescue included two medical doctors, Duncan and J.D Polk; psychologist Al Holland and Cragg.
“I am proud of the people of this agency who were able to bring the experience of spaceflight down to Earth when it was needed most,” said NASA Administrator Charlie Bolden in a statement. “As the drama of this rescue continues to unfold before us, we pray for the safe return of each and every miner.”
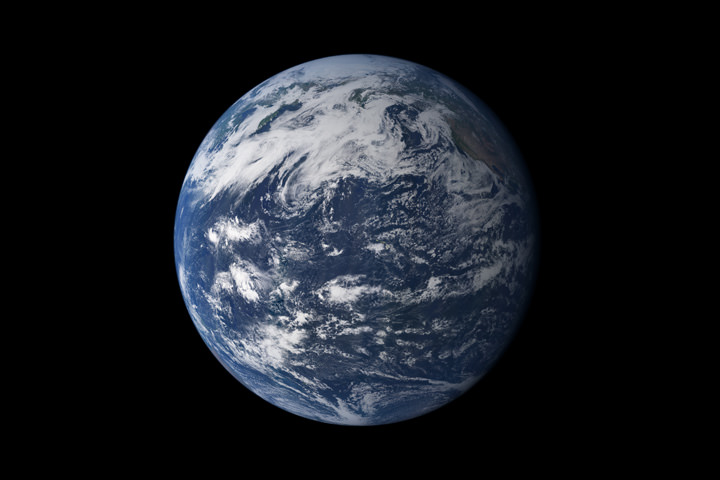
A new NASA image of Earth, by Robert Simmon and Marit Jentoft-Nilsen, based on MODIS data.
[/caption]
Despite recent news of potential habitable exoplanets and amazing images of Mars and the Saturn system returned from visiting spacecraft, the ol’ home planet is still about the most gorgeous-looking planetary body out there. We first saw it as a whole “blue marble” when the Apollo astronauts sent back pictures while circling the Moon, and it has been said that the original “Blue Marble” image taken by the Apollo 17 crew has been one of the most viewed and most influential images ever. But truth be told, that “Blue Marble” really wasn’t all that blue (see the original below). However, this new look at the home world shows how prevalent water really is. This composite image is based largely on observations from the Moderate Resolution Imaging Spectroradiometer (MODIS) on NASA’s Terra satellite.
It sure is pretty.
According to the NASA Earth Observatory website, Earth’s water content is about 1.39 billion cubic kilometers (331 million cubic miles), with the bulk of it, about 96.5%, being in the global oceans. As for the rest, approximately 1.7% is stored in the polar icecaps, glaciers, and permanent snow, and another 1.7% is stored in groundwater, lakes, rivers, streams, and soil. Only a thousandth of 1% of the water on Earth exists as water vapor in the atmosphere.
Here’s the original “Blue Marble,” the view of the Earth as seen by the Apollo 17 crew traveling toward the moon. This translunar coast photograph extends from the Mediterranean Sea area to the Antarctica south polar ice cap. This is the first time the Apollo trajectory made it possible to photograph the south polar ice cap. Almost the entire coastline of Africa is clearly visible. The Arabian Peninsula can be seen at the northeastern edge of Africa. The large island off the coast of Africa is Madagascar. The Asian mainland is on the horizon toward the northeast.
The original 'Blue Marble' taken by Apollo 17. Credit: NASA
Those lucky enough to have gone to space have come back with a changed perspective and reverence for the planet Earth. Unlike the time of the first space explorers, we now have video and still cameras streaming back images from space, and we can get an inkling of what Earth must look like up there from orbit . The International Space Station orbits the Earth, completing one trip around the globe every 92 minutes. Cruising along at 27,700 km (17,200 miles) per hour, the astronauts experience 15 or 16 sunrises and -sets every day. This sequence of time-lapse photographs reveals the views from roughly half an orbit of the International Space Station, beginning with sunrise over Northern Europe to sunset southeast of Australia, on April 12, 2010. Visible is the visiting space shuttle Discovery, during the STS-131 mission. Continue reading “Sunrise to Sunset: Time-Lapse View from the ISS”


 on NASA’s Terra satellite captured the thermal signature of hot ash and rock and a glowing lava dome on Mount Merapi on Nov. 1, 2010. Credit: NASA.")
. Bright orange fire scars show up the underlying dune sand in the Simpson Desert,")