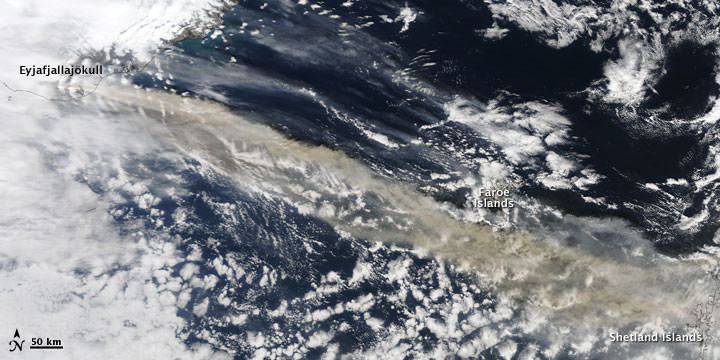
NASA's Terra Satellite captured this image on April 15, 2010 of the volcano and resulting ash plume. NASA image by Jeff Schmaltz, MODIS Rapid Response Team at NASA GSFC.
A volcano under a glacier in Iceland erupted Wednesday, melting ice, shooting smoke and steam into the air and forcing hundreds of people to leave their homes. The resulting ash plume has also halted air traffic over much of Europe. Scientists said the eruption under the ice cap was 10 to 20 times more powerful than an eruption from the that happened from the Eyjafjallajokullin Volcano late last month. “This is a very much more violent eruption because it’s interacting with ice and water,” said Andy Russell, an expert in glacial flooding at the University of Newcastle in northern England, in an article on the CBC website. The dramatic footage in the video here was released today, April 15, and satellite images, below, show how far the ash plume has traveled.
[/caption]
The iceland volcano sent a plume of ash and steam across the North Atlantic prompting airspace closures in the United Kingdom, Ireland, France, and Scandinavia, which then had a ripple effect, disrupting flights to and from other countries as well. Authorities could not say how long the airspace closure would last, and the ash’s spread threatened to force closures of additional airspace over the coming days.
NASA's EO-1 Satellite took this image on April 1, 2010. NASA image by Robert Simmon, using ALI data from the EO-1 team
This natural-color satellite image shows the area of the eruption on April 1, when a new vent opened up. The image was acquired by the Advanced Land Imager (ALI) aboard NASA’s Earth Observing-1 (EO-1) satellite.
The volcano, about 120 kilometres east of Reykjavik, erupted March 20 after almost 200 years of silence.
Pall Einarsson, a geophysicist at the University of Iceland, said magma was melting a hole in the thick ice covering the volcano’s crater, sending water coursing down the glacier, and causing widespread flooding.
Iceland’s main coastal ring road was closed near the volcano, and workers smashed a hole in the highway in a bid to give the rushing water a clear route to the coast and prevent a major bridge from being swept away.
The Global Hawk is a robotic plane that can fly autonomously to study Earth’s atmosphere, and can get to the area called the “Ignorosphere” that previously hasn’t been studied very well. The plane is carrying 11 instruments, and recently made its first science flight over the Pacific Ocean. “The Global Hawk is a fantastic platform because it gives us expanded access to the atmosphere beyond what we have with piloted aircraft,” said David Fahey, co-mission scientist and a research physicist at NOAA’s Earth System Research Laboratory in Boulder, Colo. “We can go to regions we couldn’t reach or go to previously explored regions and study them for extended periods that are impossible with conventional planes.” Continue reading “Unmanned Robo-Plane Makes First Science Observations”
The Goddard Space Flight Center has a Flickr account showcasing a series of images of our own home planet. Called “Blue Marble,” these spectacular images are the most detailed true-color image of the entire Earth to date. Using a collection of satellite-based observations, scientists and visualizers stitched together months of observations in 2001 of the land surface, oceans, sea ice, and clouds into a seamless, true-color mosaic of every square kilometer (.386 square mile) of our planet. Your tax dollars at work, these images are freely available to educators, scientists, museums, and the public. This record includes preview images and links to full resolution versions up to 21,600 pixels across.
Our blue marble. Credit: NASA
Compare these new images to the original “Blue Marble” photograph, below, taken by the Apollo 17 crew in 1968. The original Blue Marble by Apollo 17.
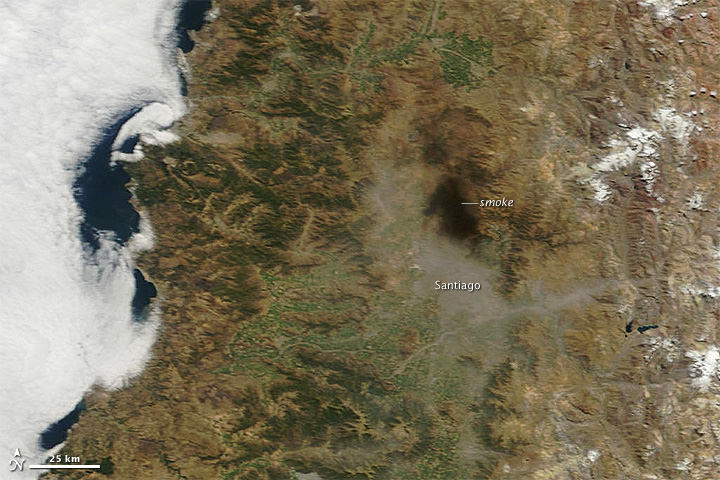
Smoke and haze linger over Santiago, Chile after the magnitude 8.8 earthquake on Feb. 27, 2010. Credit: NASA
[/caption]
Haze lingered over the metropolitan area of Santiago, Chile, following a magnitude 8.8 earth quake on February 27, 2010. In an image from the Moderate Resolution Imaging Spectroradiometer (MODIS) on NASA’s Terra satellite at 14:25 UTC, black smoke hung over the northern part of the city, while light-colored haze (perhaps pollution and/or dust) covered the southern part of the city and filled a canyon that cuts eastward into the mountains. Below, in an image acquired on February 23, shows the city and surroundings under clear-sky conditions.
The region around Santiago, Chile on Feb. 23, 2010, before the quake. Credit: NASA
Below, a map of topography and water depth of the west coast of South America, which is a subduction zone, where the Nazca Plate is plowing under the South America Plate at an average rate of 80 millimeters (3 inches) per year. Their collision gives rise to the spectacular Andes Mountains as well as to devastating earthquakes. Lighter colors indicate higher elevation on land and shallower depth in the water. Quake locations and magnitudes are indicated by black circles. The topography is based on radar data collected during the Shuttle Radar Topography Mission, which flew onboard Space Shuttle Endeavour in mid-February 2002.
A map showing topography, water depth and earthquake magnitudes. Credit: NASA
Santiago, the capital city of Chile. One day after the Mega earthquake(M8.8) hit the country. We wish the earliest recovery. Credit: Soichi Noguchi
[/caption] Astronaut Soichi Noguchi, (@Astro_Soichi) who has taken full advantage of being able to use Twitter live from the International Space Station, has been sending down a stream of images he has taken of Chile following the magnitude 8.8 earthquake that hit the country early Saturday. Just recently, he posted the above image, taken directly over Santiago. “Santiago, the capital city of Chile. One day after the Mega earthquake(M8.8) hit the country. We wish the earliest recovery,” Noguchi wrote on Twitter. He also took a video of the ISS astronaut’s view as they flew over Chile earlier today, below.
Here’s another image Noguchi took from the ISS, of the coastline of Chile, near Santiago.
Near Santiago, Chile. Coast line. Credit: Soichi Noguchi
And another, near Concepcion, Chile.
Coastline near Concepcion, Chile. Credit: Soichi Noguchi
For more images from space, follow @Astro_Soichi on Twitter.
The final spacecraft in this series of NASA and NOAA’s “GOES” geostationary environmental weather satellites is ready for launch. GOES stands for Geostationary Operational Environmental Satellite, and in evidence that not all acronyms turn out for the best, this latest satellite in the series is GOES-P. But (to quote the Bad Astronomer) this satellite will be a whiz in helping to provide continuous observations of severe weather events on Earth and space weather, too, as well as providing an update to search and rescue capabilities. Once in orbit GOES-P’s name will change to GOES-15. “GOES are the backbone of NOAA’s severe weather forecasts, monitoring fast-changing conditions in the atmosphere that spawn hurricanes, tornadoes, floods and other hazards,” said Steve Kirkner, GOES program manager at NASA’s Goddard Space Flight Center.
Launch is targeted for March 2, during a launch window from 6:19 to 7:19 p.m. EST from Space Launch Complex 37 at the Cape Canaveral Air Force Station on a Delta IV rocket. Universe Today will be on location to provide coverage of all the launch and pre-launch activities. Follow Nancy on Twitter for live updates.
“The latest series of satellites, GOES- N, O, and P has new capabilities in space weather,” said Dr. Howard Singer from NOAA. “This is data that arrives almost instantaneously and therefore allows us to provide very timely alerts and warnings.”
But GOES-P will be a back-up satellite. Once launched, it will be checked out and then stored on-orbit and ready for activation should one of the operational GOES satellites degrade or exhaust their fuel. Currently, NOAA operates GOES-12, (GOES East) and GOES-11 (GOES-West.) In late April, NOAA will activate GOES-13 to replace GOES-12, and move GOES-12 to provide coverage for South America as part of the Global Earth Observing System of Systems (GEOSS). NASA handed over GOES-14, launched last June, to NOAA on December 14, 2009.
In addition to weather forecasting on Earth, a key instrument onboard GOES-P, the Solar X-Ray Imager (SXI), will help NOAA continue monitoring solar conditions.
“The SXI is improving our forecasts and warnings for solar disturbances, protecting billions of dollars worth of commercial and government assets in space and on the ground, and lessening the brunt of power surges for the satellite-based electronics and communications industry,” said Tom Bodgan, director of NOAA’s Space Weather Prediction Center (SWPC) in Boulder, Colo.
GOES P is the last in the series. The first GOES satellite was launched in 1975.
GOES-P joins a system of weather satellites that provide timely environmental information to meteorologists and the public. The GOES system provides data used to graphically display the intensity, path and size of storms. Early warning of impending severe weather enhances the public’s ability to take shelter and protect property.
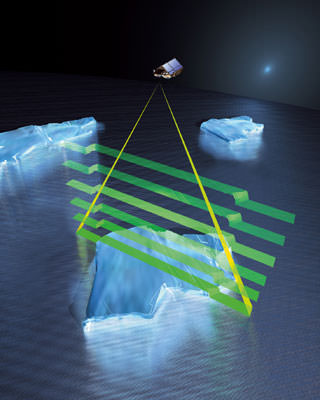
The ESA has scheduled the launch of Cryosat-2 for February 25th aboard a Russian Dnepr rocket from the Baikonur Cosmodrome in Kazakhstan. This is the second attempt at launching the Earth-observing satellite that’s tasked with monitoring global ice thickness. The initial launch of Cryosat on October 8th, 2005 failed due to an anomaly of the launch sequence.
Other Earth-observing satellites have taken measurements of the ice thickness near the poles, but Cryosat-2 will be the first such satellite completely dedicated to monitoring ice thickness variations, and will keep tabs on the decline of sea ice, which in the Arctic has been shown to have shrunk 2.7% per decade since 1978.
Cryosat-2 will have a highly inclined polar orbit, and will reach 88 degrees north and south, so as to maximize the amount of observations of the Earth’s poles. The instruments aboard the satellite will be able to monitor the thickness changes in both sea ice and land ice with an accuracy of one centimeter. This will give scientists an unprecedented amount of data to work with to study how Arctic and Antarctic ice changes impact climate change, and vice versa.
The instrument aboard Cryosat-2 that will be measuring ice thickness is the SAR/Interferometric Radar Altimeter (SIRAL). This is a an altimeter and interferometer that operates in the Ku-band (13.575 GHz), and uses radar signals bounced off the ice to measure its thickness variations.
Cryosat-2 also has two other instruments to determine its position with a high amount of accuracy, the Doppler Orbit and Radio Positioning Integration by Satellite (DORIS) and Laser Retro-Reflector (LRR). DORIS detects and measures the Doppler shift of signals broadcast from a network of radio beacons spread around the world to give the velocity of the satellite relative to the Earth.
The LRR instrument will complement and help calibrate DORIS. The LRR is a small laser retroreflector that is attached to the underside of the satellite, and lasers from a network of tracking stations will be fired at the satellite. By measuring the interval between the firing of the laser and the return of the pulse, the position of the satellite can be measured very accurately.
The mission has a three-year lifespan, with a potential for a two-year extension. Cryosat-2 is currently nestled safely inside the Dnepr rocket’s protective fairing, and in the next nine days the satellite will be integrated into the rest of the launcher and moved out to the launch pad.
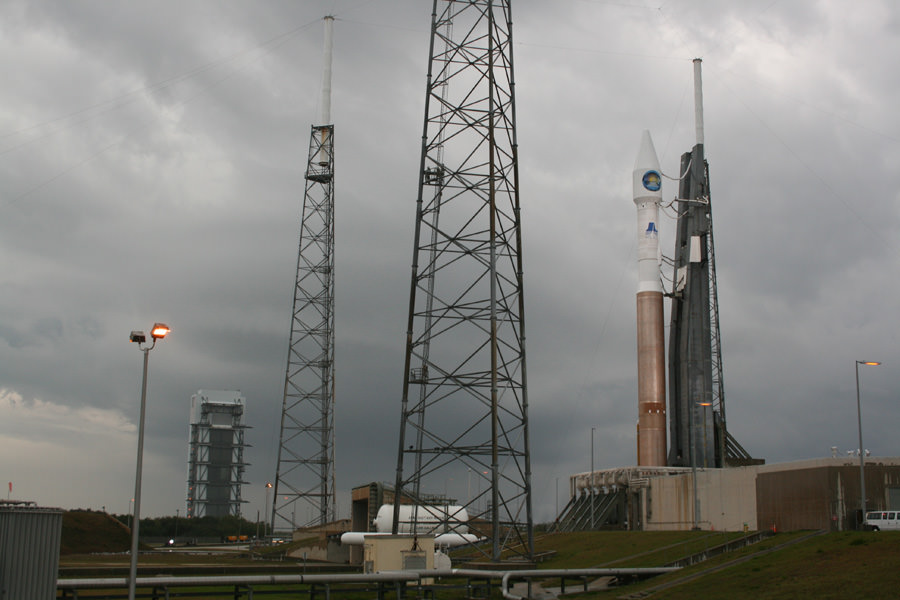
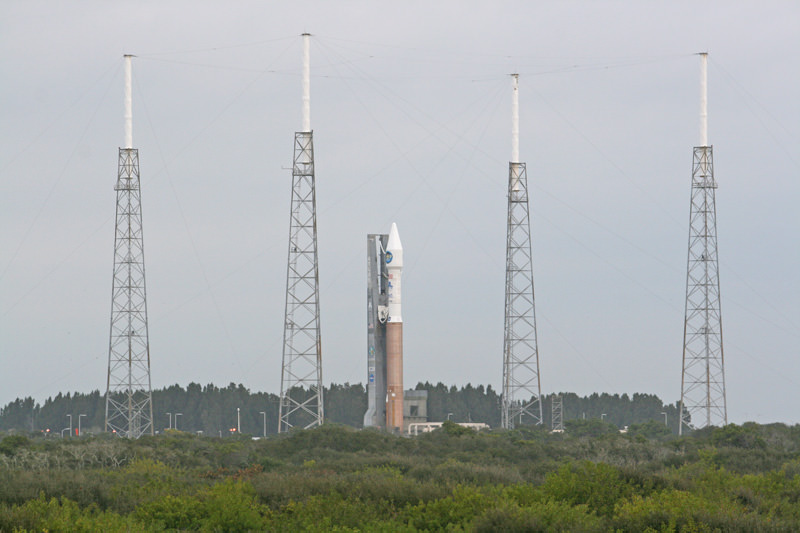
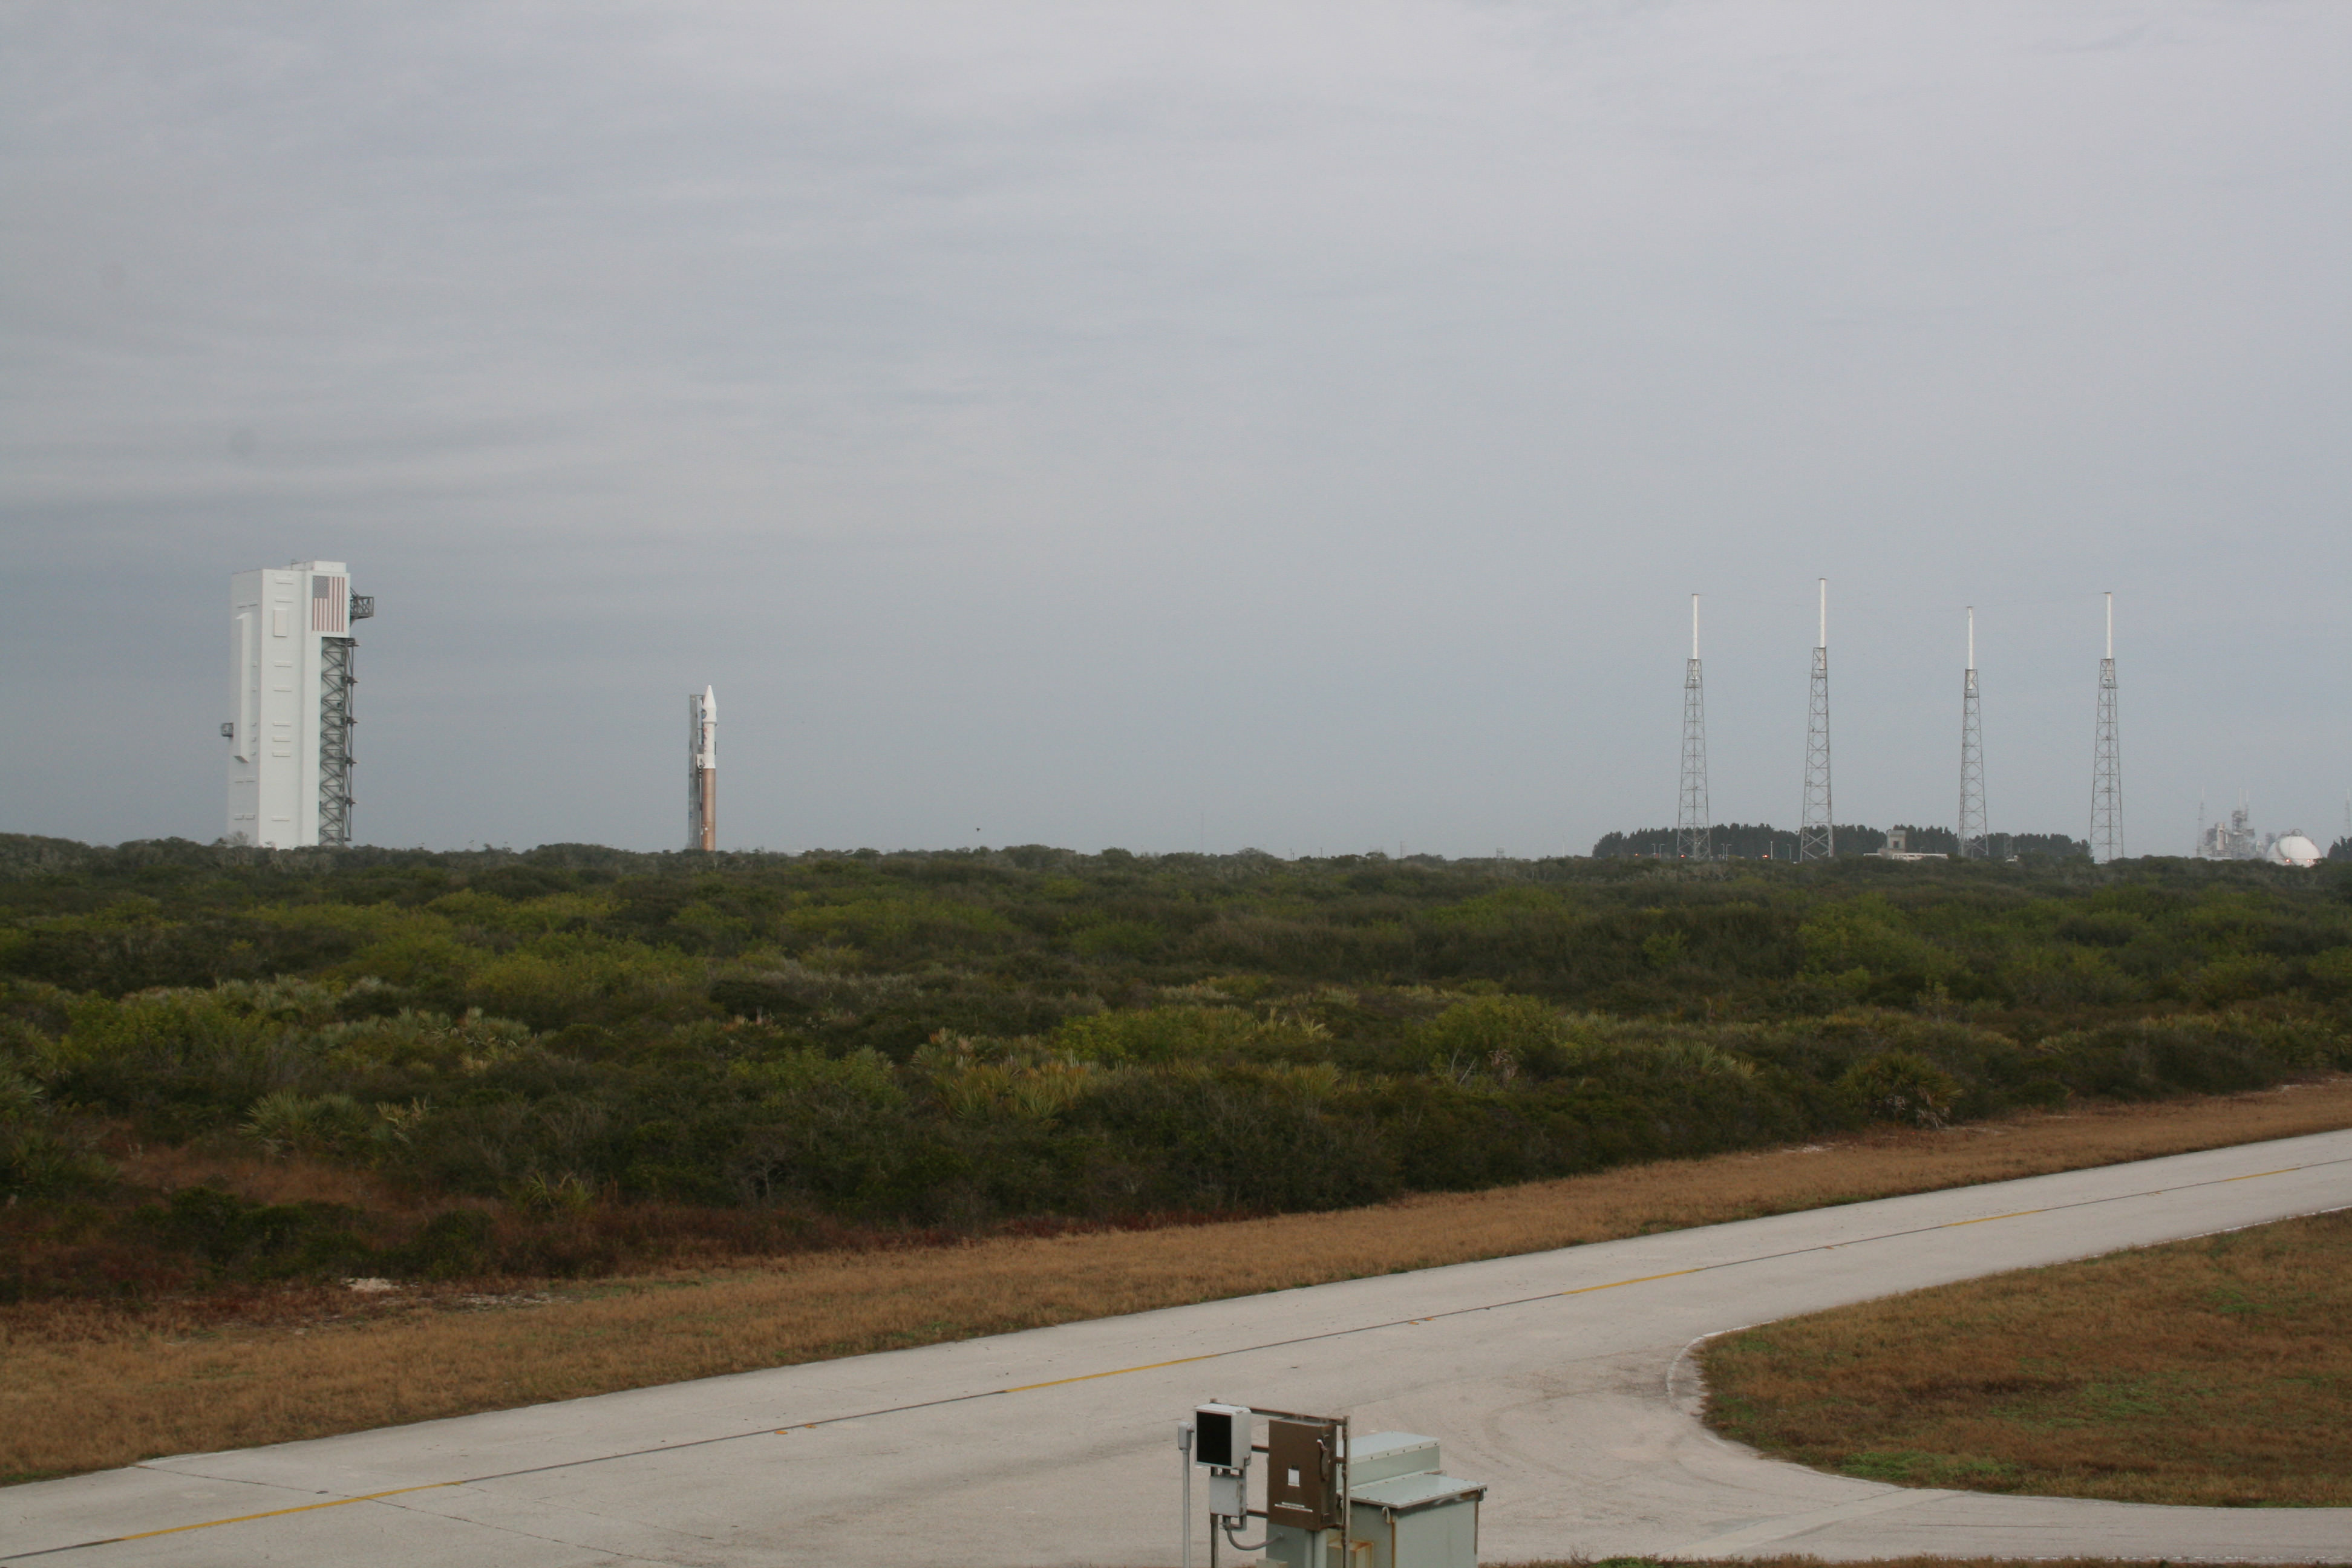
Launch Complex 41: Atlas rocket was rolled from VIF at left to pad at right on Feb 9, 2010. Credit: Ken Kremer
[/caption]
(Editor’s Note: Ken Kremer is at the Kennedy Space Center for Universe Today covering the launch of SDO and Endeavour.)
NASA’s nearly $1 Billion hi tech sun probe, the Solar Dynamics Observatory or SDO, was rolled out today (Feb 9) to Launch Pad 41 on a rainy day here in Florida at 1 day from blast off. SDO will be carried aloft atop an Atlas V rocket at 10:26 AM EST on Feb 10 at Cape Canaveral Air Force Station. The launch window extends for 1 hour. The current weather prediction is only 40% “GO”. The primary concerns for launch day are ground winds with gusts and thick clouds.
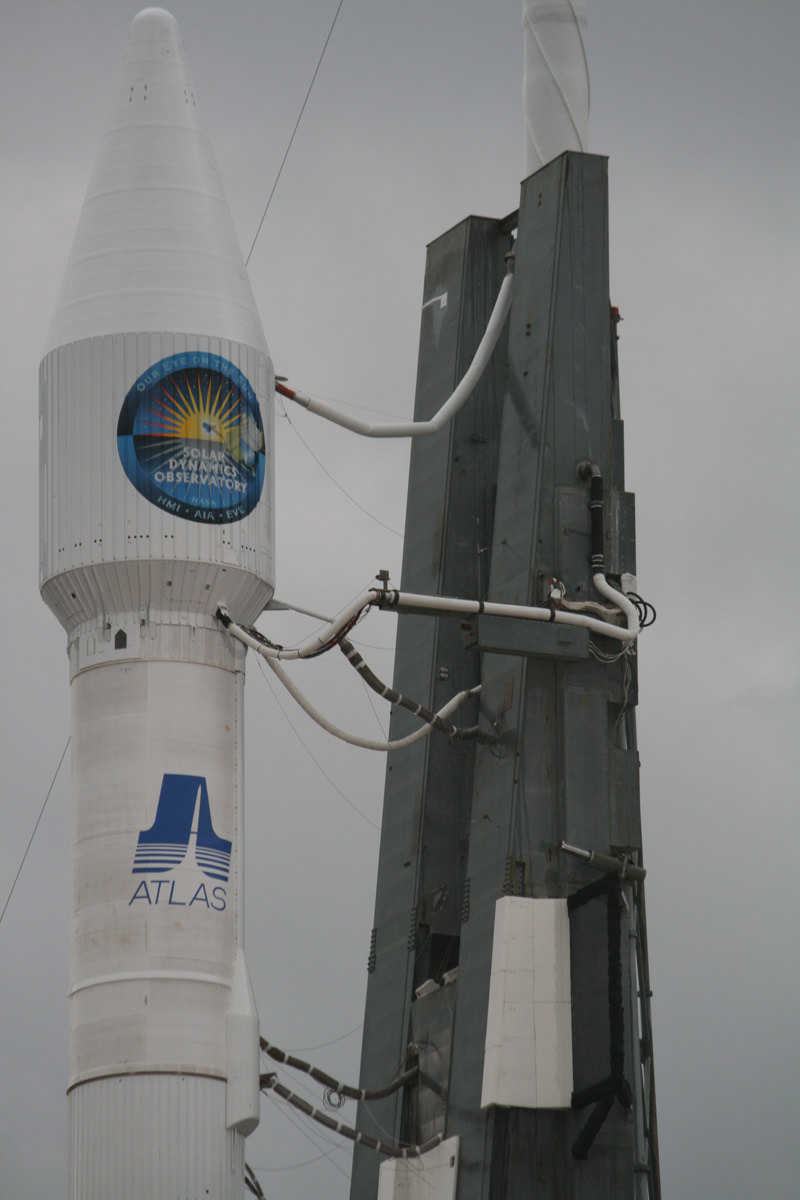
NASA’s SDO sun explorer is encapsulated inside 4 meter payload fairing and is bolted atop Centaur Upper Stage of Atlas V rocket at Launch Complex 41. Umbilical lines at right carry cryogenic propellants, electrical power and purge gases. Credit: Ken KremerAt the Kennedy Space Center, I was thrilled to watch the rocket rollout to the pad this morning as part of a NASA Media event along with Universe Today Senior Editor Nancy Atkinson. We were accompanied by a group of SDO managers and science investigators from across the country. The rollout started from inside the 30 story gantry known as the VIF, or Vertical Integration Facility, and ended at the launch pad. It took approximately 35 minutes for the twin “trackmobiles” to push the Atlas rocket about 1800 ft along railroad tracks.
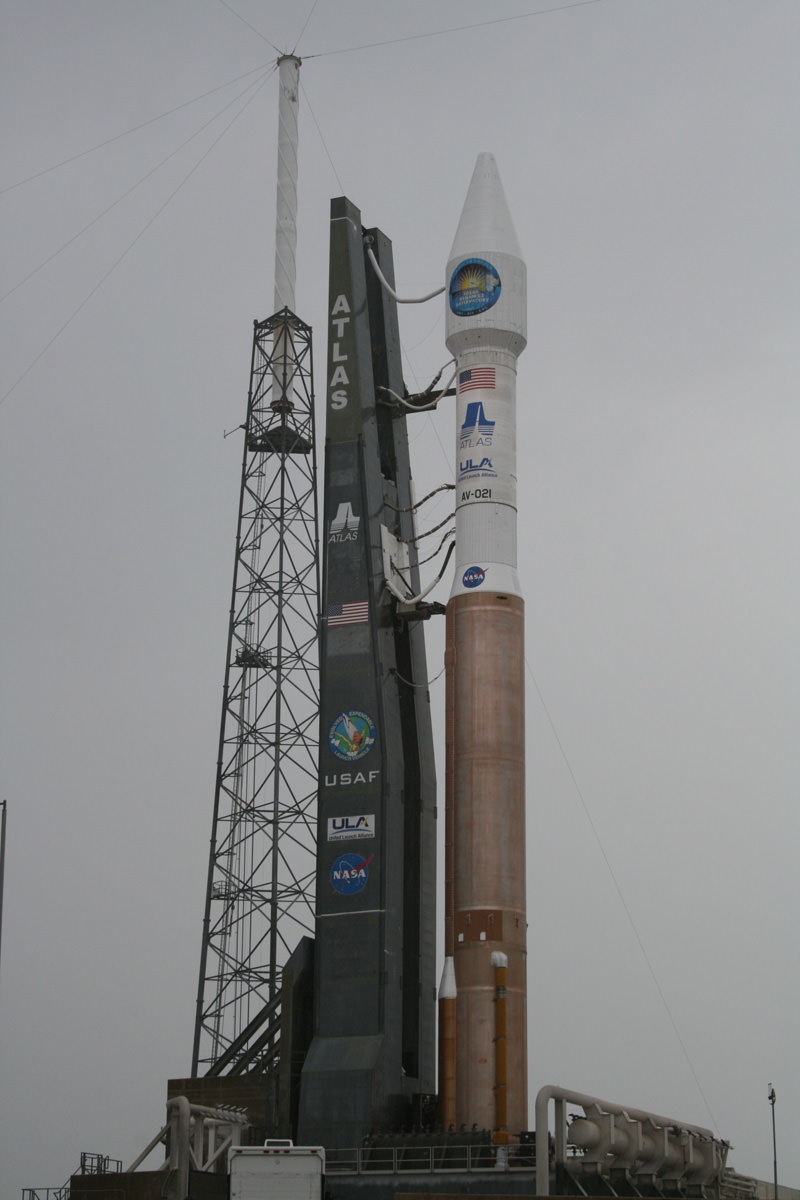
Atlas V booster is 12.5 ft in diameter and 106.5 ft in length. Centaur Upper Stage is 10 ft in diameter and 41.5 ft long. SDO payload fairing is 14 ft in diameter. Total Vehicle height is about 189 ft. Credit: Ken KremerThis afternoon I traveled directly inside the highly restricted security zone which surrounds Launch Complex 41 for a photo shoot to observe the assembled Atlas V rocket and SDO spacecraft directly at the pad. Fantastic experience despite the rainstorm.
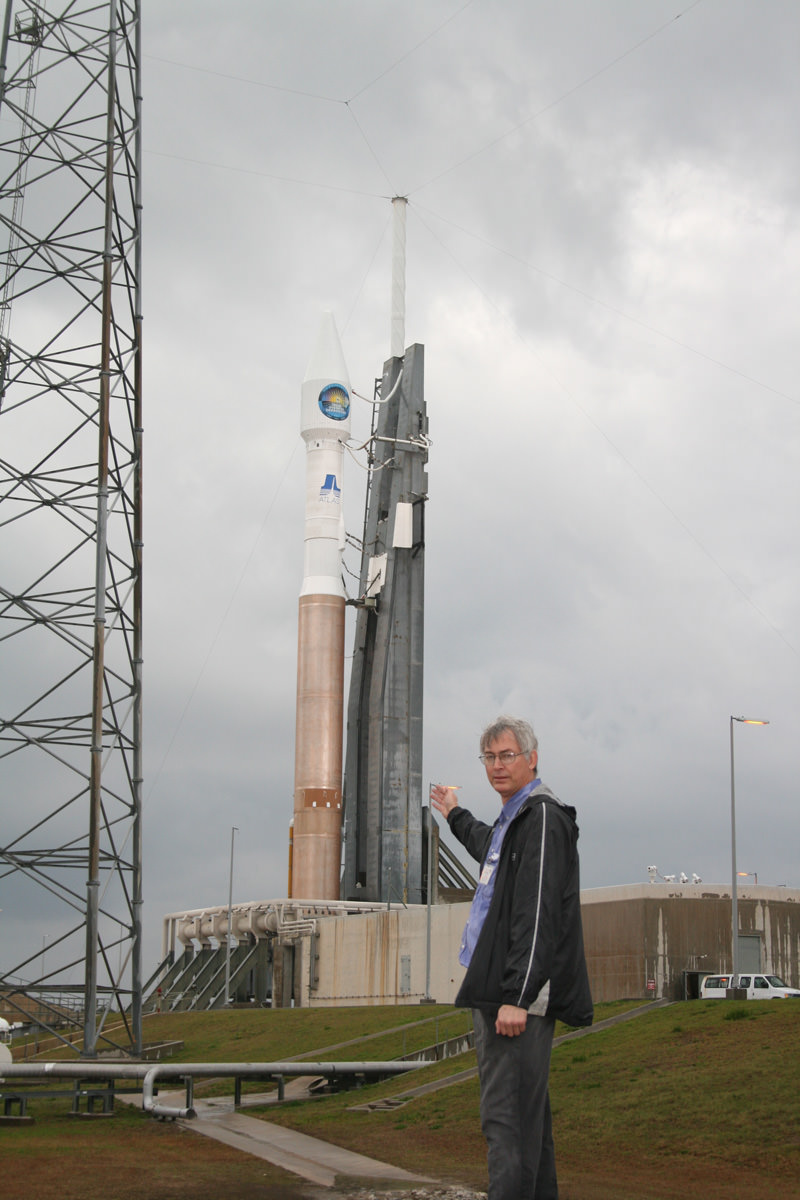
SDO, Atlas V and Ken in ditch below rocket less than 24 hours from blast off. Credit: Ken Kremer
SDO project scientist Dean Pesnell told me in an interview today that “SDO will acquire movies of the entire surface of the Sun on a 24/7 basis with 10 times greater resolution than High Definition. That’s about equivalent in size to an IMAX movie”. The three science instruments will collect a staggering 1.5 terabytes of data per day which is equivalent to downloading 500,000 songs. The data will be beamed back continuously to two dedicated ground stations in New Mexico which were specially constructed for SDO. There are no on board recorders due to the huge volume of data.
“It’s perfect timing to launch and study the sun as it starts the rise to a solar maximum,” according to Pesnell. “The sun patiently waited for us to be ready to launch as we waited for a launch opportunity. After a long period of inactivity, Sun spots recently started appearing at the North Pole. And they also just started at the South Pole”.
“SDO was conceived by the scientists around 1996 and formally approved by NASA in 2002”, Prof. Phillip Scherrer said to me. He is the Principal Investigator for the Helioseismic and Magnetic Imager (HMI) instrument.
“The primary mission phase will last 5 years and hopefully extend out to 10 and perhaps even longer. The longevity depends on the health of the science instruments. Remember SOHO was projected to last 2 years and has now operated for over 15 years ! “
HMI will study the origin of solar variability and attempt to characterize and understand the Sun’s interior and magnetic activity.
Both HMI, and the Atmospheric Imaging Assembly, or AIA, will allow scientists to see the entire disc of the sun in very high resolution — 4,096 by 4,096 mm CCDs. In comparison, a standard digital camera uses a 7.176 by 5.329 mm CCD sensor.
AIA also will image the outer layer of the sun’s atmosphere, while the Extreme ultraviolet Variability Experiment, or EVE, measures its ultraviolet spectrum every 10 seconds, 24 hours a day.
We are now less than 12 hours from launch of SDO, NASA’s “New Eye on the Sun”.
Read my earlier SDO reports, including from on site at the KSC launch pads for both SDO and STS 130.
Atlas rocket has been rolled to pad 41 on Feb 8, 2010 and is locked in place surrounded by four lightening masts. Credit: Ken KremerAtlas V rocket begins the 1800 ft rollout from VIF to Pad 41. Credit: Ken Kremer
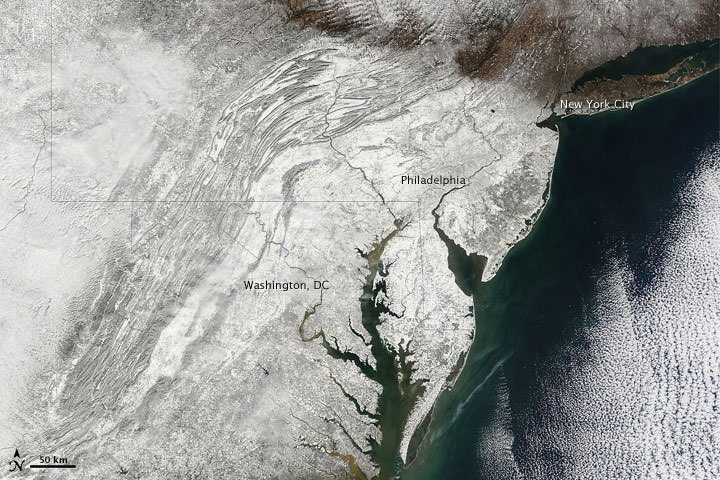
The big snowfall of February 2010 as seen from space. Credit: MODIS Rapid Response Team at NASA GSFC.
[/caption]
Did you live through what has been called “snowmageddon” or “snowpocalypse?” Here’s a satellite’s-eye view of the exceptionally severe winter storm in the Eastern US that dropped several feet of snow on Feb. 6 and 7. Reports of crashed and abandoned cars and hundreds of cancelled flights were interspersed with stories of massive snowball fights. The huge snowfall may hinder highway traffic into midweek, and hundreds of thousands lost electricity. The image comes from the Moderate Resolution Imaging Spectroradiometer (MODIS) on NASA’s Terra satellite. Snow blankets the area hundreds of kilometers inland from the Atlantic coastline.
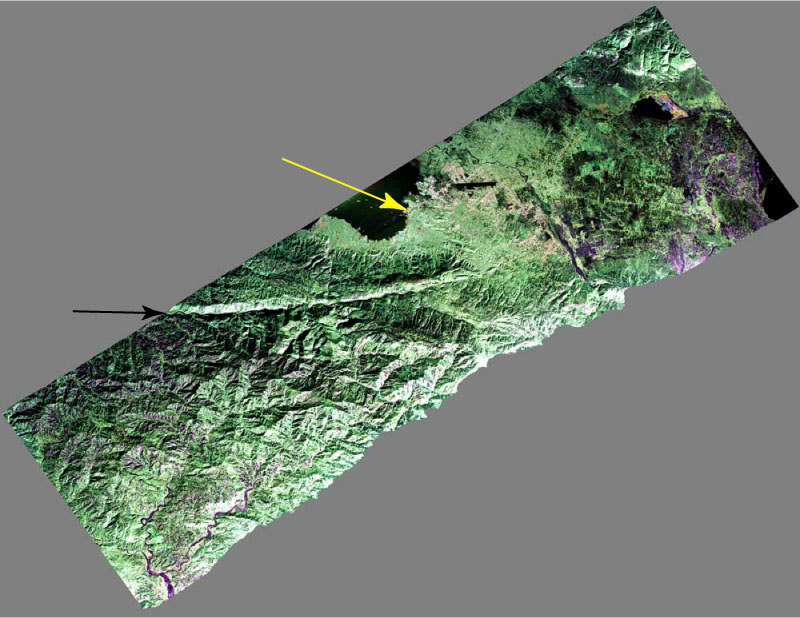
False-color composite image of the Port-au-Prince, Haiti region, taken Jan. 27, 2010 by NASA’s UAVSAR airborne radar. The city is denoted by the yellow arrow; the black arrow points to the fault responsible for the Jan. 12 earthquake. Image credit: NASA
[/caption]
A modified NASA Gulfstream III aircraft began a three-week campaign to provide a close-up study of the fault lines in Haiti with radar. This first image, captured on Jan. 27, 2010 is a false-color composite image of the city of Port-au-Prince, Haiti, (near the center of the image) and the surrounding region. This image and subsequent images taken by the Uninhabited Aerial Vehicle Synthetic Aperture Radar (UAVSAR) will be combined to measure the motion of Earth’s surface. The earthquake in Haiti on January 12, 2010 has increased the stress on this fault line, significantly increasing the risk of a future earthquake, according to a recent report by the U.S. Geological Survey.
The UAVSAR uses a technique called interferometry. The polarimetric L-band synthetic aperture radar (SAR) specifically designed to acquire airborne repeat track SAR data for differential interferometric measurements, and these measurements will allow scientists to study the pressures building up and being released on the fault at depth. NASA Grumman Gulfstream III (G-III) in flight with the UAVSAR instrument. Credit: NASA
Shortly before 5 p.m. local time on Jan. 12, 2010, a magnitude 7.0 earthquake struck southern Haiti. The earthquake’s epicenter was about 25 kilometers (15 miles) west-southwest of Port-au-Prince, close to the west (left) edge of this image. The large linear east-west valley in the mountains south of the city is the location of the major active fault zone responsible for the earthquake: the Enriquillo-Plantain Garden fault.
The fault extends from the western tip of Haiti past Port-au-Prince into the Dominican Republic to the east of this image.
Satellite interferometric synthetic aperture radar measurements show that the Jan. 12 earthquake ruptured a segment of the fault extending from the epicenter westward over a length of about 40 kilometers (25 miles), leaving the section of the fault in this image unruptured.
Historical records show that the southern part of Haiti was struck by a series of large earthquakes in the 1700s, and geologists believe those were also caused by ruptures on this fault zone.
The large dark line running east-west near the city is the main airport.
The colors in the image reflect the three different UAVSAR radar polarizations: HH (horizontal transmit, horizontal receive) is colored red; VV (vertical transmit, vertical receive) is colored blue; and HV (horizontal transmit, vertical receive) is colored green. Like a pair of Polaroid sunglasses, these images are sensitive to different parts of the radar signal that is reflected back from Earth’s surface. The HV polarization is sensitive to volume scattering that typically occurs over vegetation—this gives hills a greenish color. VV polarization is sensitive to surface scattering such as that returned from bare surfaces or water—this gives water a bluish tint. Finally, HH polarization is sensitive to corner-like objects—this gives some urban areas and vegetated regions a reddish tint. The image is roughly 20 kilometers (12.5 miles) wide in the northwest-southeast direction. North is up and radar illumination is from the southeast.


 in flight with the UAVSAR instrument. Credit: NASA")