[/caption]
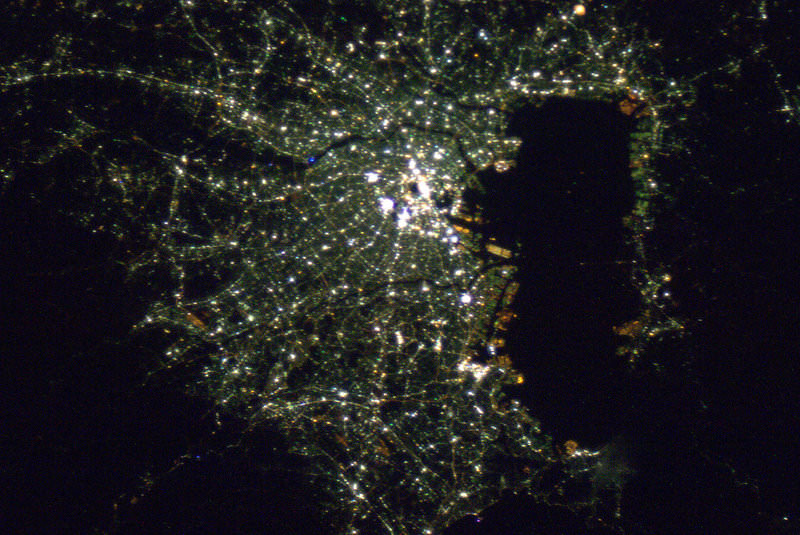
“Golden Gate Bridge, San Fransisco, CA. Beautiful shadow :-),” tweeted Astronaut Soichi Noguchi along with a live image he shot from space from inside the International Space Station.
The 5 man crew comprising Expedition 22 aboard the ISS now have the capability to transmit live, unfiltered views and comments from space. And whats more is that starting on Feb. 1 they’ll be streaming live video from the outpost, orbiting some 220 miles above the earth while speeding along at 17,500 MPH.
Astronaut TJ Creamer twittered the first unassisted post only 1 week ago on Jan 22.
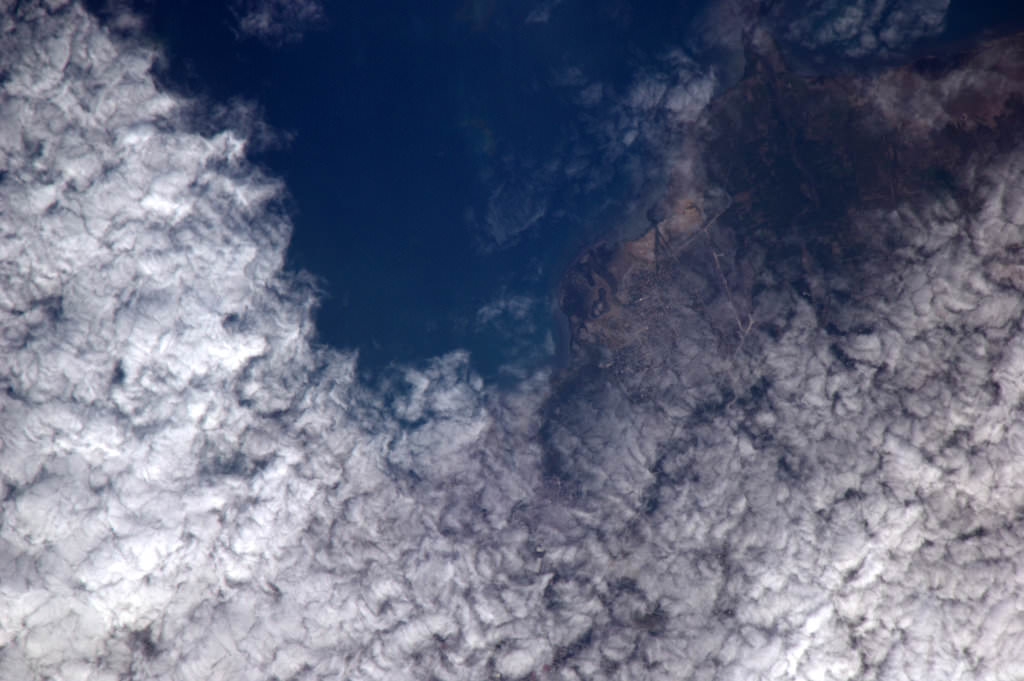
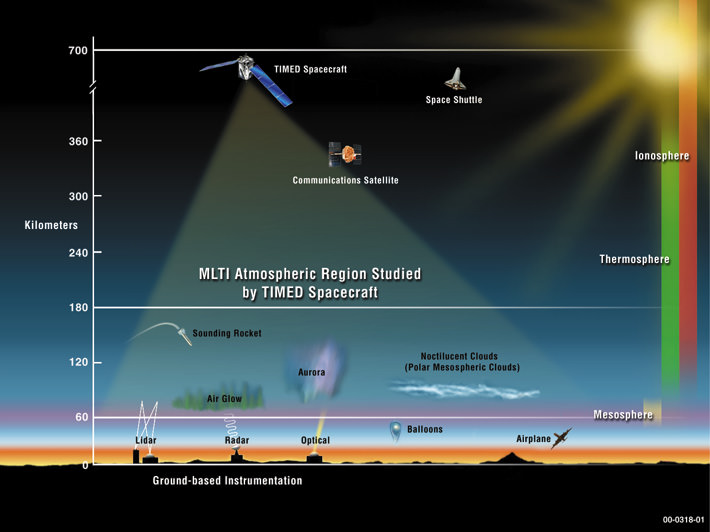
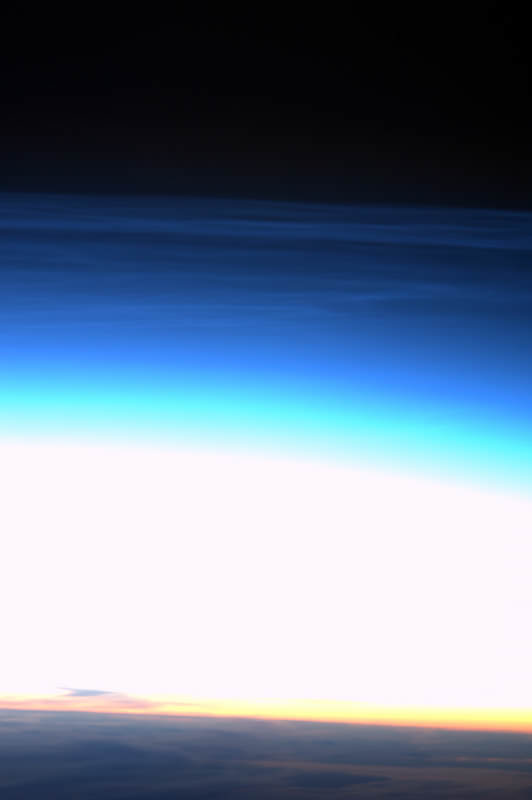
Yesterday afternoon (Jan 30) he tweeted about his next picture targets, “Gonna try to take some pix of the Moon and the mesospheric clouds.”
Noguchi tweeted on Jan 29, that he was working with the Japanese robotic arm (JEMRMS) which is attached to Japan’s giant “Kibo” science research module. “JMSRMS is working just fine-just like sim on the ground. I am very excited. The task is to check the status of external experiment facility. KOOL:-).” Kibo is the largest research laboratory on the ISS.
You can follow all the tweets from three of the crew; Astronauts Soichi Noguchi, TJ. Creamer and Jeff Williams at this link: http://twitter.com/NASA_Astronauts
“Great Saturday on board ISS. Taking photos of Earth, preparing for Shuttle arrival, Station maintenance, and calls home.” Reports Jeff Williams in the newest tweet.
“Our internal cameras wlll stream to the Web beginning Monday [Feb 1] ! Wave when you see us!! :)” tweets Creamer.
The live video will be available during all crew duty hours and when the complex is in contact with the ground through its high-speed communications antenna and NASA’s Tracking and Data Relay Satellite System. Live streaming video of the earth and the stations exterior has been available since March 2009.
Meanwhile, everything remains on schedule for the Feb. 7 launch of STS 130 to deliver the Tranquility and Cupola modules.
Earlier STS 130 article by Ken Kremer
Path clear for STS 130 to attach Tranquility module
Endeavour aiming for on time launch with coolant hose fix ahead of schedule
STS 130 flight pressing forward to launch as NASA resolves coolant hose leak
STS-130 Shuttle flight facing delay due to Payload technical glitch
Shuttle Endeavour Rolled to Pad; Countdown to the Final Five Begins
Tranquility Module Formally Handed over to NASA from ESA